After 10 years of strategies, initiatives and policies from all three major parties, housing remains a top priority for politicians. What was set out a decade ago in the Barker review as a looming challenge is now universally recognised as a major social and economic concern. In order to bring some stability to the market, each mainstream party has committed to tackling the housing crisis, and in particular, to delivering a step change in the scale of new house building across the country – with the Liberal Democrats and Labour each setting targets to at least double the output.
However, the data in Cities Outlook 2015 – which looks back over 10 years of urban housing affordability – once again highlights that rather than a ‘national crisis’, difficulties in the housing market are most acute in a number of specific cities. In particular, it is the UK’s most economically successful cities that are now least affordable to live in, and are therefore most in need of new homes.
Although over the last decade average house prices have risen in cities right across the country, there has been a clear divergence between cities in the South of England and other UK Cities. Southern cities’ house prices increased by two thirds over the last 10 years (67 per cent), while in cities elsewhere it was around a quarter (26 per cent).
The profit made on a house bought in a southern city in 2004 and sold in 2014 alone would be enough to buy an average house outright in other UK cities.
Figure 1: House Prices 2004-14 by area

To measure what this means for people in different cities, we need to contextualise house prices by comparing them with local incomes – housing affordability. Doing so shows just how divergent the performance of local economies and housing markets are across the country – house prices range from 4.7 times local incomes in Burnley to 14.6 times income in Oxford.
And broader patterns of activity also emerge clearly. Each of the 10 least affordable cities over the last decade are located in the South of England, with the majority performing strongly across a range of economic indicators – such as jobs growth and growth in the number of businesses.
Figure 2: Affordability 2004-14 by area (house price to income ratio)
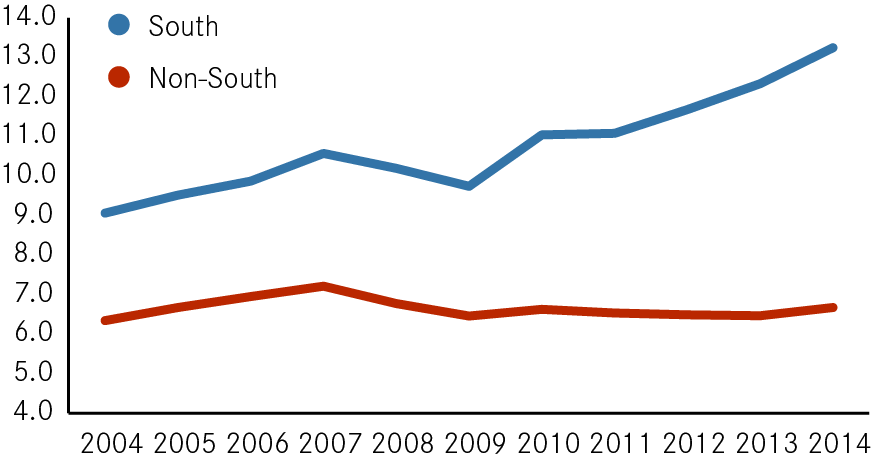
Yet despite higher average incomes in these southern cities, affordability has diverged even further than prices – the average cost of a home in cities in the South of England has risen from 9.1 times average earnings to 13.2, while in other UK cities this figure has risen only marginally, from 6.3 times average earnings to 6.7.
In part these differences can be explained by the fact that population increases within cities in the South of the country have not been matched by increases in the supply of new homes. For example, despite seeing their populations expand at twice the rate of cities in other parts of the UK over the last ten years, more homes have been built per head in Wigan (304 net additional dwellings per 10,000 people) than Oxford (229) or London (264) – the least affordable cities.
Figure 3: Change in Housing Stock and Population 2004-14 by area

This is beginning to have major implications for our most successful city economies, as more people risk being priced out of the economic opportunities they offer, leaving businesses facing increased difficulties in recruiting the talent they depend upon.
The increased pressure on housing affordability in these places shows that our politicians are right to make increasing the supply of new housing a major priority in the next Parliament. But the data in this year’s Outlook also reminds us that where these new homes are built will be just as important as how many.
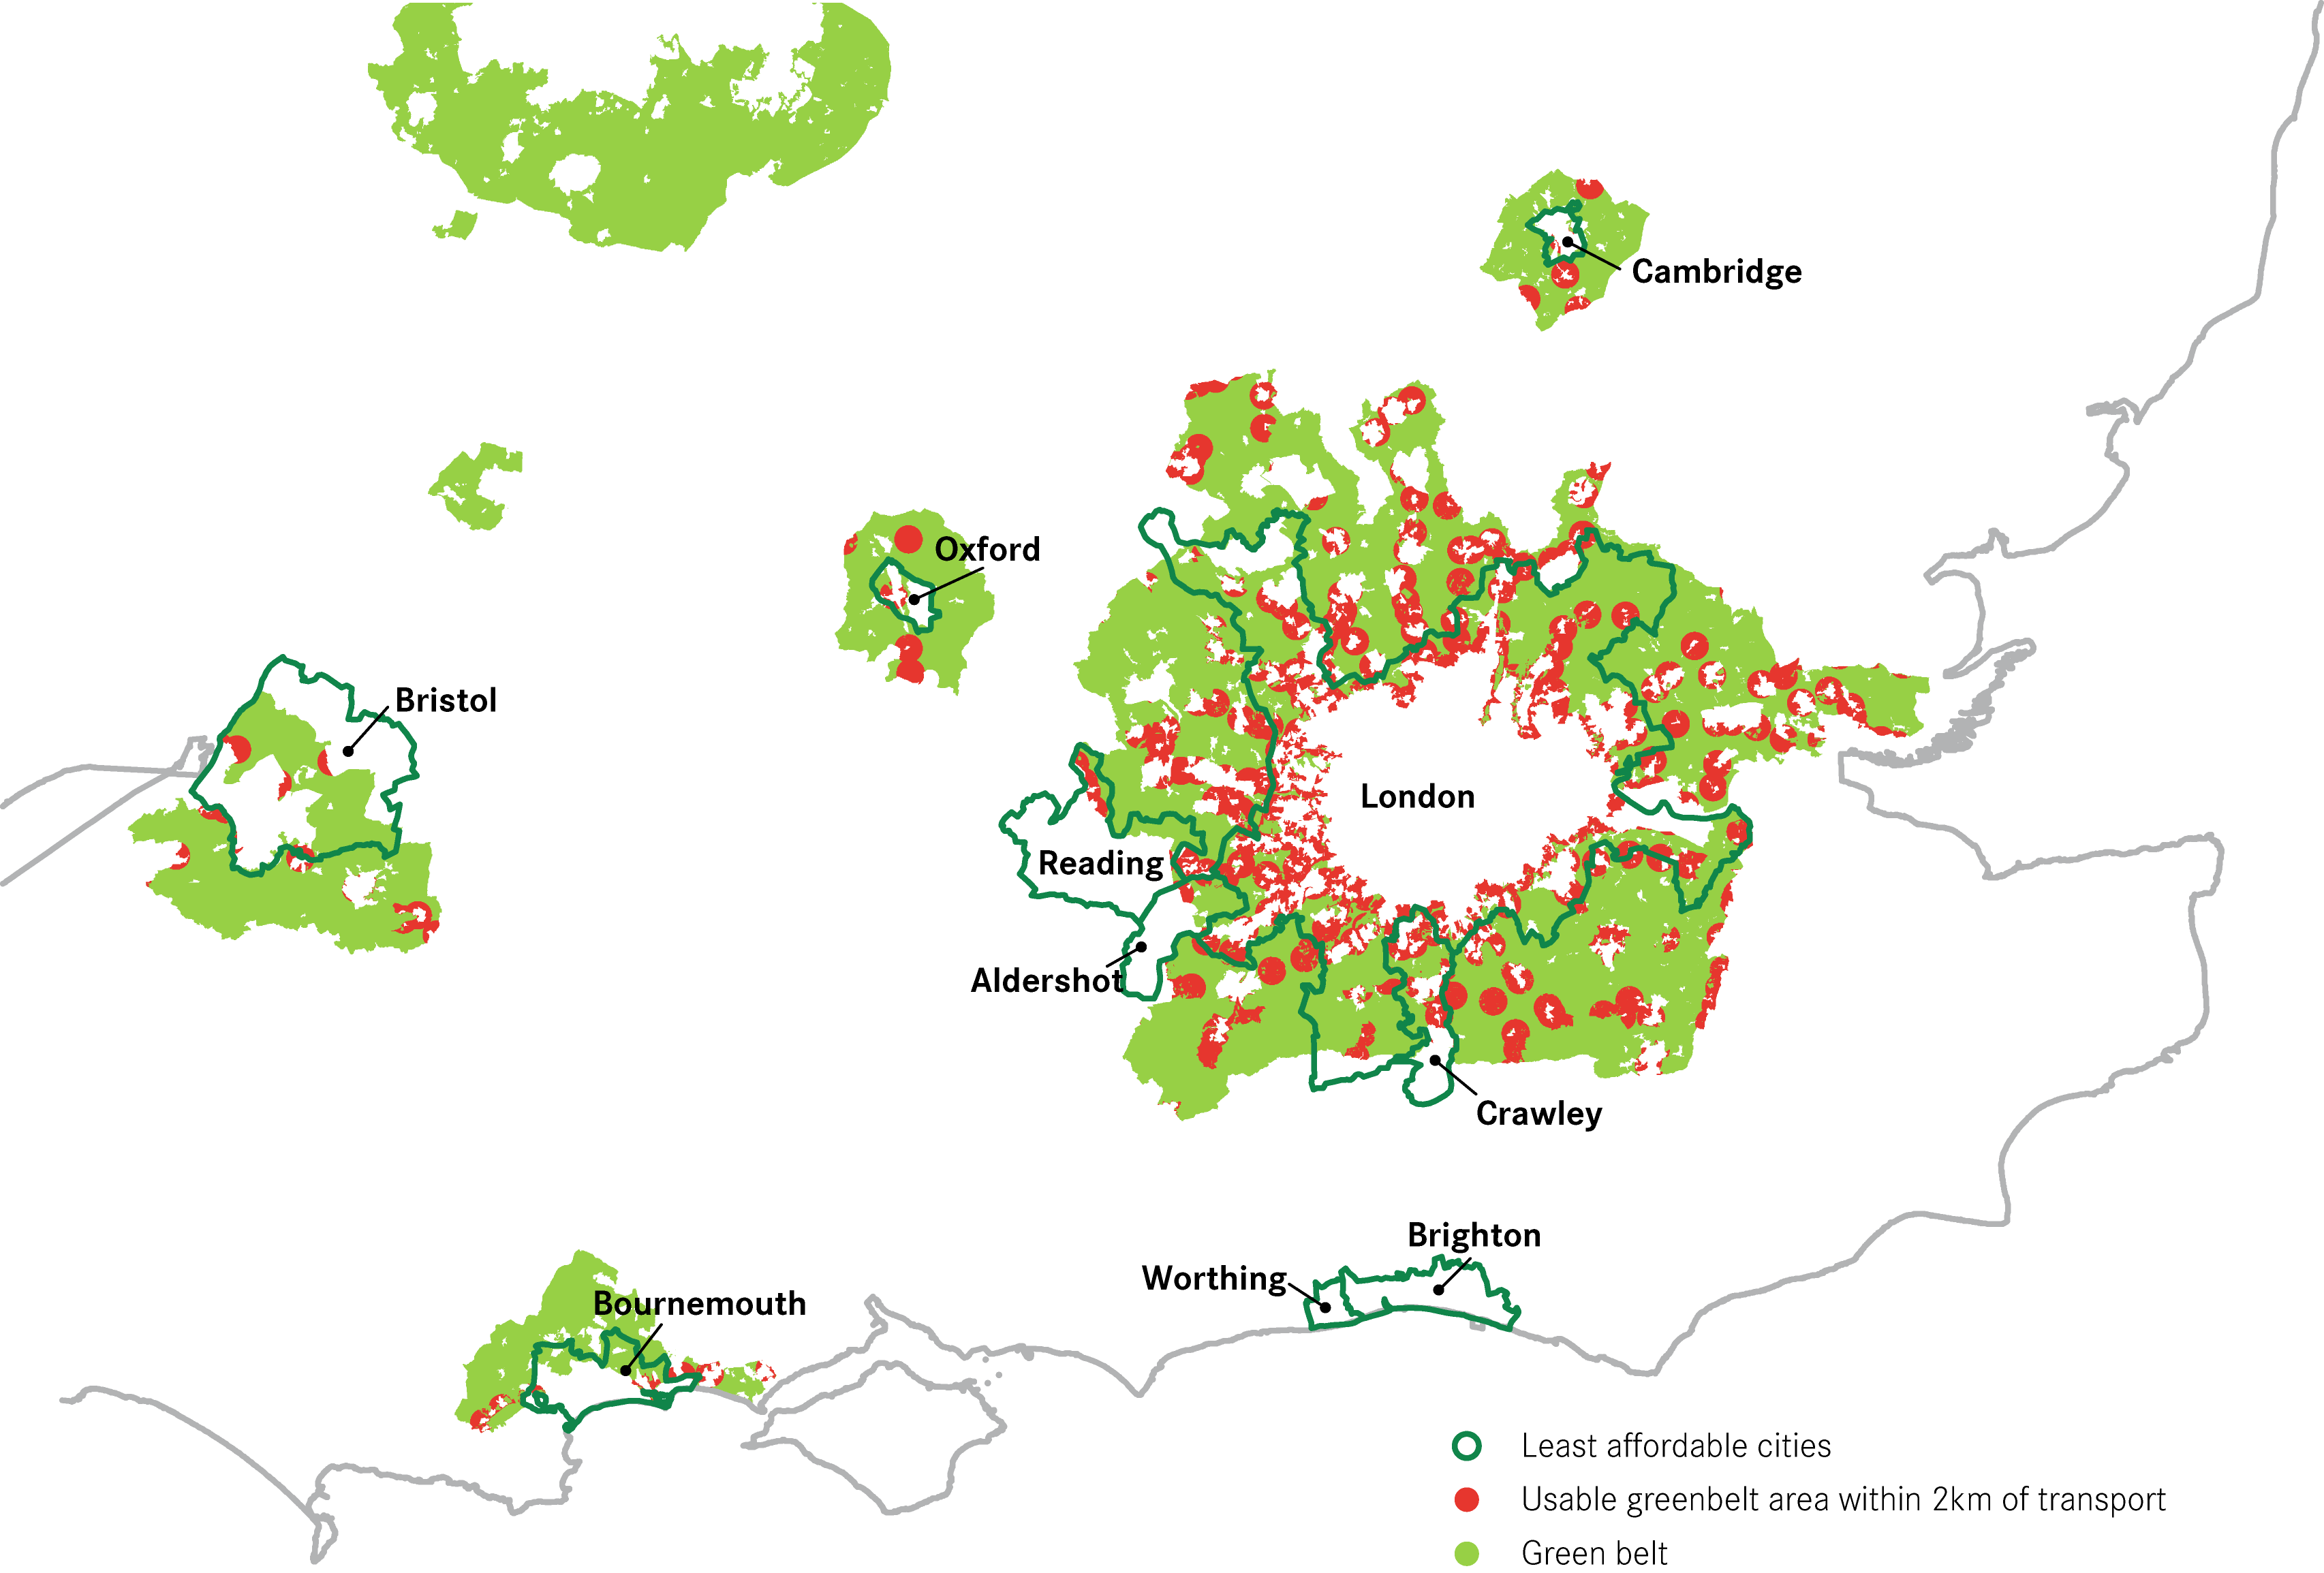
Building homes where they are most needed will require both national and local politicians taking difficult decisions over the supply of land for new housing in close proximity to some of our most successful cities – even if, as our recent report recommends, that means building on select parts of the Green Belt.
Figure 4: Green Belt areas close to transport


Leave a comment
Be the first to add a comment.