
What Oxford and Telford tell us about the UK’s net zero goal
Oxford and Telford have very different carbon footprints per head. The way they are spatially planned might explain why.
Oxford and Telford have very different carbon footprints per head. The way they are spatially planned might explain why.
Carbon footprints vary from one end of the country to the other. Sometimes, the reason for this is quite obvious: Swansea and Middlesbrough, for instance, rank well above all other UK cities because of the presence of polluting industrial activity within their boundaries.
But in most cases, the explanation lies elsewhere. Take Oxford and Telford: the average resident in Telford emits an extra tonne of carbon a year compared to Oxford’s residents. And it is not industrial emissions, but transport emissions, which explain most of the gap. So, why is that the case?
A significant part of the answer relates to the cities’ spatial footprint. Both cities have a very similar population size but Oxford’s built up area is much denser than Telford’s. In Telford, 82 per cent of the population live in areas with less than 4,000 people per square kilometre, typically far from the city centre, while this account for 48 per cent in Oxford (see Figure 1, white and pink areas).
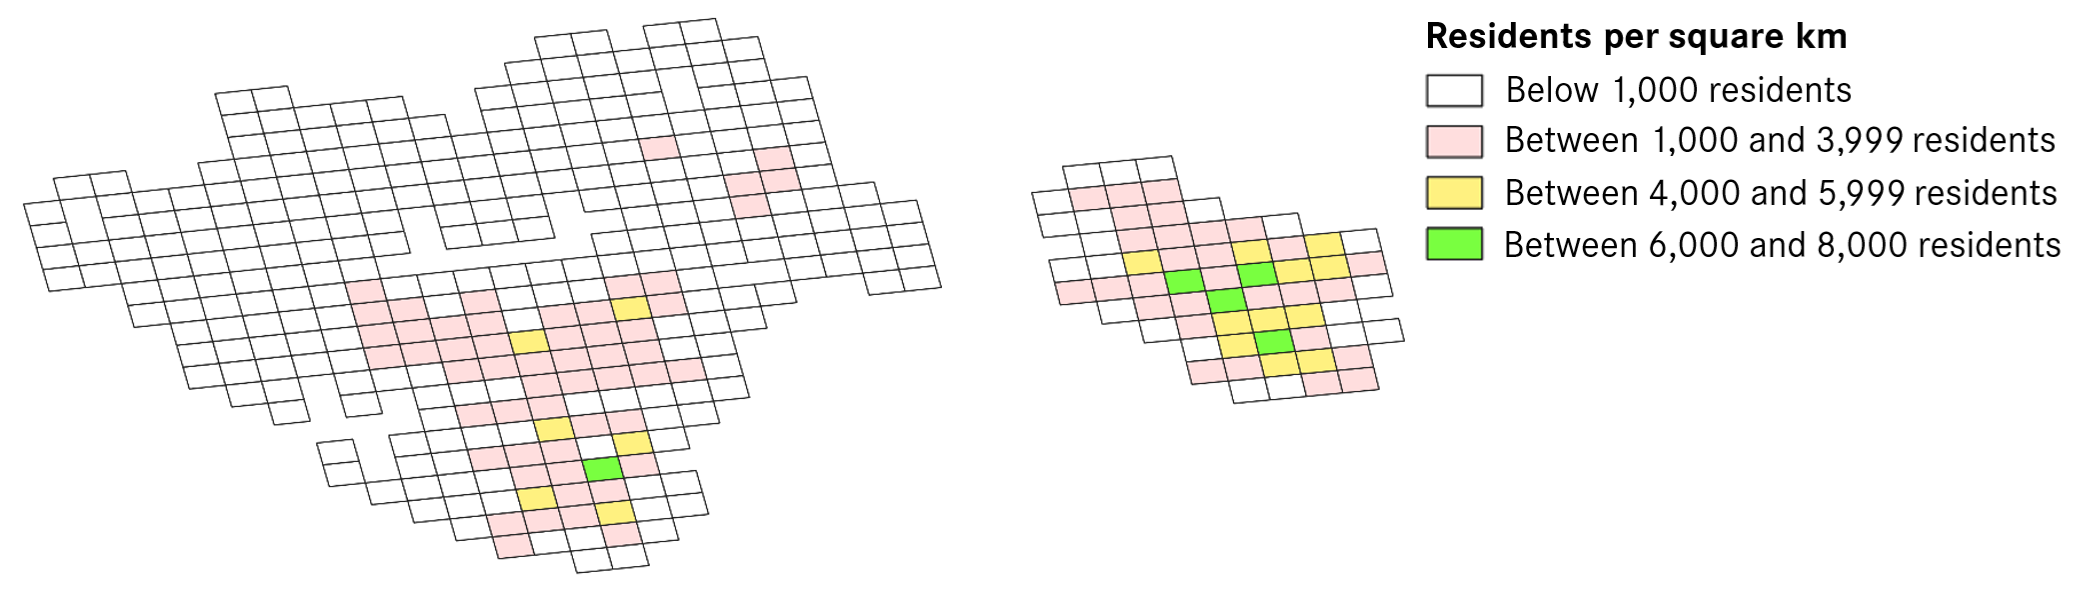
Source: Eurostat, 2018.
This shapes behaviours and travel patterns. How we get around – from how we go to work, shop or pick up kids from school – is largely influenced by our immediate built environment. Denser urban environments make it easier to leave the car behind: proximity to jobs or amenities means that trips are shorter, so they can more easily be walked or cycled. Public transport is more viable, too, because there are more people living close to transit stops. Census data confirms this: in Oxford, more than half of journeys are walked, cycled or made on public transport, which is much higher than the national average (32 per cent) especially outside London (24 per cent). Of course, in Oxford the student population might justify higher cycling rates; but the city’s dense spatial layout largely explains the higher public transport usage. By contrast, in Telford, people overwhelmingly rely on their car (Figure 2).
But there is more to it. What really matters is not the number of public transport stops available in a given area. In fact, data from the carbon.place tool shows that both cities have a fairly similar number of bus stops (Figure 3).
![]()
Source: carbon.place (2021)
What really has an influence on public transport uptake, and where both cities diverge, is the frequency of the service. Figure 3 shows that Oxford’s public transport is of much better quality (blue dots on the map) than Telford’s (orange dots). This directly explains why public transport is a first choice for many more people in Oxford, as it is much easier to opt for the bus when service is frequent. In Oxford, about 60 per cent of the population lives in a square kilometre where there are more than 10 services per hour; while in Telford, nearly half of the population (45 per cent) live in an area with less than 3 services per hour.[1]
The first is that investing in public transport infrastructure does not necessarily mean running new routes. Especially in smaller cities where the existing network does not operate a full capacity, increasing the frequency of the service on existing routes is a good first step. Local transport authorities now need to make use of the power that was given to them through the 2017 Bus Act, which allows them to take control of the network’s service, including timetables, through bus franchising.
But the above alone will not be enough. To make them work, interventions which encourage public transport uptake must be done in conjunction with spatial planning policies. This takes us back to the importance of density: the reason why Oxford’s public transport system is more reliable is because its routes serve more densely populated areas, which bolsters demand for a more frequent service. The answer to this is to build more houses near existing public transport network rather than scattered, isolated residential developments on the outskirts.
[1] Estimate for the number of different services in a single direction. The number considers the total number of weekly services in a square kilometre and assumes: i) services run 14 hours a day; ii) there is always services in both directions with the same frequency
Leave a comment
Be the first to add a comment.