
Fiscal map shows how combined authorities need to match where people live and work
Three lessons for city-regions from our Mapping Britain's public finances report.
Three lessons for city-regions from our Mapping Britain's public finances report.
The number of local authorities that have come together to form combined authorities has grown steadily over the past couple of years. Partly, this is due to the recognition that the economy operates at a larger than local level, and that coordinating transport, housing and skills policy, for example, are better achieved by collaborating with neighbouring authorities. But there are also more direct incentives from central Government for urban local authorities to form combined authorities (and increasingly more rural areas as well) in the form of devolved powers and budgets, on condition that they formally club together to design policy and manage budgets.
Our recent report, Mapping Britain’s public finances, sheds light on the trends and patterns in taxation and public expenditure across these combined authorities, and illustrates the different ‘roles’ local authorities play at city-region level.
This blog takes a closer look at the data, focusing on the most established and the most recently established combined authorities – Greater Manchester and the West Midlands Combined Authority – and sets out some implications for further devolution, and fiscal devolution in particular. There are three main findings:
In 2013-14, Manchester generated £5.2 billion in ‘economy taxes’ (which includes income tax, national insurance, VAT, and property and capital taxes), compared to £1.9 billion in Trafford, the second biggest contributor in Greater Manchester. This trend was more stark in the West Midlands: Birmingham generated £7.5 billion in economy taxes, compared to £1.3 billion in Coventry, the second largest contributor.


Source: Civil Aviation Authority, CLG, DEFRA, DWP, DECC, HMRC, Land Registry, ONS, NOMIS, Scottish Environment Protection Agency, Scottish Government Statistics and Stats Wales. See appendix for full details. Contains Ordnance Survey Data © Crown copyright and database right 2015.
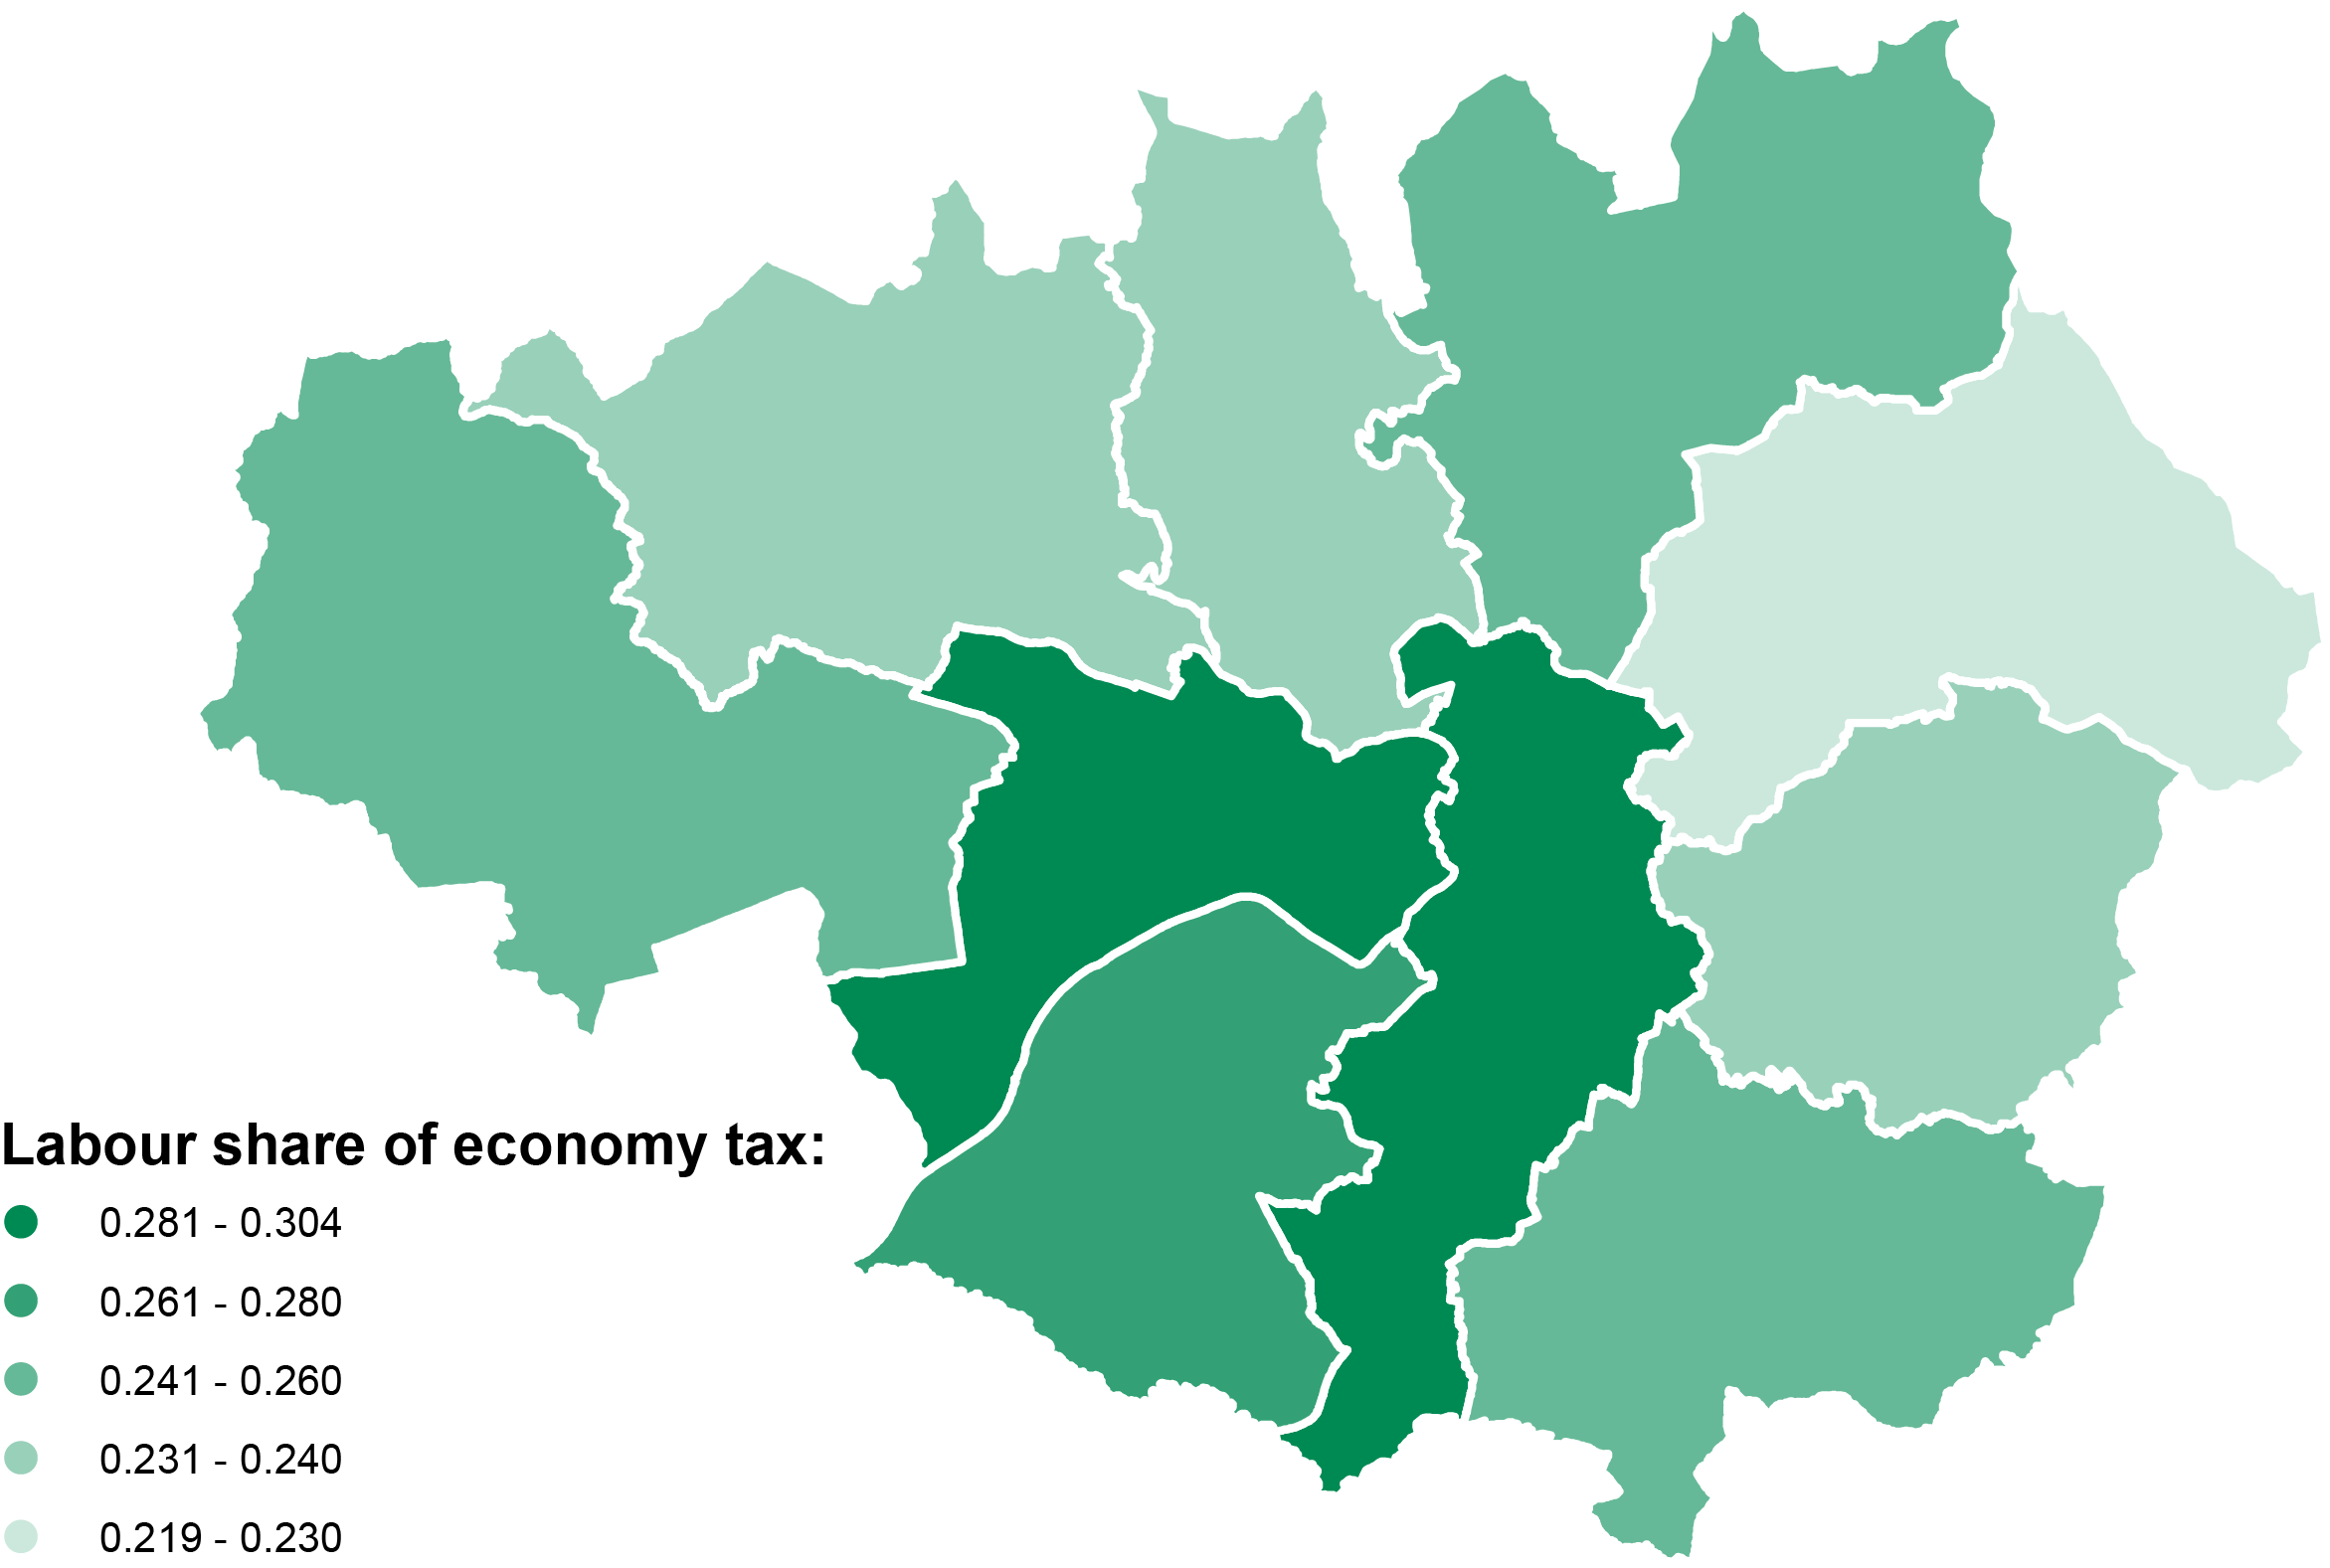
And in both areas, the tax take in the core urban authority shared the same characteristic: it was driven more heavily by taxes on labour than anywhere else in the city region. This reflects higher numbers of jobs in core urban authorities and their role as a hub for employment in both areas.
The data also highlighted something about the productivity of jobs in core urban authorities compared to surrounding authorities in the city-region. While Manchester and Birmingham local authorities accounted for 28 and 41 of jobs respectively, they accounted for 30 and 43 of the total economy tax take, suggesting that jobs in the core urban authority were generating more tax per job than elsewhere. Looking at labour taxes raised per capita, on average £9,390 per worker was raised in Manchester, with Salford generating £8,775 per worker – the second highest contribution per job in the city region.


Source: Civil Aviation Authority, CLG, DEFRA, DWP, DECC, HMRC, Land Registry, ONS, NOMIS, Scottish Environment Protection Agency, Scottish Government Statistics and Stats Wales. See appendix for full details. Contains Ordnance Survey Data © Crown copyright and database right 2015.
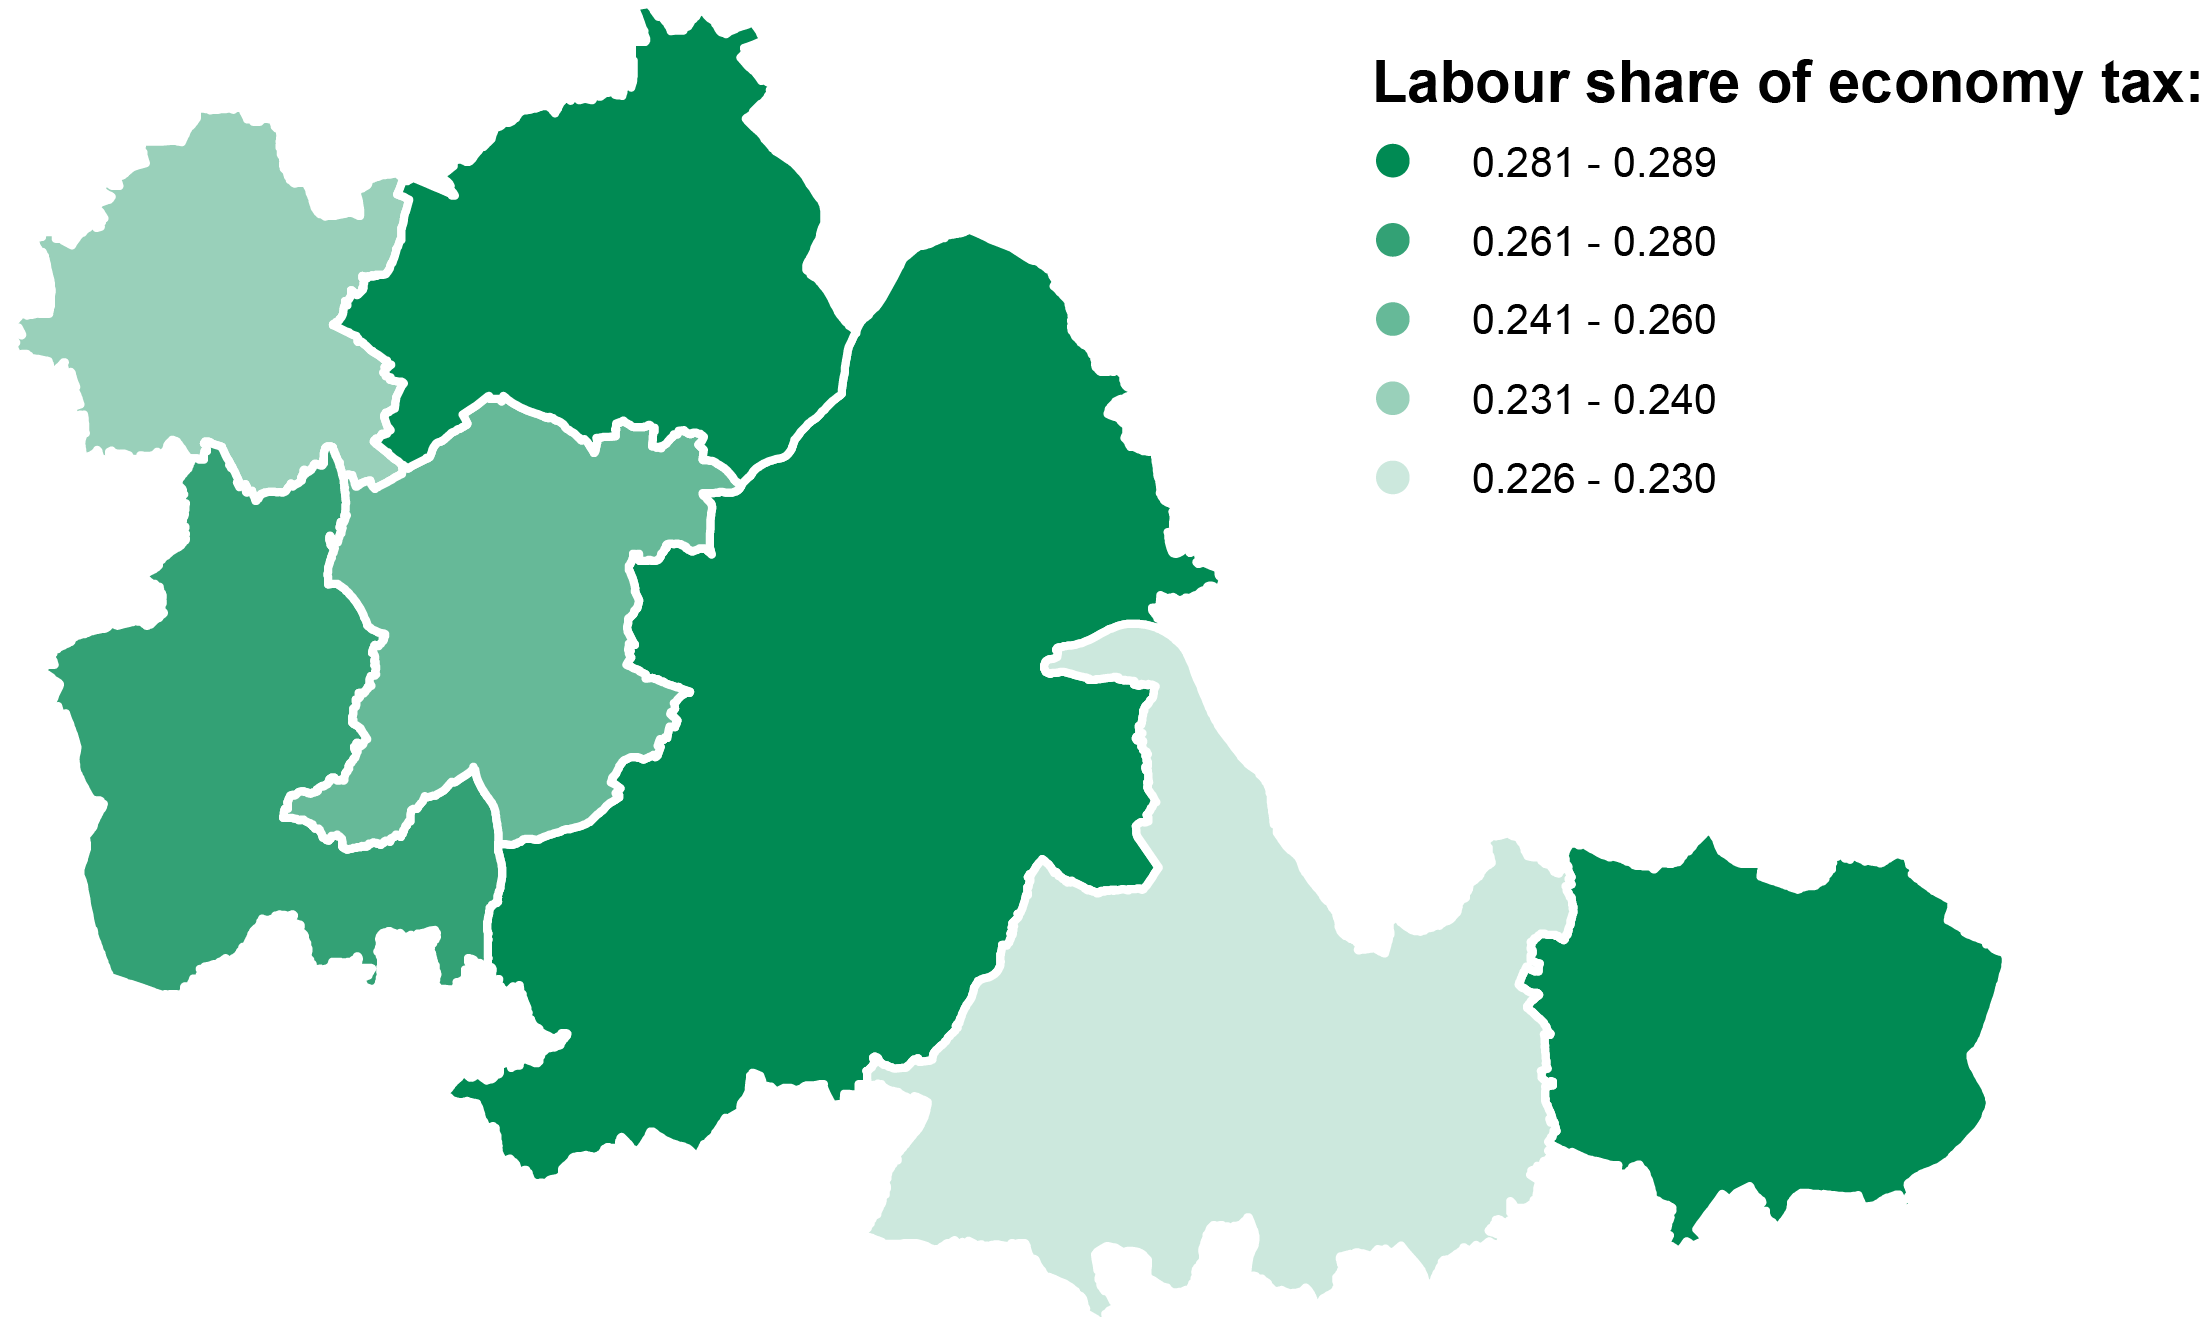
The relationship was less clear cut in the West Midlands – Solihull and Coventry had a higher tax take per worker than Birmingham local authority. This tells us something about how monocentric Greater Manchester is compared to the West Midlands. Although Birmingham raises significantly more tax in absolute terms, Birmingham as well as Coventry ‘perform’ to a certain extent the role of a core urban authority, both raising relatively similar proportions of labour taxes raised as a share of the total economy tax take. In Greater Manchester, however, the difference between Manchester and all other authorities looking at labour taxes as a share of total economy taxes is quite significant.
Source: Civil Aviation Authority, CLG, DEFRA, DWP, DECC, HMRC, Land Registry, ONS, NOMIS, Scottish Environment Protection Agency, Scottish Government Statistics and Stats Wales. See appendix for full details. Contains Ordnance Survey Data © Crown copyright and database right 2015.
Land and property taxes, such as council tax and stamp duty, on the other, made up a much higher share of the tax take in surrounding authorities. Only 14 per cent of council tax generated across Greater Manchester was raised in Manchester, compared to 31 per cent of business rates and 35 per cent of income tax and national insurance. In the West Midlands, 33 per cent of council tax collected across the city region was generated in Birmingham, compared to 42 per cent of business rates and 45 of income tax and national insurance. This highlights the role of surrounding authorities as important locations where people live, even if they might work in the core authority.

 Source: Civil Aviation Authority, CLG, DEFRA, DWP, DECC, HMRC, Land Registry, ONS, NOMIS, Scottish Environment Protection Agency, Scottish Government Statistics and Stats Wales.
If the patterns of tax across the city region reflect to a large extent where people live and work, the data on spending begins to paint the picture of who lives where. Overall, core urban authorities account for higher levels of public spend, due to their higher populations – Birmingham and Manchester local authorities accounted for 39 per cent and 19 per cent respectively of total spend.
But there are other important differences to note too. For example, core urban authorities accounted for a higher share of benefit spend than other local authorities in the city-region, and outer local authorities accounted for a higher share of spend on pensions and old age support. Manchester accounted for 25 per cent of unemployment benefits and 26 per cent of housing benefits in Greater Manchester, despite accounting for only 19 per cent of the population in the city-region. In contrast it only accounted for 12 per cent of expenditure on old age. Only 7 per cent of the public money spent in Manchester was on old age, compared with 14 per cent in Stockport.
In the West Midlands, Birmingham (39 per cent of the city region population) accounted for 46 per cent of unemployment benefits and 45 per cent of housing benefits, but only 33 per cent of pensions spend. 20 per cent of public spend in Birmingham was on benefits, compared with 15 per cent in Solihull, but 16 per cent of spend in Solihull was on old age, compared with only 10 per cent in Birmingham.
The data illustrates a complex set of relationships and inter-dependencies between local authorities at city-region level: local authorities with high levels of business rates and income tax rely on surrounding areas for that tax to be generated, while also being reliant on the public service provision funded by surrounding areas – such as the GPs surgeries, schools and other services that people use near their homes.
All of this reinforces what we know about the need to devolve to the level of the real economy. Further devolution, especially of more significant budgets and elements of fiscal devolution, needs to happen at the scale of the city-region, the scale at which people their lives, work and consume public services. And if devolution – as it has been – remains conditional on effective cross-boundary working at combined authority level, then combined authorities must span the geography over which people live and work.

Leave a comment
Mark Thompson
I know turkies don’t vote for Christmas but why aren’t LAs being merged to achieve economies of scale across operational departments with fewer executive positions and more feet on the ground improving services to their customers (population)?