


02Cities, small businesses and ‘new work’
Where are ‘new work’ SMEs most likely to locate?
‘New work’ SMEs tend to locate in cities. Nearly 60 per cent of these SMEs are based in cities and on average, 40 per cent of SMEs in cities are ‘new work’ SMEs compared to 34 per cent in non-urban locations. Yet there is substantial variation between cities (Figure 3).
Figure 3: Proportion of ‘new work’ SMEs, 2014

Aberdeen, Reading, Cambridge, London and Oxford have the highest average concentrations of ‘new work’ SMEs. In these five cities, around half of SMEs are in either the professional, digital or creative industries. This compares to just one in five in cities such as Burnley, Doncaster and Grimsby.
There are more ‘new work’ SMEs in the UK’s largest cities, although this is to be expected given there are more SMEs overall (Figure 4). London accounts for 20 per cent of all SMEs but 29 per cent of those in ‘new work’ sectors.
Figure 4: Concentration and change in number of ‘new work’ SMEs (relative to national average), 2014 and 2008-14

‘New work’ SMEs are, however, under-represented in some of the UK’s largest cities outside the capital. Just four of the 10 Core Cities – Bristol, Cardiff, Leeds and Manchester – have a higher concentration of SMEs in these sectors than the national average. While Birmingham has a high number of ‘new work’ SMEs – 2.4 per cent of all ‘new work’ SMEs in the UK, the second highest share of any city outside London – it does well only because it has so many SMEs. If you look at the proportion of SMEs in ‘new work’ sectors in Birmingham, it is only 30 per cent, compared to an average of 34 per cent nationally. Sheffield has one of the lowest concentrations with just 29 per cent of its SMEs in these highly innovative, highly productive sectors.
‘New work’ SMEs tend to be more heavily concentrated in cities in the South, with the exceptions being Aberdeen, Edinburgh and Warrington. Coastal towns and cities outside the Greater South East tend to have fewer ‘new work’ SMEs relative to their total SME base. Brighton is the exception where 46 per cent of SMEs are ‘new work’ SMEs.
The geography of ‘new work’ SMEs in the UK is self-reinforcing. Cities with the highest proportion of ‘new work’ SMEs in 2008 continued to have the highest proportion in 2014, and cities which have seen an increase in one ‘new work’ sector tend to have seen an increase in other ‘new work’ sectors. For example, cities that have seen large increases in SMEs in either the digital or creative industries tend to have also seen large increases in SMEs in professional services. This implies two things: firstly that SMEs in these industries benefit from similar economic conditions, and secondly that they benefit from being in close proximity to firms in related industries (Box 4).
Box 4: Why do ‘new work’ SMEs benefit from clustering together?
There are two main types of spillovers that ‘new work’ SMEs benefit from when locating in the same city as other ‘new work’ SMEs.
- Intra-industry spillovers – the view developed by Marshall12 that the proximity of firms within a particular industry affects how well knowledge and ideas travel leading to higher levels of productivity and innovation within those industries. Companies operate more productively in sourcing inputs; accessing information, technology and institutions; coordinating with related companies; and measuring and motivating improvement.13 This view emphasises the importance of specialisation.
- Inter-industry spillovers – the view developed by Jacobs14 that firms benefit from proximity to firms in different industries. Diversity within a city economy encourages spillovers between individuals and companies with different perspectives leading to higher levels of productivity and innovation. SMEs also benefit from improved access to a labour pool with transferable skills. The potential for these spillovers increase with the size and diversity of a city’s economy.
‘New work’ SMEs benefit from proximity to other firms through shared inputs and infrastructure, labour pooling, and most importantly the exchange and diffusion of ideas driven by face-to-face interaction. The density offered by urban environments facilitates these spillovers by easing the flow of information, which supports innovation and boosts productivity. Workers in ‘new work’ sectors are more likely to move locally from firm to firm, share knowledge about products and create connections between firms.15 Proximity to clients is particularly important to businesses in these sectors as they provide highly specialised products and services which require a lot of client interaction to develop.
The gap between cities is also widening. Cities such as Aberdeen and Reading, with high proportions of ‘new work’ SMEs in 2008, have seen among the highest growth rates of SMEs in these industries. On the other hand, cities with smaller proportions of ‘new work’ SMEs, such as Bolton and Preston, saw a far smaller increase in these SMEs, and Blackpool saw a fall.
There are some exceptions, however, most notably in successful cities such as Cambridge, Aldershot, Warrington and Swindon (Figure 4). Despite above average proportions of ‘new work’ SMEs, these cities have not seen growth in these sectors since the recession. This could imply broader infrastructure constraints on growth in these cities, for example a lack of affordable housing, although this has not seemed to hamper Aberdeen, Oxford or Reading in the same way. These are issues that these cities may wish to investigate in more detail.
Case study 1: The Cambridge Cluster
How does the performance of ‘new work’ SMEs vary between cities?
‘New work’ SMEs are more likely to be growing (and taking on new employees) in cities with high concentrations of these firms. In Aberdeen, for example, the city with the highest concentration of ‘new work’ SMEs, there were more than two expanding ‘new work’ SMEs for every one that was contracting (2:1) between 2011 and 2014. Of the 64 largest UK cities, average employment created by expanding ‘new work’ SMEs was also highest in Aberdeen. In Blackpool and Grimsby by contrast, where there are far fewer ‘new work’ SMEs as a proportion of the cities’ total SME base, the ratio of expanding to contracting ‘new work’ SMEs was close to 1:1. And Belfast was the only city where more ‘new work’ SMEs contracted than expanded.
Leeds was one of the strongest performers among the big cities in terms of the average number of jobs created by expanding ‘new work’ SMEs between 2011 and 2014, with an average of nine jobs created. In London, expanding ‘new work’ SMEs increased their workforce by an average of seven employees. Given the scale of the capital, this means that one in three jobs created by existing ‘new work’ SMEs in the UK between 2011 and 2014 were in London. By contrast, Birmingham was one of the weakest performers with expanding ‘new work’ SMEs creating an average of five jobs between 2011 and 2014.
Do ‘new work’ SMEs have an impact on the wider city economy?
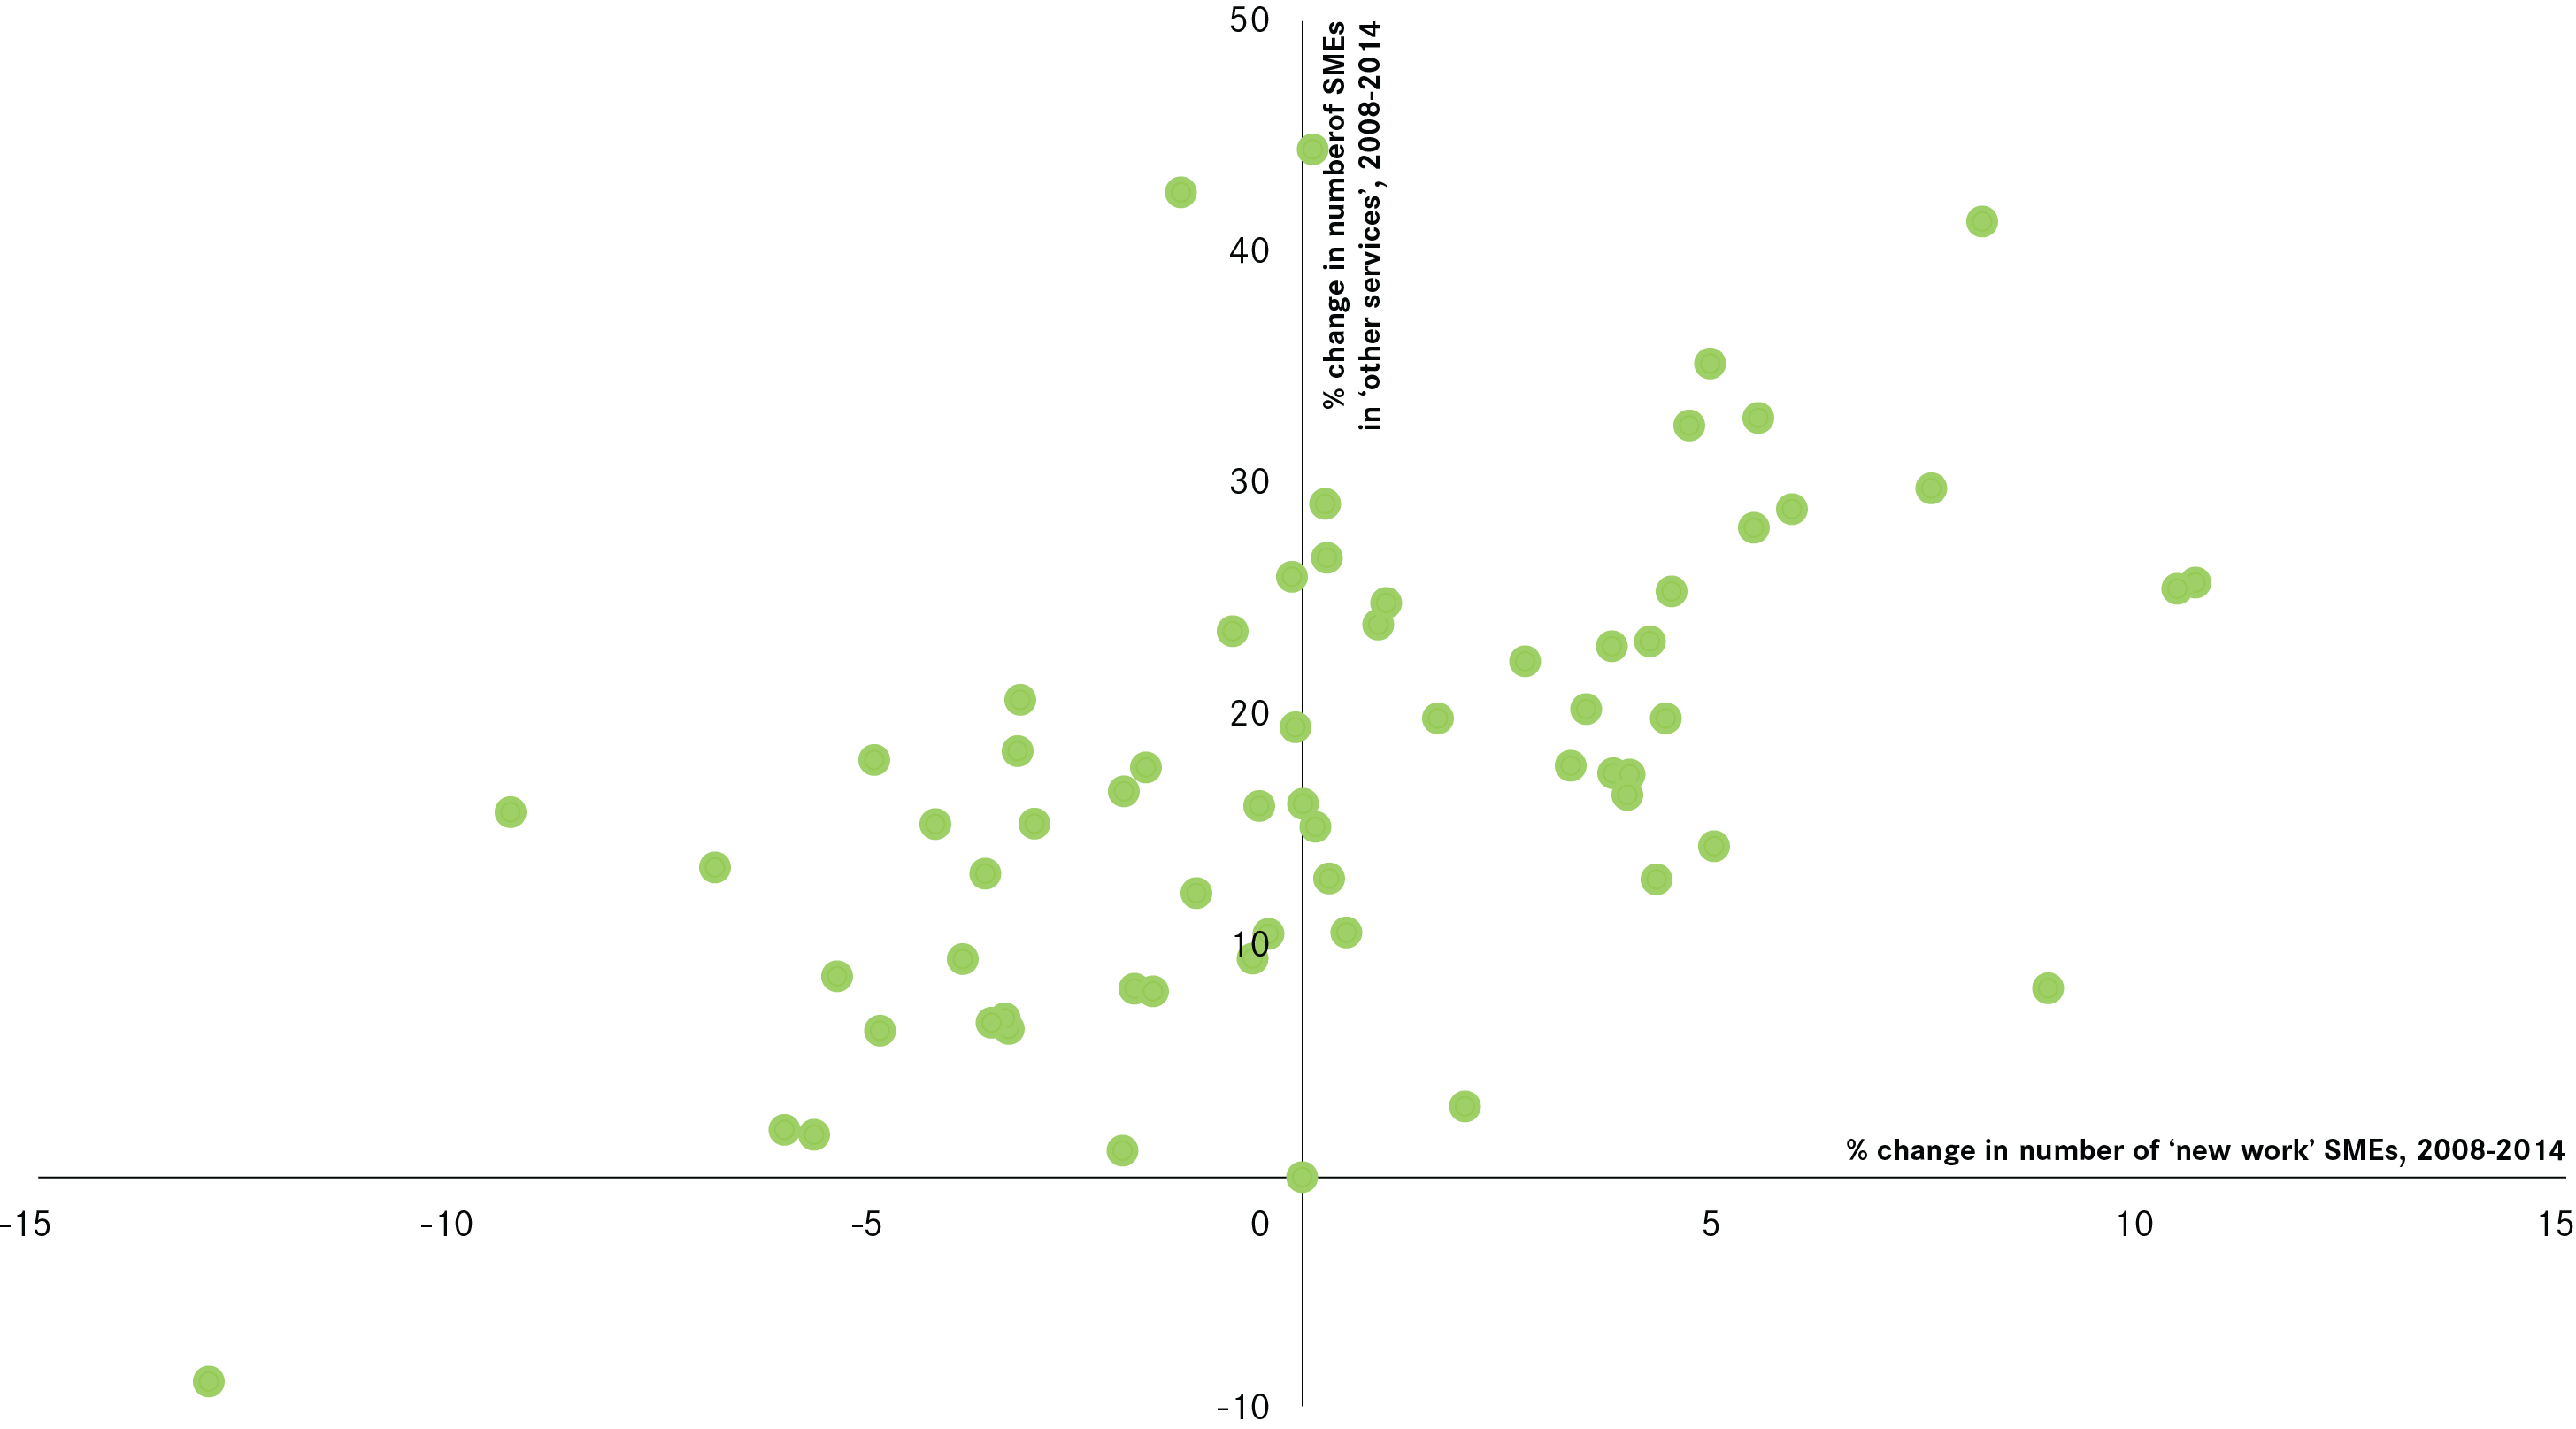
Cities which have seen an increase in the number of ‘new work’ SMEs tend to have seen an increase in SMEs in other service industries. Five of the cities ranking in the top 10 for the highest increases in ‘new work’ SMEs also rank in the top 10 for the highest growth in ‘other services’, while four of the 10 weakest performers were in the bottom 10 for both categories (Figure 5). Cities that have a high proportion of SME employment in digital industries or professional services tend to also have seen an increase in employment overall. This relationship is negative for cities with a high proportion of employment in construction, manufacturing and lower value services.
Figure 5: Change in the ‘new work’ SMEs and ‘other services’15 SMEs by city, 2008-2014
Cities’ growth is now based on their ability to create conditions that encourage knowledge to be created and shared. The importance of a wide base of SMEs has been highlighted as a critical factor in this process, reflecting the fact that knowledge-intensive economies benefit from relationships between firms of related but varied industries that look to reinvent and innovate.16
Cities which have strengths in these sectors not only benefit from the growth of these industries, but from improved productivity in other firms – in other words, having a successful neighbour increases a business’s productivity regardless of their industry.17 Moretti found that for every job created in US high tech industries, five jobs are created in other industries (two professional jobs and three in non-professional occupations).18This is much higher than the manufacturing sector where the multiplier is estimated to be 1.6. Lee also finds that an increase in firms in the creative industries boosts wages in other industries in UK urban areas, although he finds less employment impacts.19
These findings are further corroborated by the links between the performance of individual SMEs in different industries (Figure 6). The performance of individual SMEs is closely linked with their proximity to other SMEs in related industries. Cities which have a high proportion of SMEs that are expanding in the digital and creative industries tend to have more SMEs expanding in professional services, for example.
Figure 6: Relationship between performance of SMEs in different sectors
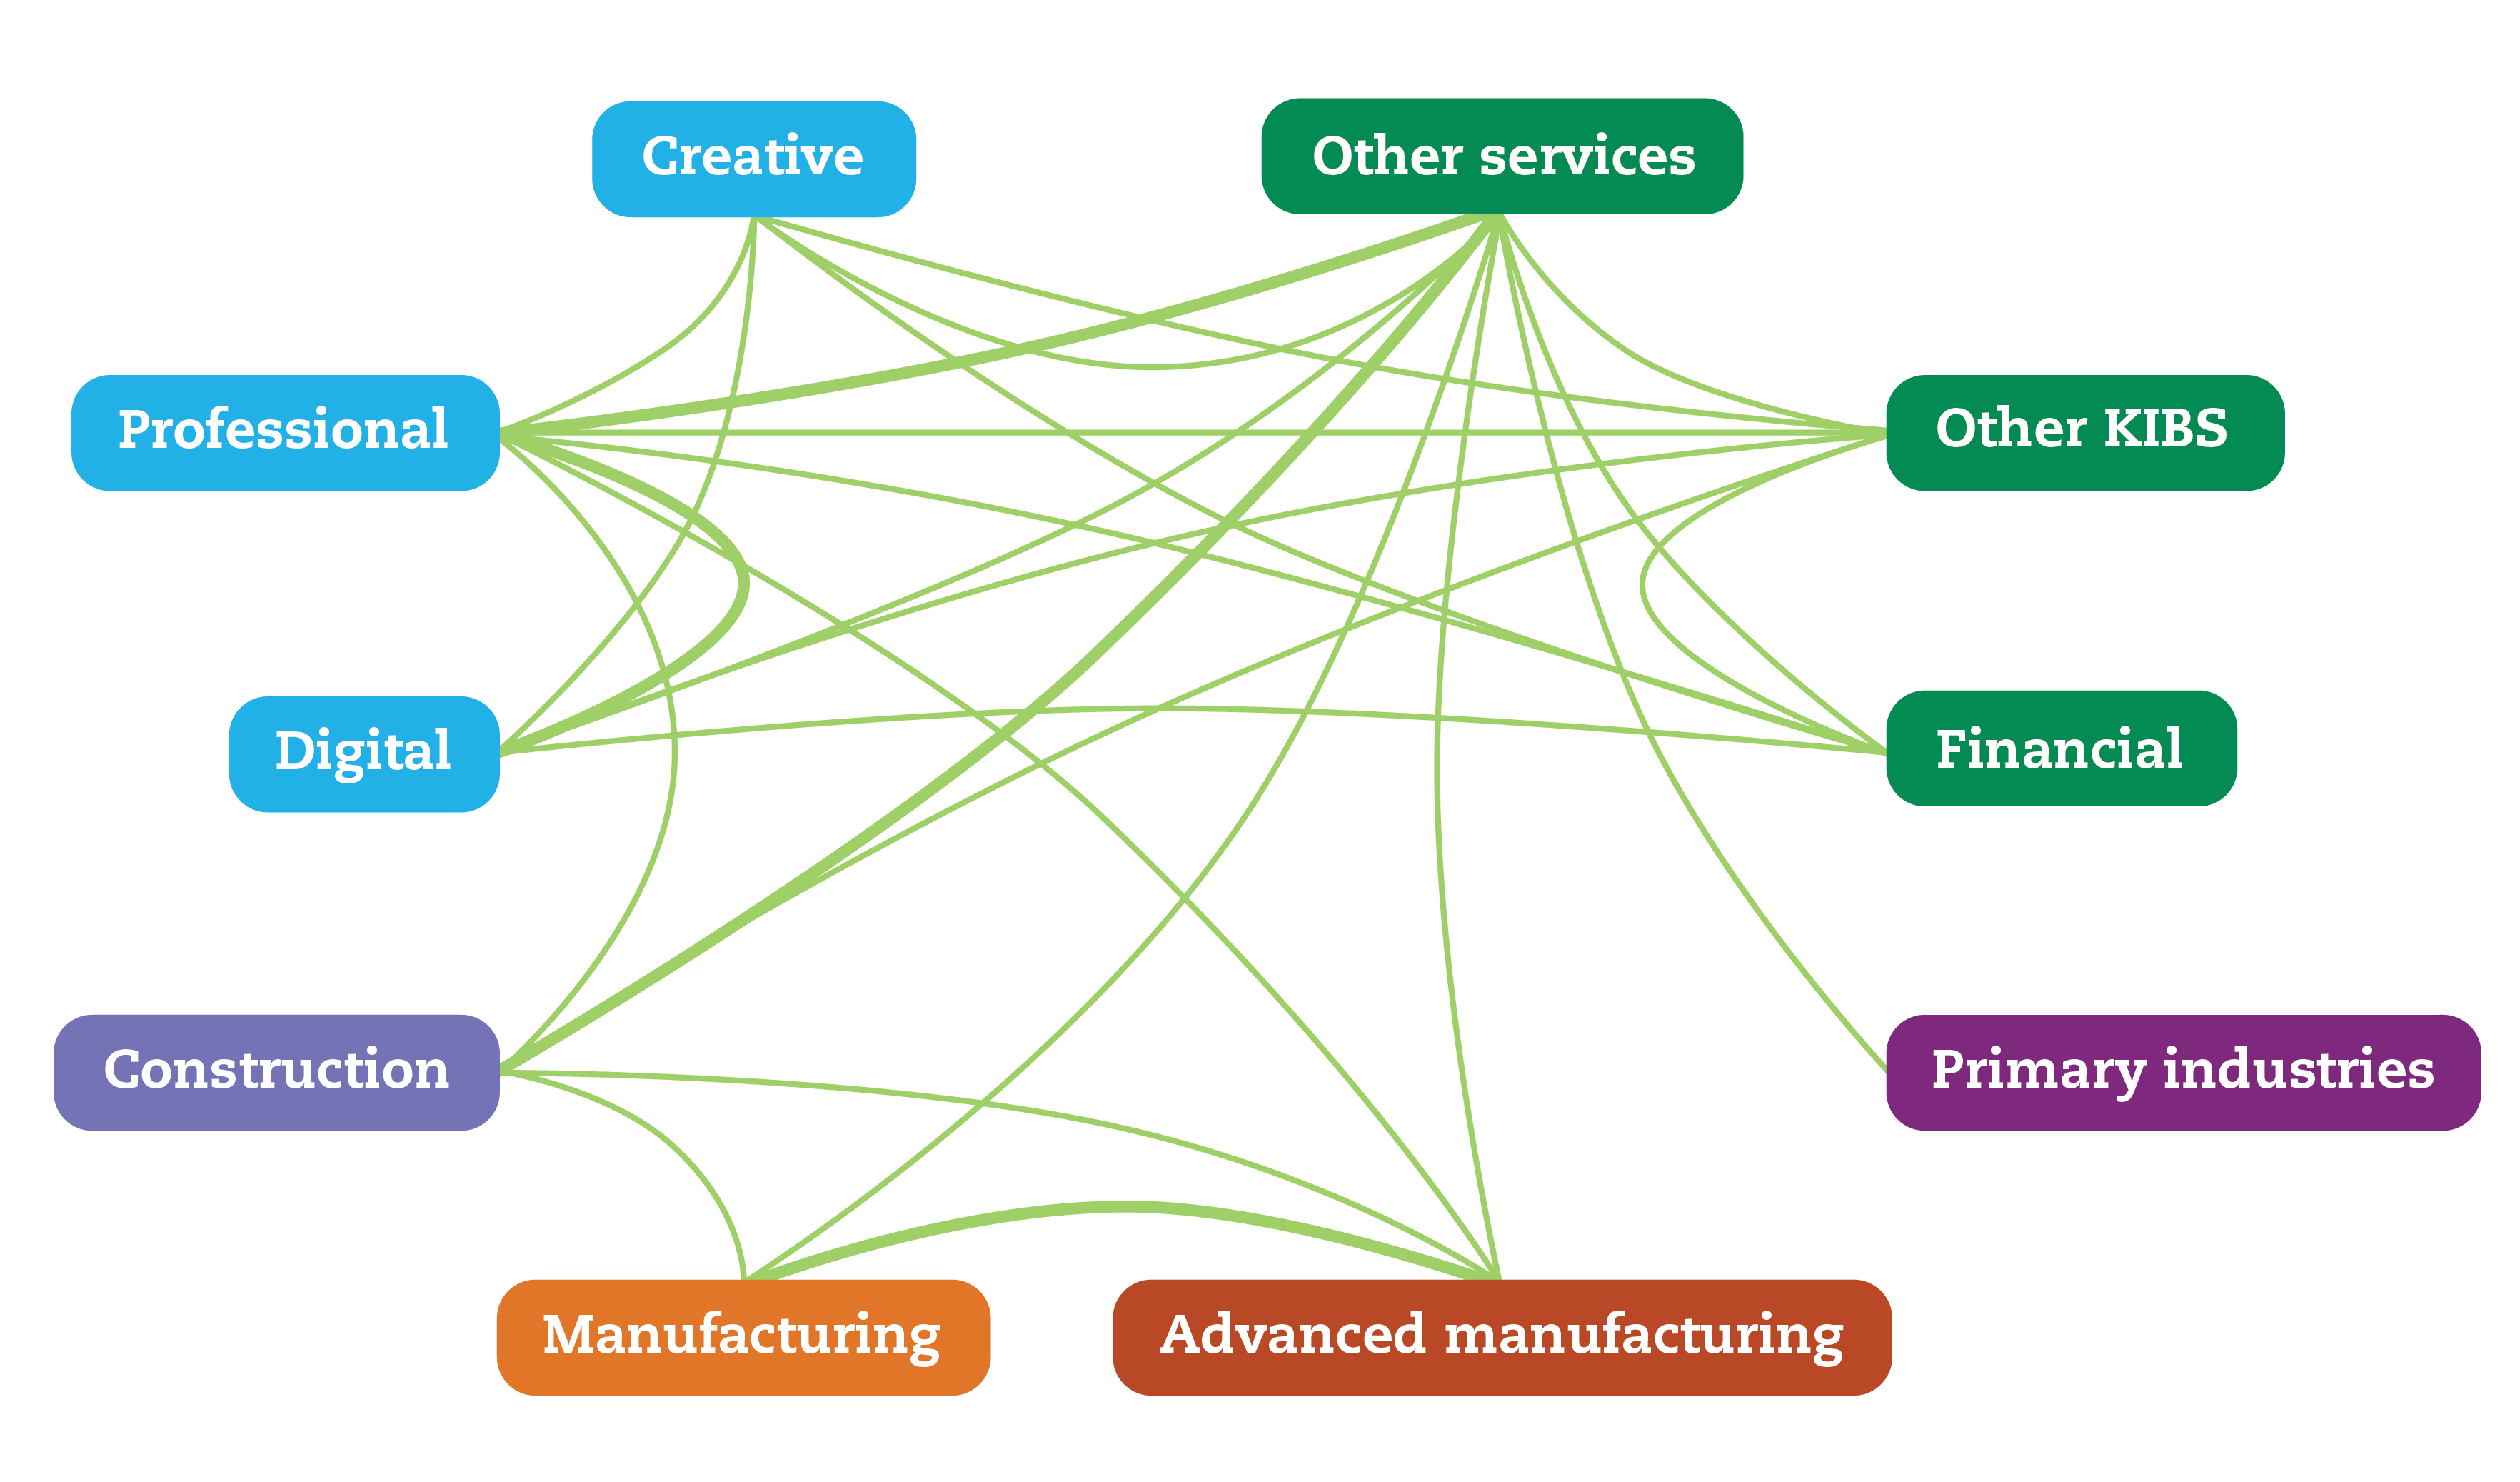
These inter-industry spillovers also operate over the wider city economy. SMEs in other industries, such as financial services, ‘other services’ and construction, also benefit from their proximity to these successful SMEs. Cities which have higher rates of expanding firms in the ‘new work’ industries tend to have higher rates of growing firms overall.
Cities with a high proportion of ‘new work’ SMEs tend to be more productive and highly innovative, as measured by GVA per worker and patents respectively (Table 1). They also tend to have high earnings, low unemployment and a high business density. These relationships are negative for cities with a high proportion of SMEs and employment in SMEs operating in the advanced manufacturing, other manufacturing, construction and lower value services.
Table 1: Relative economic performance of cities with high concentrations of ‘new work’ SMEs
Cities with high concentrations of ‘new work’ SMEs are more likely to have performed well over the longer term. Five of the top 10 cities with the highest proportion of ‘new work’ SMEs are in the top 10 for overall jobs growth in the last 10 years. Cities which have seen an increase in the number of ‘new work’ SMEs also saw high and increasing productivity and earnings over the same period.
Why are some cities more attractive to ‘new work’ SMEs than others?
A skilled labour pool, critical mass of related firms and the proximity to networks of clients and competitors were found to be key factors in recent studies evaluating the location decisions for ‘new work’ industry start-ups20 and clusters.21
Further work by City Initiatives for Technology, Innovation and Entrepreneurship (CITIE) assessed cities based on how they supported innovation and entrepreneurship.22 There were three key elements: the openness of the city to new ideas and new businesses; whether a city’s infrastructure is optimised for high-growth businesses; and whether the city builds innovation into its own activities.
Our research also shows that cities with a concentration in each of the ‘new work’ industries tended to share many of the same characteristics (Table 2).
Table 2: Characteristics of cities with high concentrations of SMEs in ‘new work’ industries
Highly skilled and innovative
Cities which have a concentration of ‘new work’ SMEs tend to have stronger skills profiles, with more graduates and fewer residents with no qualifications. For example Reading has the second highest proportion of ‘new work’ SMEs (53 per cent) and the seventh highest proportion of graduate residents (43 per cent), whereas Stoke has the fifth smallest share of ‘new work’ SMEs and the fourth highest proportion of residents with no formal qualifications.
For cities like Reading this is something of a virtuous cycle, businesses in ‘new work’ sectors locate where there are large pools of talent to hire from, then these businesses attract further graduates to the city. Firms in digital and financial industries, for example, reported that their location decisions were primarily based on the availability of skilled staff.23 Highly skilled workers are attracted not only to job opportunities on offer, but the career ladders available by having a thick market of related firms.24
Similarly, cities with a higher proportion of ‘new work’ SMEs such as creative firms are also likely to have high-quality universities.25 This might be influenced by London’s large higher education and creative sectors, but is also reflected in a tendency of SMEs in these industries to work closely with universities.26
Global in outlook
‘New work’ SMEs are more likely to operate in international markets, rather than rely on local markets. For example, 32 per cent of SMEs in Cambridge trade internationally and 51 per cent of SMEs in the city are in ‘new work’ sectors, whereas 54 per cent of SMEs in Grimsby rely on local markets and only 22 per cent of SMEs in the city are in the ‘new work’ sectors. SMEs that trade internationally tend to increase their productivity and the productivity of a city.27 This is evident in the relationships at city level between concentrations of ‘new work’ SMEs, international trade and productivity.
Such SMEs not only benefit from broader market opportunities, they are also more likely to pursue other growth-related strategies, investing in innovation and workforce development for example.28 Cities’ connectivity is due to functional linkages of firms rather than geography alone, therefore the industries and practices of a city’s firms is crucial to their global outlook.29
Digitally connected
Cities with a high proportion of SMEs in the digital sector tend to have wide coverage of superfast broadband. For example, 86 per cent of postcodes in Brighton have access to Super-Fast Broadband and 12 per cent of SMEs are in the digital sector whereas just 57 per cent of postcodes in Barnsley have this digital connectivity and just 5.1 per cent of SMEs are in the digital sectors. The digital sector is the only sector in which there is a clear relationship and reflects the importance of this infrastructure to these businesses. Tech City UK’s recent survey of digital firms also found that digital firms consider access to broadband as a key factor for location decisions.30
The What Works Centre for Local Economic Growth reviewed the impact of broadband investment31 and found the impacts on productivity and employment can be positive for SMEs – especially in cities – and for specific industries, including the digital sector.
City centres accommodating of sole traders and small businesses
Our research finds that ‘new work’ SMEs, and particularly creative industries, tend to be in cities with relatively more jobs in the city centre (as opposed to other areas of the city). This may be linked to the location preferences identified for the creative industries32 or possibly the impact the sector has on the attractiveness of city centre locations to other businesses. This would suggest that strong city centres are important firstly to encourage ideas exchange and secondly for a city economy to benefit from the spillovers that result from this activity.33
Tech City’s survey found that firms in six ‘digital clusters’ identified access to social networks as the key bexnefit of their location. Our research shows that four of these six cities have concentrations of digital firms in the top 10, suggesting that network benefits are greatest where there is a higher density of firms in these ‘new work’ industries.
Many businesses operating in the creative and digital industries are sole traders or employ a small number of staff. Qualitative research for this paper revealed that ‘new work’ SMEs often prefer smaller, more flexible premises, which may be more prevalent in city centres.34 Increasingly flexible work places such as Duke Studios in Leeds or the Engine Shed in Bristol are allowing for co-location, lower overheads and the capacity for businesses to grow quickly.
Case study 2: Bristol – creative and digital
Case study 3: Reinventing Leeds
Policy implications
Shifts in the nature of the UK and global economy over the last three decades, which have been reinforced by the recession and through the recovery, have created an inherently uneven economic map with ‘new work’ SMEs concentrating predominantly in cities in the South.
Cities, with high concentrations of ‘new work’ SMEs, must ensure that they are able to maintain and grow their highly innovative SME base by being open to new residents and businesses. This means providing new housing and services to keep pace with demand35 as well as managing some of the other consequences of growth such as rising congestion. It also means ensuring that the supply of skills keeps pace with demand. The UK Commission for Employment and Skills (UKCES) identified for example that digital and creative firms have reported persistent skills shortages for highly qualified professional staff.36
Cities with a lower concentration of ‘new work’ SMEs should not seek to replicate Cambridge’s ‘Silicon Fen’ or London’s ‘Tech City’. Successful clusters grow organically through the decisions of firms and individuals and the interactions between them rather than as a result of government policy interventions.37 Similarly the role of the creative industries in regenerating city centres needs to be seen in the context of broader local conditions rather than publicly funded ‘creative quarters’. Cities should instead focus on the broader characteristics of these types of firms and what influences their location decisions – and respond accordingly. As Glaeser puts it, “most creative people like what most well-off people like – namely affordable and good quality housing, schools and transport”.38
All cities should seek to support growth among SMEs in highly skilled, innovative sectors by ensuring that:
- SMEs are able to access skills and knowledge – Cities can improve the skills levels of their labour force by better matching their skills provision with business needs. For example, Sheffield, Leeds and Manchester have used their city deals to develop tailored local skills policies to match the delivery of skills with local business demands in these core cities.39 Cities can also encourage knowledge exchange between ‘new work’ SMEs and universities by targeting specific barriers to collaborations between partners.40
- SMEs have access to high performing digital infrastructure – Cities can lobby providers and attempt to encourage more competition between them by making them aware of the market opportunities. They can also work with businesses to encourage the uptake of broadband. DCMS’ SuperConnected Cities Programme provides vouchers to SMEs in partner cities to cover connection costs for superfast broadband, cities could usefully support this project by offering targeted business support.
- SMEs are supported to trade internationally – National schemes such as the UK Trade and Investment’s (UKTI) Centres of Excellence41 for creative, digital and other industries aim to open these markets to UK businesses in specific cities with strengths in specific industries. Cities can work with UKTI where appropriate to maximize the impact of these interventions. It is also important for cities to emphasise and value diversity in the economy by supporting firms across different industries to trade and encouraging international inward investment, opening the city to more knowledge sources.
- Provide suitable premises for sole traders and expanding small businesses – policymakers can respond to the needs of ‘new work’ SMEs in the type of office space they plan for and provide. While many of the most successful examples of these incubators and hubs are co-founded or led by private sector industry leaders and entrepreneurs,42 local authorities can support these with funding or softer measures through planning and sharing information.
Central government should support cities to address the challenges faced by local SMEs by ensuring that meaningful deals are signed with the largest cities. Cities need more powers to be able to respond to the needs of SMEs. As this report has set out, different cities have very different industrial make-ups and priorities. The UK is however highly centralised, therefore cities – even those with relatively more powers such as London and Manchester – are typically limited in their abilities to innovate, raise or spend funds in a tailored way to meet local conditions. This is now changing, and against the backdrop of the Northern Powerhouse and the city devolution deals some of the UK’s largest cities are negotiating greater powers and responsibilities for economic development roles that affect their areas.