


03Data Monitor: Small Business Performance
Overview
There is significant variation in the performance of SMEs across UK cities. This matters because SMEs are critical generators of jobs and output, impacting on the performance of individual cities and the national economy as a whole.
This section takes a detailed look at SME performance across UK cities:43
- SME density
- Business starts
- SME expansion
- High-growth firms
- SME contraction
- SME closures
- ‘New work’ industries
SME Density
SME density (number of SMEs per 10,000 population) provides a useful indicator of a city’s economic success. Cities with a high SME density are usually strong economic performers: out of the top 10 cities for SME density, seven had the highest rate of productivity (GVA per worker in 2013).
- SME density is increasing at a higher rate in cities than elsewhere: SME density increased by 9.5 per cent in cities between 2011 and 2014, compared to just 6 per cent nationally.
- Medium-sized cities in the South East tend to have the highest SME density: with the exception of London and Bristol, no large city ranked in the top 10 for SME density and seven of the top 10 cities are located in the South East.
- London had the highest SME density in 2014 with 437 SMEs per 10,000 residents. This is 33 per cent higher than the national average, and 2.8 times higher than Sunderland, the city with the lowest SME density.
- Aberdeen saw the highest increase in SME density between 2011 and 2014, followed by Northampton, London, Middlesbrough and Swindon. In addition to experiencing the greatest increases in density, Aberdeen and London ranked in the top 10 cities for SME density, both in 2011 and 2014.
- Only three cities – Belfast, Mansfield and Blackpool – experienced a decrease in SME density. While Mansfield also had one of the lowest concentrations of SMEs in 2011, Belfast and Blackpool had an average proportion of SMEs per 10,000 inhabitants (ranking 31st and 19th respectively).
Variation by size
- Almost 90 per cent of city SMEs in 2014 were micro firms (0-9 employees), 8.9 per cent were small firms (10 to 49 employees) and 1.5 per cent were medium-sized (50 to 249 employees). Between 2011 and 2014 the number of small firms increased by 14.2 per cent, medium-sized firms by 12.2 per cent and the number of micro firms by 8 per cent.
- Southend had the highest proportion of micro firms (92 per cent), while Aberdeen had the highest proportion of medium-sized firms (2.9 per cent).
Figure 7: SME Density, 2014

Business starts
New businesses are not only a signal of economic dynamism, but they can also be an important source of job creation.
- New businesses were more likely to start in cities than elsewhere: in 2013 there were on average 60 business starts per 10,000 population in cities compared with the national average of 54.
- Among the top 10 cities for business starts, seven are located in the Greater South East.
- The rate of business starts in London was 1.4 times greater than in Milton Keynes, the second highest city for business starts, and 1.8 times more than in the whole country.
- All of the UK’s 64 largest cities had a higher number of business starts in 2013 than in 2011. The number of business starts in cities increased by 35.3 per cent, slightly higher than the national average of 30.9 per cent.
- Northampton experienced the highest growth in business starts between 2011 and 2013, with a 67 per cent increase over this period. The city went from ranking 10th to third highest in terms of business starts per 10,000 population.
- Although London had the highest rate of business starts, the rate grew less than the city average (31.8 per cent in the capital compared to 35.3 per cent in cities) between 2011 and 2013, but more than the national average (30.9 per cent).
- Among the 10 cities with the lowest start-up rates, three of them – Sunderland, Dundee and Mansfield – still experienced some of the highest increases over the past three years (57.4, 52.7 and 47.7 per cent respectively).
Figure 8: Business starts per 10,000 population, 2013

SME Expansion
SMEs account for 60 per cent of employment in the country. Between 2011 and 2014, SMEs generated 2.1 million new jobs, with a net job growth of 1.1 million. More than half of these new jobs were located in the 64 largest cities in the country.
Overview
- SMEs in cities were more likely to expand than elsewhere: between 2011 and 2014, 30.5 per cent of city-based SMEs expanded (i.e. increased the size of their workforce), compared to 27.4 per cent of SMEs based in non-urban locations.
- Hull had the highest percentage of SMEs expanding between 2011 and 2014, 35.5 per cent of SMEs increased the size of their workforce. In comparison, 21.9 per cent of SMEs in Belfast expanded over the same period. However, expanding SMEs in Hull were not high job creators: Hull SMEs ranked 41st in terms of total jobs created between 2011 and 2014.
- Among expanding SMEs, those located in cities tended to generate more jobs – 6 jobs per expanding firm. Expanding SMEs based outside of the 64 largest cities only created 4.6 jobs each. Both these figures are slightly higher than in 2008-11, when each expanding SME created 5.6 jobs in cities and 4.2 jobs elsewhere.
- Expanding SMEs in Ipswich created the largest number of jobs (13.2 jobs per expanding SME between 2011 and 2014), three and a half times more than expanding SMEs in Hastings (3.7 jobs per expanding SME).
- Between 2008-11 and 2011-14, the proportion of expanding SMEs increased from 26.1 per cent to 28.9 per cent and from 27.2 per cent to 30.5 per cent in cities alone. Every city except Belfast had a higher proportion of expanding SMEs in 2011-14 than it had in 2008-11. In Sunderland, the share of expanding SMEs increased from 27.1 to 34.3 per cent making it the largest change among the 64 cities.
Figure 9: Average number of jobs created, 2011-2014

Variation by sector and size
- Micro businesses (0-9 employees) accounted for almost 88 per cent of the urban SME population and created 52 per cent of new SME jobs in the UK. In Ipswich, micro businesses created 80.3 per cent of all new SME jobs between 2011 and 2014, while at the other end of the range, micro businesses based in Peterborough only contributed to 34.7 per cent of SME job creation.
- Small businesses (10-49 employees) represented 10.2 per cent of the SME population in cities in 2014 and created 28 per cent of SME jobs between 2011 and 2014. Among these, 40.3 per cent expanded between 2011 and 2014 (similar to the UK wide figure of 39.3 per cent). Aberdeen had the highest proportion of expanding small businesses (46.5 per cent) whereas Dundee had the lowest (30.7 per cent).
- Medium-sized businesses (50-249 employees) accounted for just 2 per cent of the urban SME population, but 46.2 per cent of these expanded over the last three years. Each expanding medium-sized SME created about 43 jobs on average in cities.
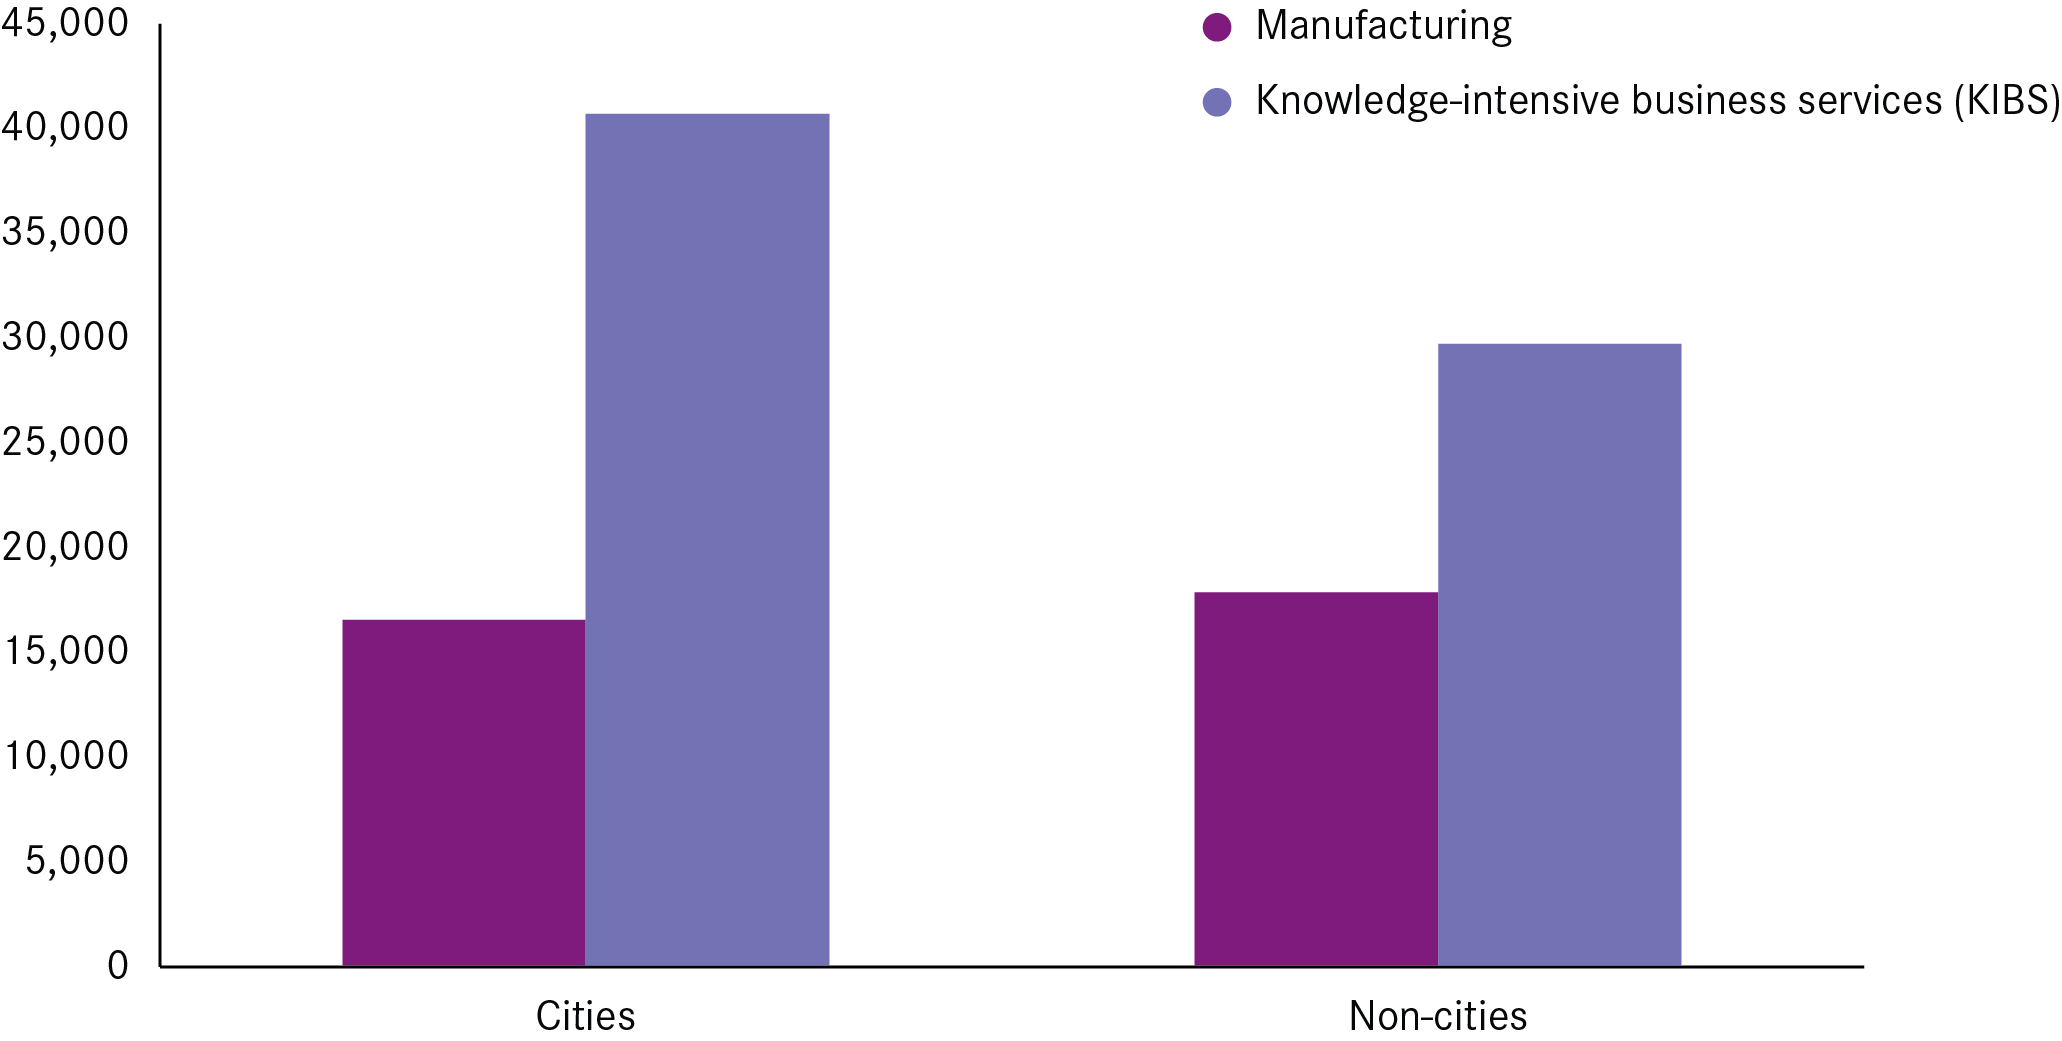
- There are a similar number of expanding manufacturing SMEs in cities and non-cities, but there are many more expanding knowledge-intensive business services (KIBS) SMEs in cities. Expanding SMEs in cities were more likely to be in KIBS sectors than in manufacturing sectors: 20.3 per cent of expanding SMEs were in KIBS, and 8.3 per cent were in manufacturing. Whilst for the UK as a whole, KIBS firms represented 14.3 per cent of expanding SMEs, and manufacturing firms 8.6 per cent.
Figure 10: Expanding SMEs by location and sector, 2011-2014
- There was however significant variation between cities. In Edinburgh, there were more than seven times as many expanding firms in KIBS sectors as in manufacturing. Conversely in Hull, the number of expanding manufacturing firms was 1.7 times higher than KIBS firms.
- The average expanding KIBS SME created fewer jobs than a manufacturing SME. Over the 2011-14 period, each expanding SME operating in KIBS created on average 6.6 jobs in cities, while manufacturing firms created 6.9 jobs.
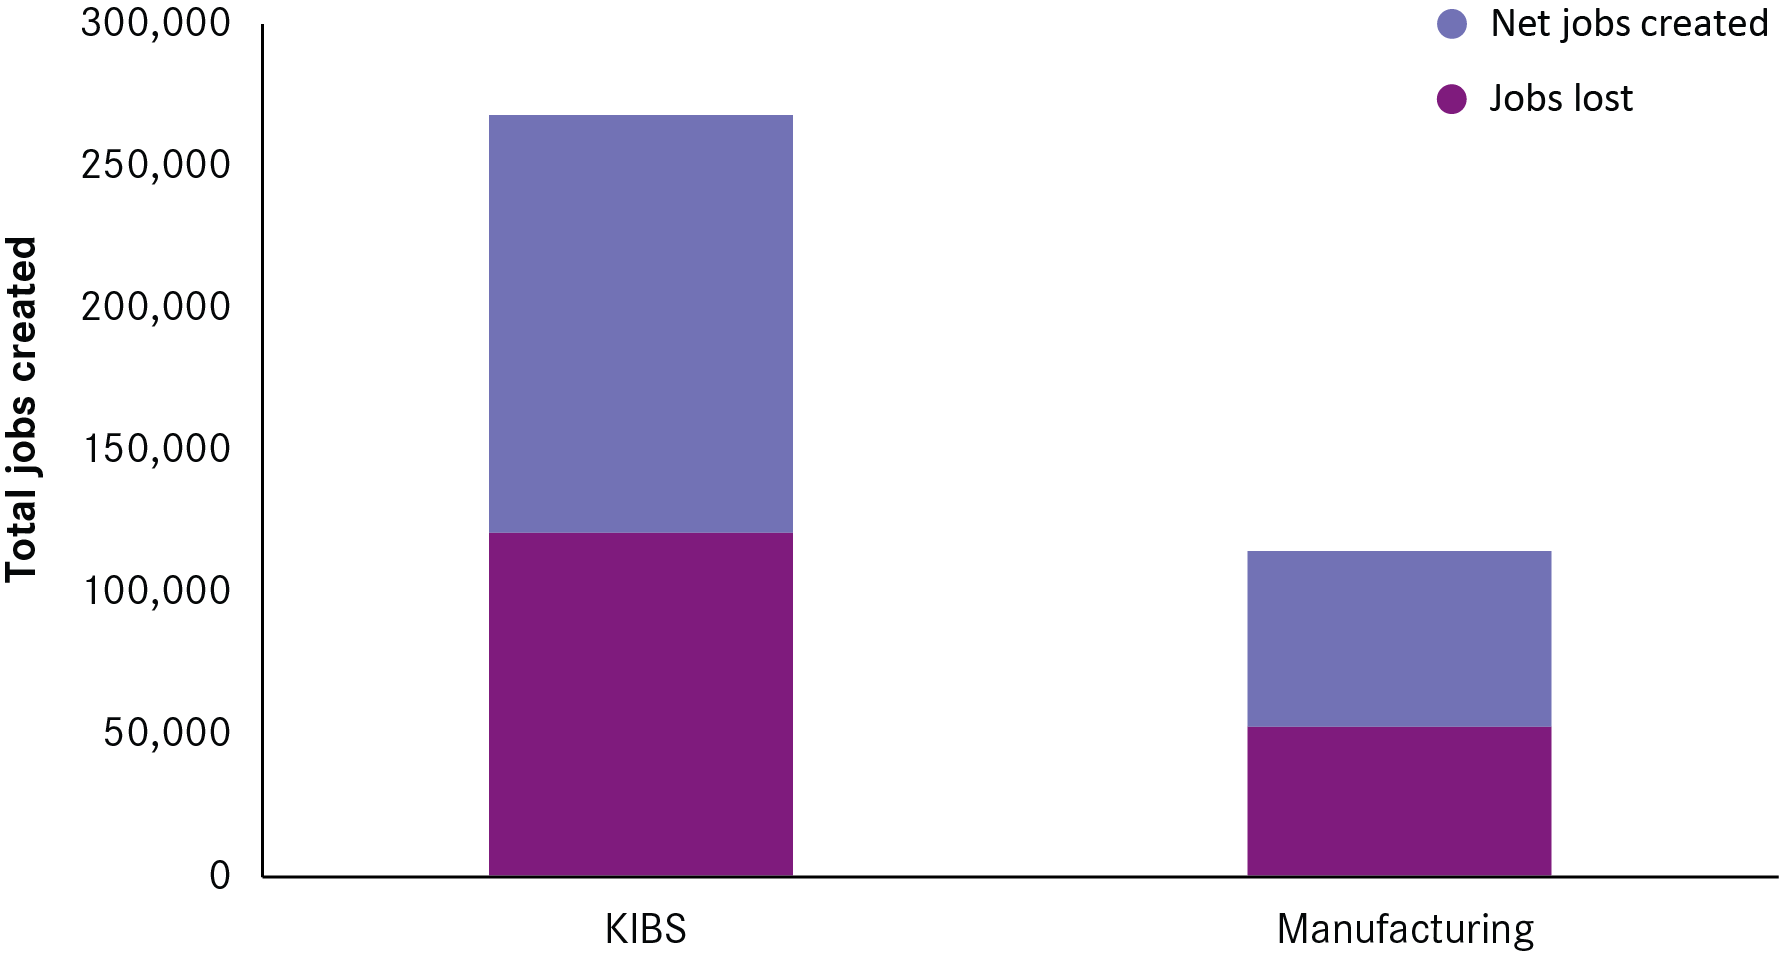
- However, taking job losses into account, KIBS firms created almost twice as many net jobs in the UK as manufacturing firms, and 2.3 more net jobs in cities.
- Expanding manufacturing firms created about the same proportion of jobs in cities than they did outside of cities (6.9 jobs compared with 6.2 jobs outside cities), but expanding KIBS firms added far more jobs in cities than outside of cities (6.2 jobs in cities compared with 4.5 jobs outside of cities).
Figure 11: Net SME jobs created in cities by industry, 2011-2014
High-growth SMEs
High-growth SMEs are more likely to be located in cities.44 Between 2011 and 2014, six out of 10 high-growth SMEs (firms with more than 10 employees expanding their workforce by more than 50 per cent) were located in cities. Among urban SMEs with more than 10 employees, 11.8 per cent expanded the size of their workforce by more than half between 2011 and 2014. Whereas outside of the 64 largest cities, just 9.8 per cent of SMEs experienced such high growth.
Overview
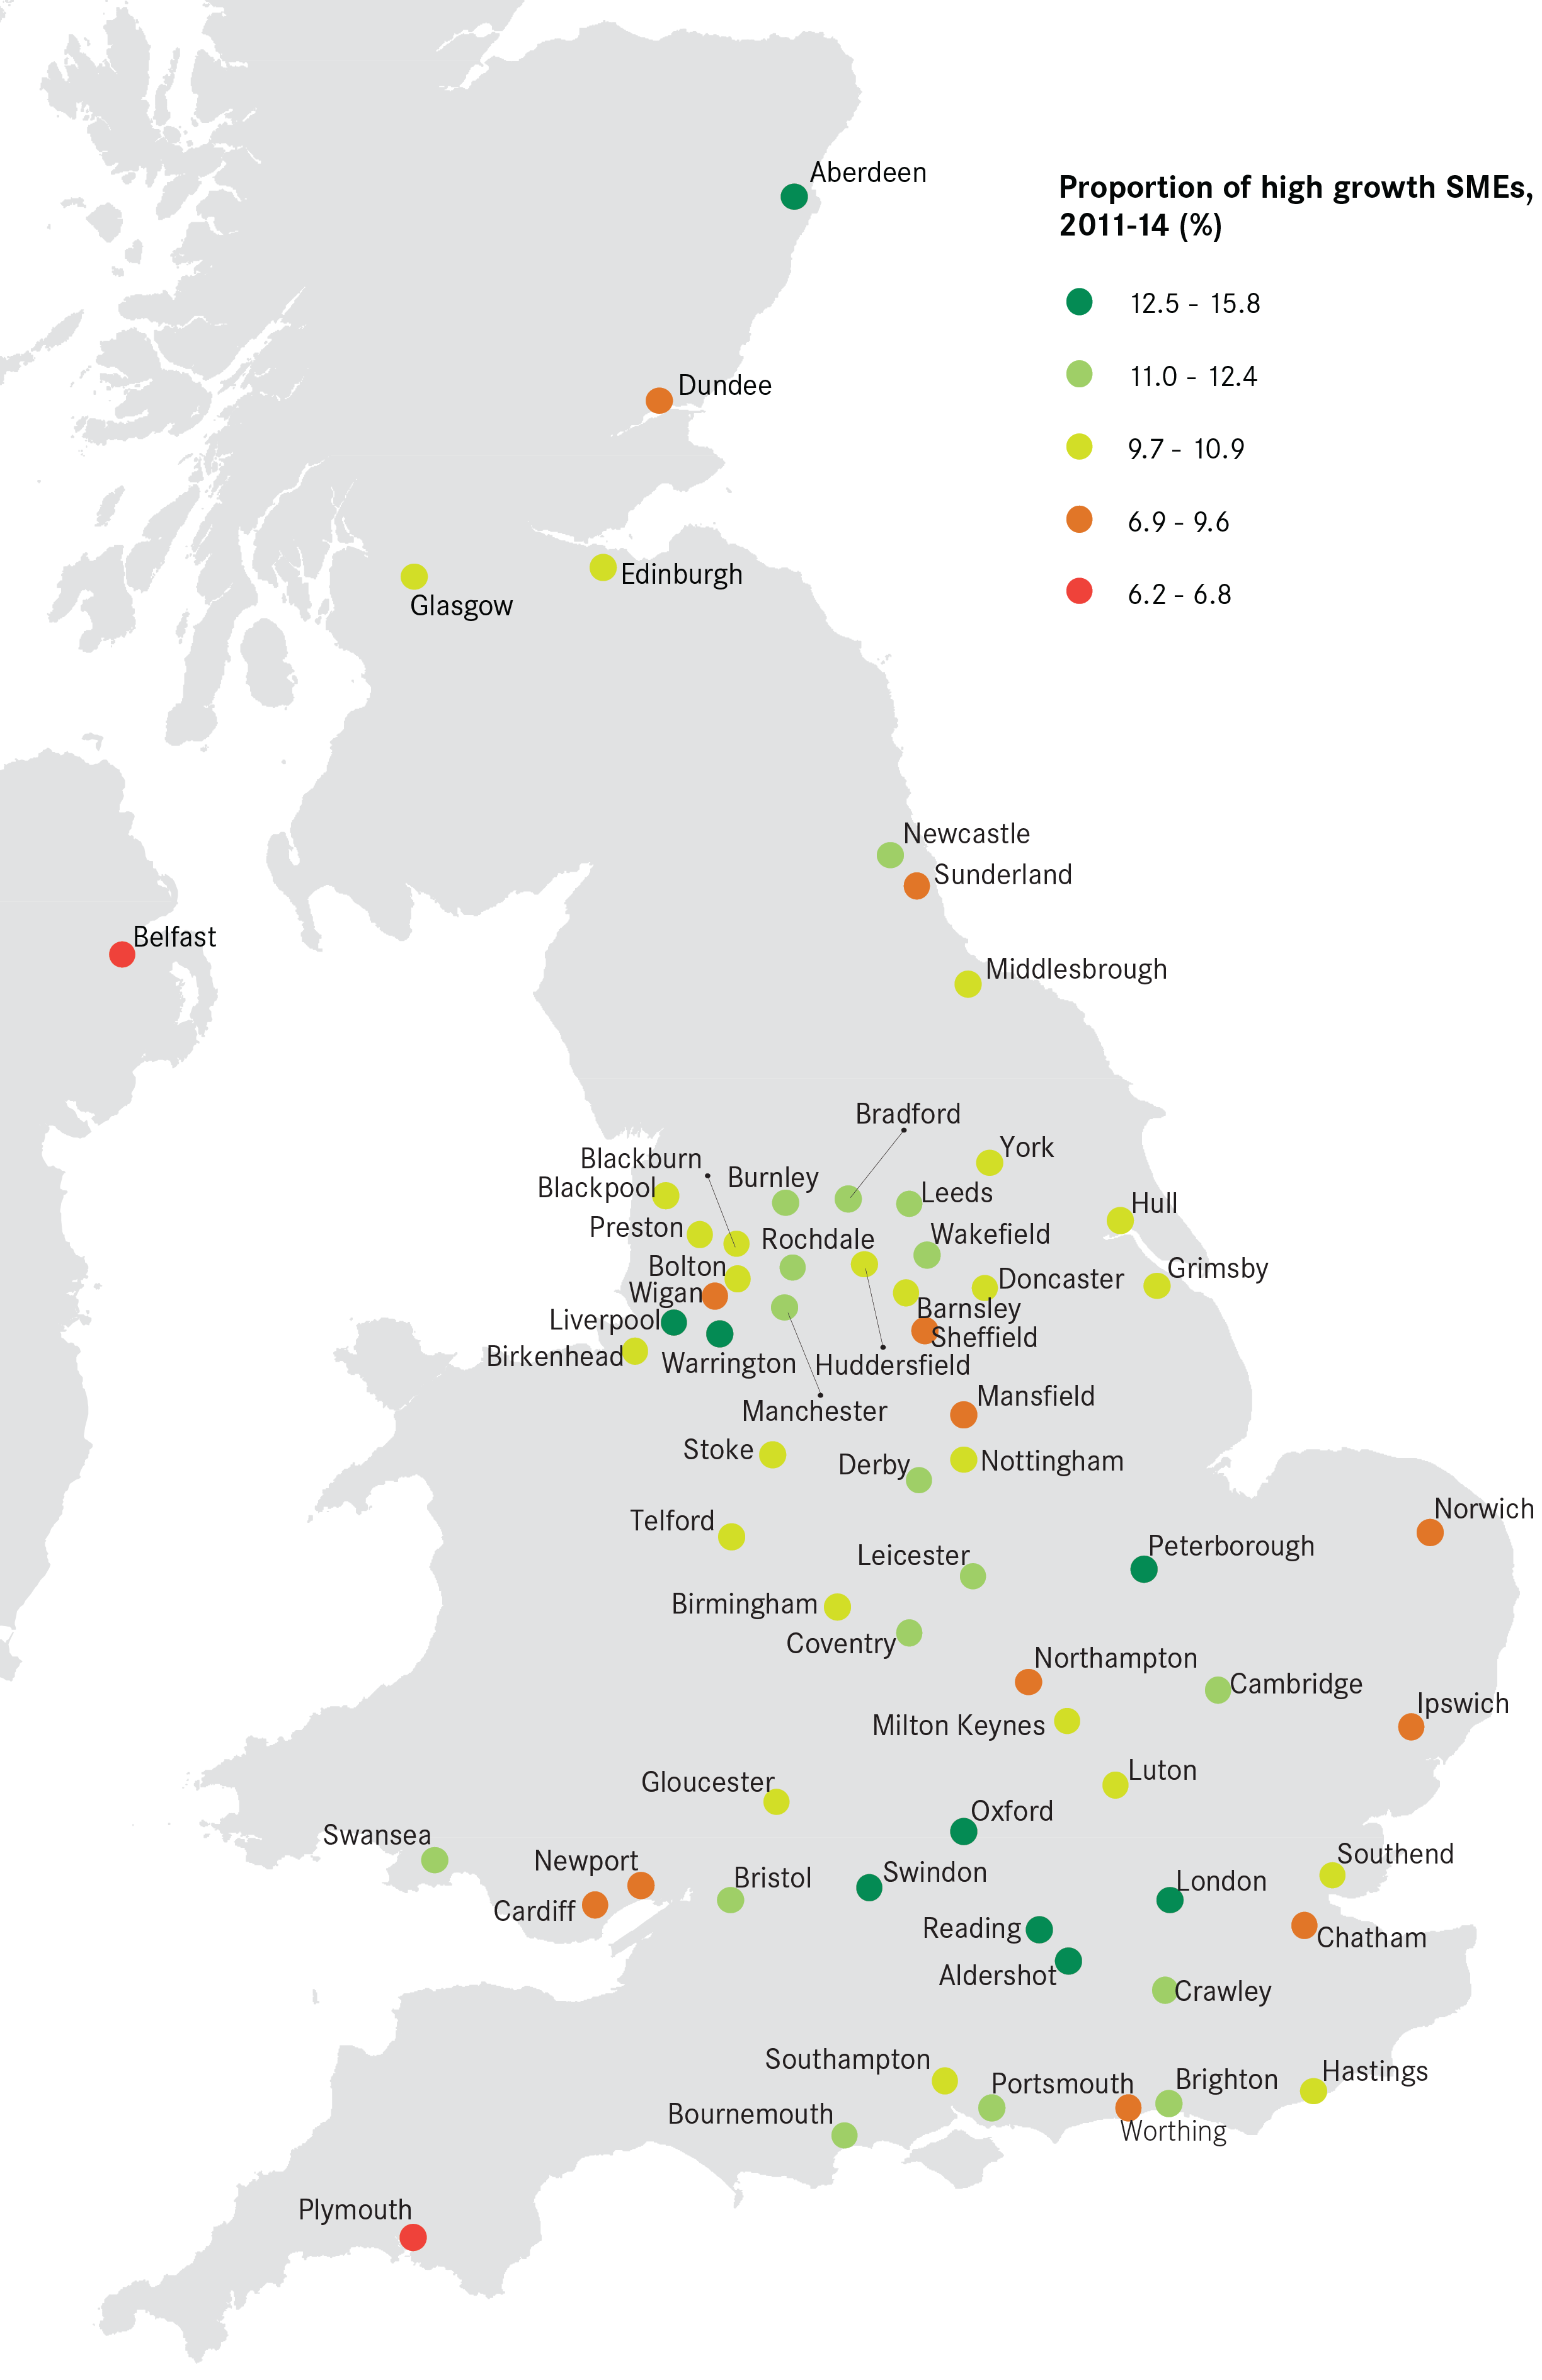
- Warrington had the highest proportion (15.8 per cent) of high-growth firms between 2011 and 2014, followed by Reading (14 per cent) and Swindon (13.8 per cent).
- In contrast, Belfast had the lowest proportion of high-growth SMEs, followed by Plymouth and Ipswich (6.2, 6.8 and 8.1 per cent respectively).
- London however had by far the largest number of high-growth SMEs, with a share of 39.5 per cent of high-growth firms located there. Birmingham, the second highest share, had almost seven times fewer high-growth firms than London.
- 57 out of 64 cities had a higher proportion of high-growth SMEs between 2011-14 than between 2008-11. Warrington, Hastings and Blackpool saw the largest increases in their proportion of high-growth SMEs (6.9, 5.4 and 5.2 percentage points growth respectively), while Oxford, Belfast and Aberdeen experienced the highest falls (-1.8, -1.8 and -1.1 percentage points fall respectively). Despite this relative fall, Oxford and Aberdeen both still rank in the top 10 cities with the highest proportion of high-growth SMEs.
Variation by sector
- KIBS firms were more likely to be high-growth than manufacturing firms: in cities, about 13 per cent of KIBS firms were high-growth (12.1 per cent nationwide), while 9.5 per cent of manufacturing firms increased their workforce by more than 50 per cent (9.1 per cent nationwide). High-growth KIBS represented a fifth of the total number of high-growth firms overall, significantly higher than manufacturing firms (12 per cent).
- The average high-growth KIBS firm created 51 jobs in cities, compared to 37 jobs created by high-growth manufacturing firms.
Figure 12: Proportion of high growth SMEs, 2011-14
SME Contraction
About 20 per cent of the UK’s SMEs reduced the size of their workforce between 2011 and 2014, a similar rate to 2008-2011 (when 19 per cent contracted). Although this is less than the number of SMEs expanding (28.8 per cent), SME contraction still resulted in almost one million job losses between 2011 and 2014.
Overview
- Almost 20 per cent of city-based SMEs reduced the size of their workforce between 2011 and 2014, in line with national and non-city averages (19.7 and 19.4 per cent respectively)
- Among the 64 largest cities, Belfast had the highest percentage of contracting SMEs (24.4 per cent), followed by Hull (23.4 per cent) and Blackpool (22.6 per cent)
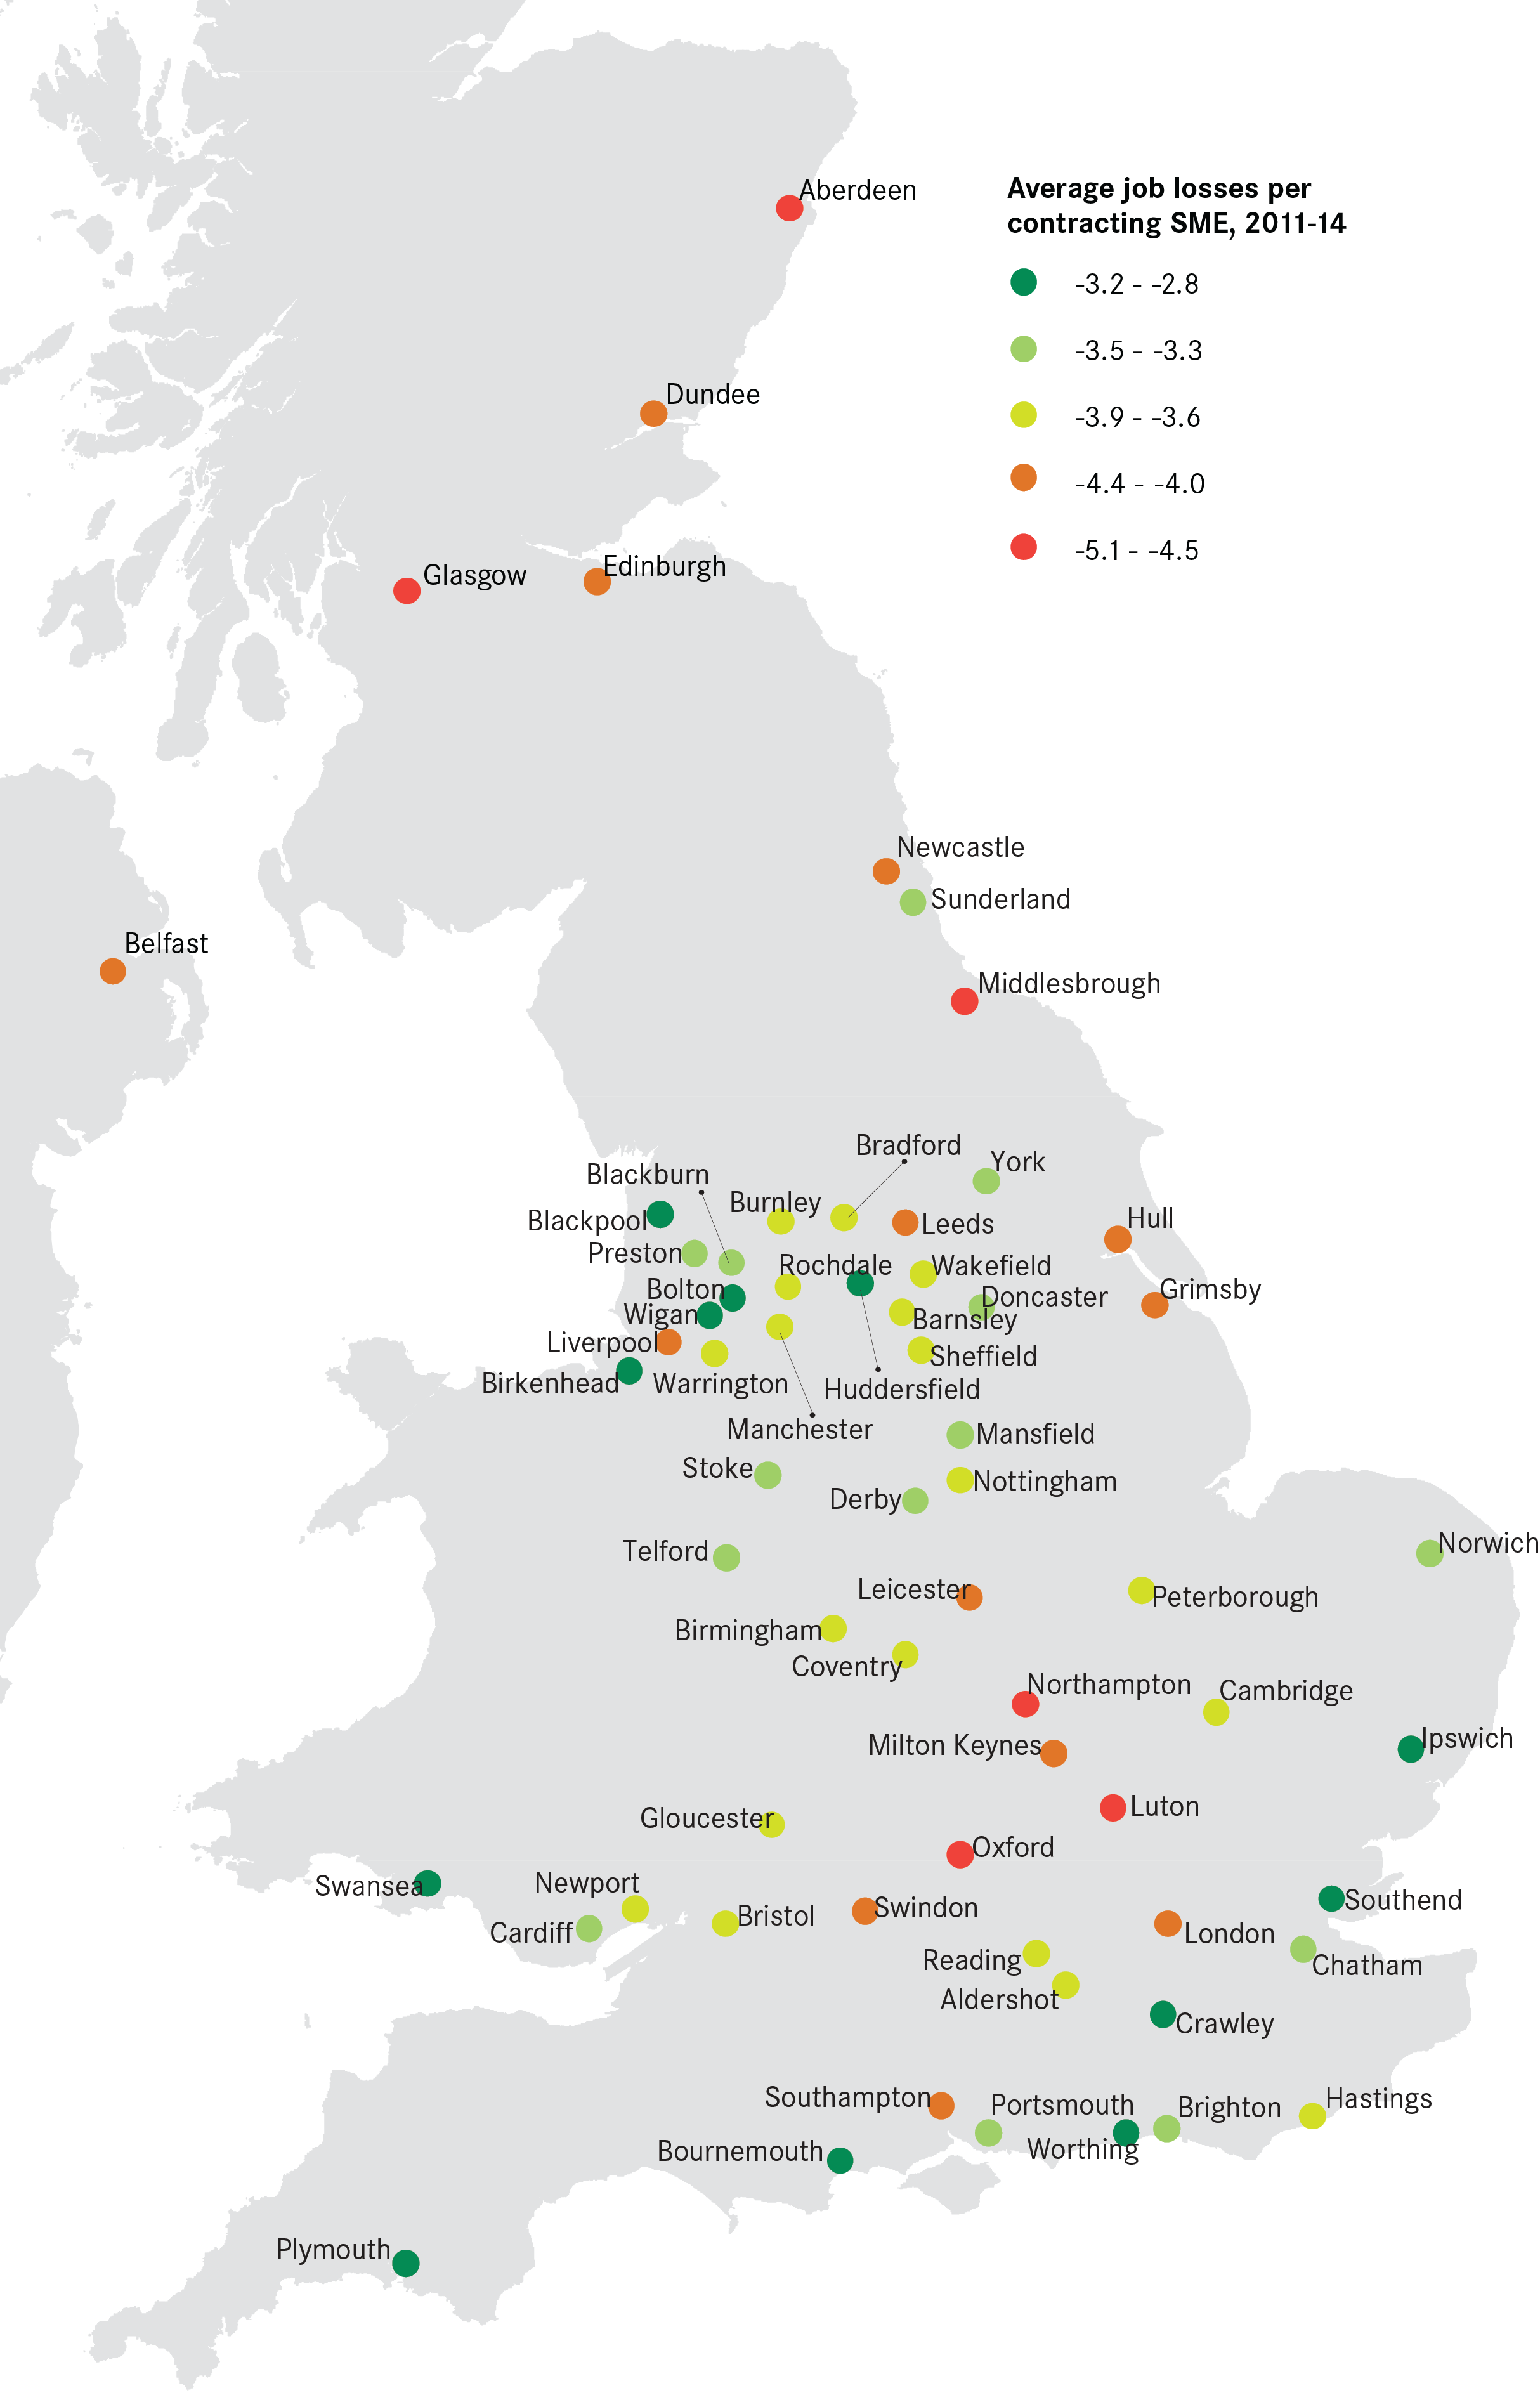
- Each contracting SME in cities shed four jobs on average. This is higher than the national average of 3.6 jobs lost per contracting SME. The highest level of employment loss per contracting firm was in Luton, with five job losses per contracting firm. In contrast, contracting SMEs in Worthing lost 2.8 jobs on average.
- Aberdeen, Birkenhead and Leicester had the highest ratios of expanding firms relative to contracting firms. Conversely, Norwich, Blackpool and Belfast had the lowest ratios, meaning the number of expanding SMEs was only slightly higher (or even lower in Belfast) than the number of contracting SMEs.
- 30 cities saw an increase in their proportion of SMEs contracting between 2008/11 and 2011/14. Cambridge, Aldershot and Worthing experienced the highest increases in SMEs contracting relative to their total SME population, while Swansea, Sunderland and Belfast saw the largest falls in SMEs contracting.
Figure 13: Average job losses per contracting SME, 2011-14
Variation by size and sector
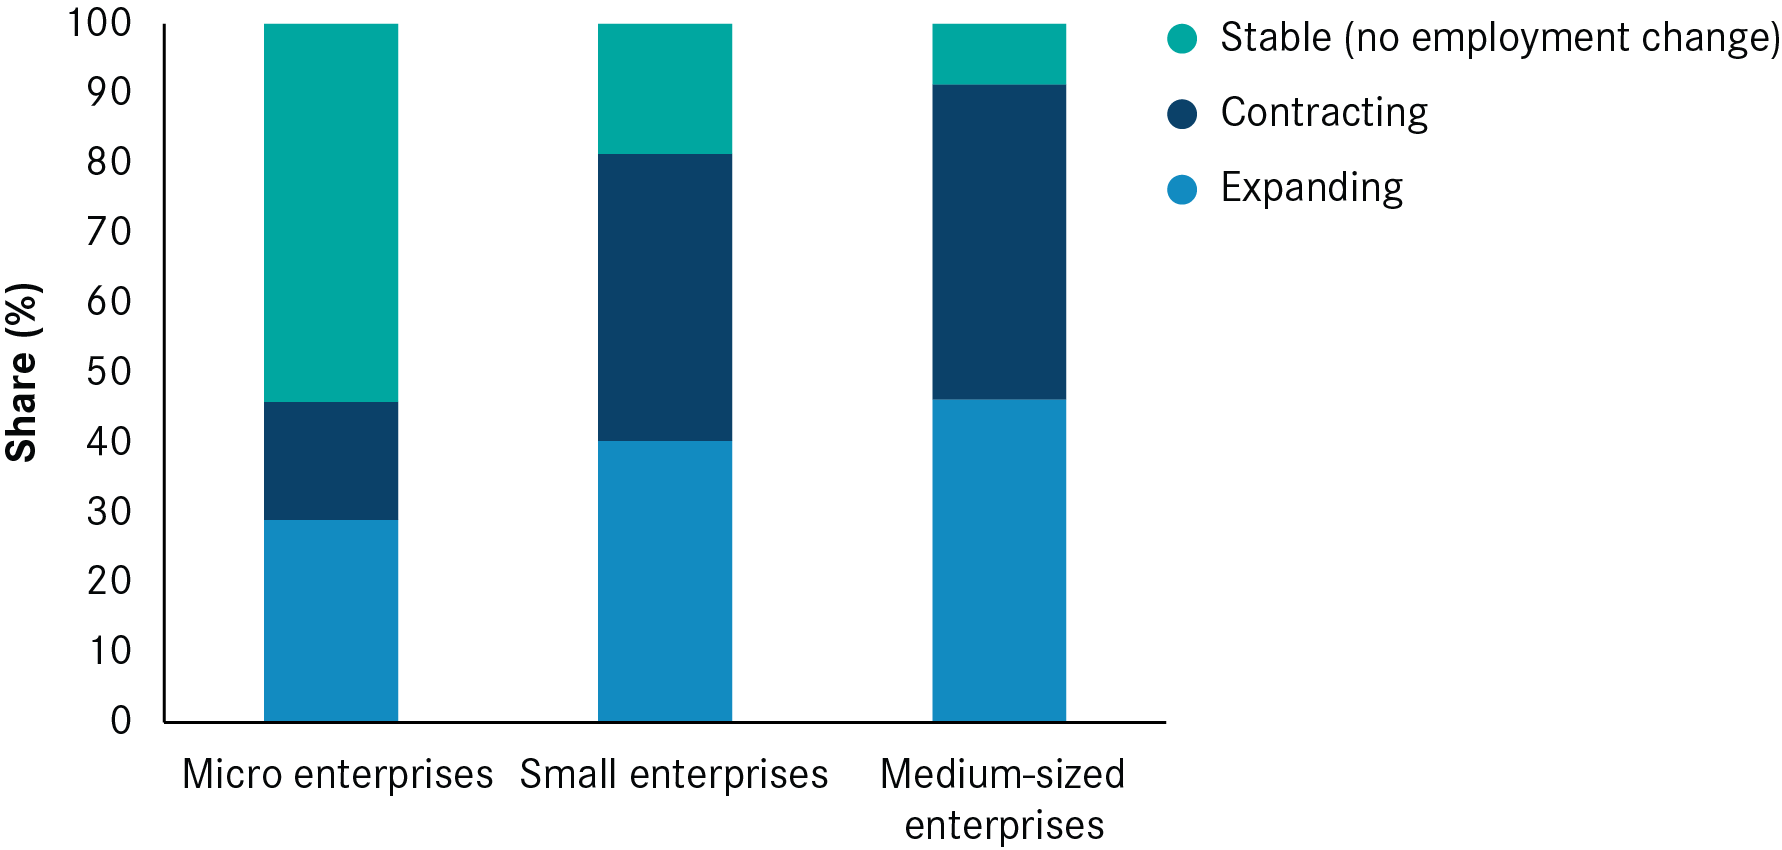
- Looking at SME size, micro-businesses (0-9 employees) had the lowest percentage of contraction: 16.9 per cent of micro businesses in cities contracted. The range in proportion of contracting micro-businesses is relatively small between cities, ranging from 12.9 per cent in Aberdeen to 19.9 per cent in Blackpool. Micro-businesses represented 31.6 per cent of jobs lost from SME contracting.
- 41.1 per cent of the total small business (10-49 employees) population in cities contracted. In Belfast, 52.8 per cent of small businesses reduced the size of their workforce, compared to 36.5 per cent in Huddersfield. Overall, small businesses were responsible for the highest proportion of jobs lost in contracting SMEs (35.6 per cent).
- 61 per cent of medium-sized (50 to 249 employees) businesses in Hastings contracted between 2011 and 2014. This is higher than the cities average (45.1 per cent) and almost twice as much as in Worthing, where 32 per cent of medium-sized businesses contracted. Medium-sized SMEs represented 32.8 per cent of the total jobs lost between 2011 and 2014.
- Contracting KIBS firms lost fewer jobs than manufacturing firms. In cities, each contracting KIBS SME lost 4.1 jobs on average between 2011 and 2014, against 4.8 jobs lost per contracting manufacturing SME. In both industries, there were about 2.2 times more jobs created than lost.
Figure 14: SME growth in cities by size, 2011-2014
- KIBS firms in Luton, Oxford and Middlesbrough generated the highest number of job losses relative to the number of contracting firms (8.1, 5.7 and 5.1 jobs lost per contracting firm respectively). However in Oxford and Middlesbrough the number of jobs created by KIBS firms outweighed the jobs lost.
- Manufacturing firms in Milton Keynes, Grimsby and Swindon accounted for the highest number of job losses per contracting firm (respectively 10, 7.7 and 7.4 jobs lost per firm contracting). Only manufacturing firms in Grimsby created more jobs than they generated losses.
- KIBS firms in London were highly job destructive (4.6 jobs lost per contracting firm, higher than the city average of 4.1 jobs), but this was dwarfed by the number of jobs they created (seven jobs per expanding firm).
Closures
Between 2011 and 2014, just over half (52 per cent) of SME closures were in cities. 14.2 per cent of city-based firms operating in 2011 had closed by 2014, compared to 13.4 per cent at the national level.
- The range of closure rates is relatively small: Belfast aside, they ranged from 11.8 to 15.6 per cent, with 43 cities having a closure rate between 12 and 14 per cent.
- SMEs located in Glasgow were the most likely to close, with a rate of 15.6 per cent, followed by London and Newport (15.3 per cent).
- While London had the second highest closure rate, it also had the highest number of business birth in the country in 2013. This illustrates the fast-paced ‘churn’ taking place in the city.
- Rate of closures were lowest in Belfast, where only 4.6 per cent of the SMEs operating in 2011 had closed by 2014.
‘New Work’ Industries
Digital SMEs
- Southern cities tend to have the highest number of digital SMEs relative to their total SME base (proportion), with the exception in the top 10 being Edinburgh and Coventry. Reading, Milton Keynes and Cambridge have the highest concentrations with more than one in six SMEs in these successful city economies operating in the digital sector.
- The proportion of businesses in Reading, Brighton and Milton Keynes is large enough for them to rank in the top 10 for their share of total UK digital SMEs, despite being smaller cities with fewer SMEs in general.
- London has only the tenth highest proportion of SMEs, but given its size is home to 30 per cent of digital SMEs – by far the largest share.
- Cities with the largest increase in digital SMEs were Plymouth and Gloucester. These cities both saw a rise of over 40 per cent between 2011 and 14. However both remain in the bottom 20 cities for the share of digital SMEs overall, although Plymouth’s employment growth in the digital sector was ranked 11th.
- Doncaster, Hull, Middlesbrough and Sunderland were four of the five cities with the lowest growth in digital firms – although Sunderland saw the fifth largest employment growth in digital SMEs. These cities all perform relatively weakly in overall measures of jobs, business and population change over the last 10 years.
- Cities with the highest proportion of digital SMEs also have the highest proportions of SME jobs in the digital sector. However it is London’s digital SMEs that employ the highest number of people, about eight times higher than Manchester and 10 times higher than Birmingham.
- Employment in the digital sector increased the most in Belfast, Gloucester and Aberdeen. In Gloucester the number of jobs in digital SMEs increased by more than 30 per cent. London still ranks in the top quarter of cities for growth in employment , with digital SMEs employing 17 per cent more workers than in 2011.
Creative SMEs
- Creative SMEs are generally under-represented in cities outside London and the South in terms of both proportion and share of the UK’s creative SMEs.
- The capital alone is home to 41 per cent of the UK’s creative SMEs. But Brighton has the highest proportion of SMEs in the creative industries relative to the size of the city’s total SME base (concentration), with one in eight SMEs operating in the sector. London has the second highest concentration.
- Generally, larger cities have a higher proportion (as well as share) of creative SMEs than other cities. Hastings has the sixth largest proportion of creative SMEs in the country, despite a below average proportion of ‘new work’ overall. In contrast, Mansfield has the lowest proportion, with less than two per cent of SMEs operating in the creative industries.
- Burnley had the largest percentage increase (36.9) in creative firms between 2011 and 2014, however this was from a small base and it remains in the bottom five cities in 2014. Liverpool is ranked fourth for change over this period – the only large city in the top five. It is now the city with the 28th largest proportion of creative firms.
- Gloucester, Newport, Blackpool and Stoke all lost creative firms. Cambridge had the fifth lowest change, although this was a four per cent increase. It also retains the fourth highest proportion of creative firms.
- About 10 per cent of the SME workforce in London is employed by a firm operating in the creative sector. In Cambridge, Brighton and Oxford, creative SMEs employ more than 6 per cent of the SME workforce. In total seven cities have more than 5 per cent of their SME workforce working in creative industries.
Professional services SMEs
- The Greater South East is home to seven of the 10 cities with the highest proportion of professional services relative to total SMEs (concentration), but the top three – Aberdeen, Middlesbrough and Warrington – were all outside of this area. Barnsley and Burnley have the lowest concentration of professional services; Hastings is the only city in the South East to rank in the bottom 10.
- Aberdeen saw the largest increase in professional services SMEs. Coventry and Middlesbrough are the other cities in the top three, both of which are medium sized cities.
- Preston had a much smaller increase in professional services than any other city, although this was still positive, with a six per cent increase.
- Aberdeen had the highest share of workers in professional services, with more than 30 per cent of its SME workforce employed by professional services SMEs. The other cities in the top three were Oxford and Warrington with about 24.5 per cent each. At the other end of the spectrum, 11 per cent of Mansfield’s workforce were employed by professional services SMEs.
- Six cities – Aldershot, Cambridge, Crawley, Edinburgh, London and Oxford – rank in the top 15 cities for all three of the New Work sectors – digital, creative and professional services