
01Introduction
Policy needs to adapt and respond to the changing way people live their lives. Housing policy needs to respond to preferences and trends, both in terms of where houses are built, and the type and tenure of those houses.1 Transport infrastructure should support travel patterns between where people live, work and consume amenities. The provision and location of public services – from GPs and hospitals, to recycling centres, to fire stations – needs to align with the needs of local residents, as do local amenities such as shops, restaurants, libraries and open spaces. And public policy can also shape preferences and trends – walkable neighbourhoods and lifestyles can have a positive effect on residents’ civic engagement, health2 and energy usage.3
Previous work by the Centre for Cities has highlighted the need for a better understanding of the demographics of cities in policy-making.4 But where people live and why they live there is not typically accounted for across the range of policy areas that such decisions affect.
City growth strategies often seek to attract certain firms and people into certain parts of cities, particularly city centres. But while we know more about how and why jobs and businesses are drawn into city centres, our understanding of the types of people drawn to live in different parts of cities, and why they choose to go there, is rather more limited.
The same is not true in the US, where residential patterns, and in particular, the return of “millennials” to cities, has hit the mainstream. Over 5,000 web pages match the search term “best city for millennials”. The young, digitally-engaged and well-educated generation born between 1980 and 2000 are transforming urban America by rejecting the car-dependent lifestyle of previous generations and instead embracing public transport, walking and cycling,5 preferring dense, mixed-use neighbourhoods to zoned urban sprawl.6
This report is the first of two which together aim to provide a more detailed picture and understanding of where people live, why they live there, and how that has changed since the turn of the century, in order to better inform the wide range of policy areas affected by living patterns.
For the purposes of this report the ‘city’ is divided into three parts: city centre, suburb and the hinterland.
City centres tend to have a mix of jobs and amenities that are accessed by people from surrounding areas, as well as people living in them. In 2011, 28 per cent of the 14 million people living and working in cities across England and Wales worked in city centres, and 1.6 per cent of the population of England and Wales lived in city centres.
Suburbs are primarily residential areas and house the majority of the city and the country’s population. In 2011, 55 per cent of the total population of England and Wales lived in suburbs.
Rural hinterlands are crucial for cities. 33 per cent of the population of England and Wales lived in the rural hinterlands around cities in 2011, and more than one in five of these residents work in a city.
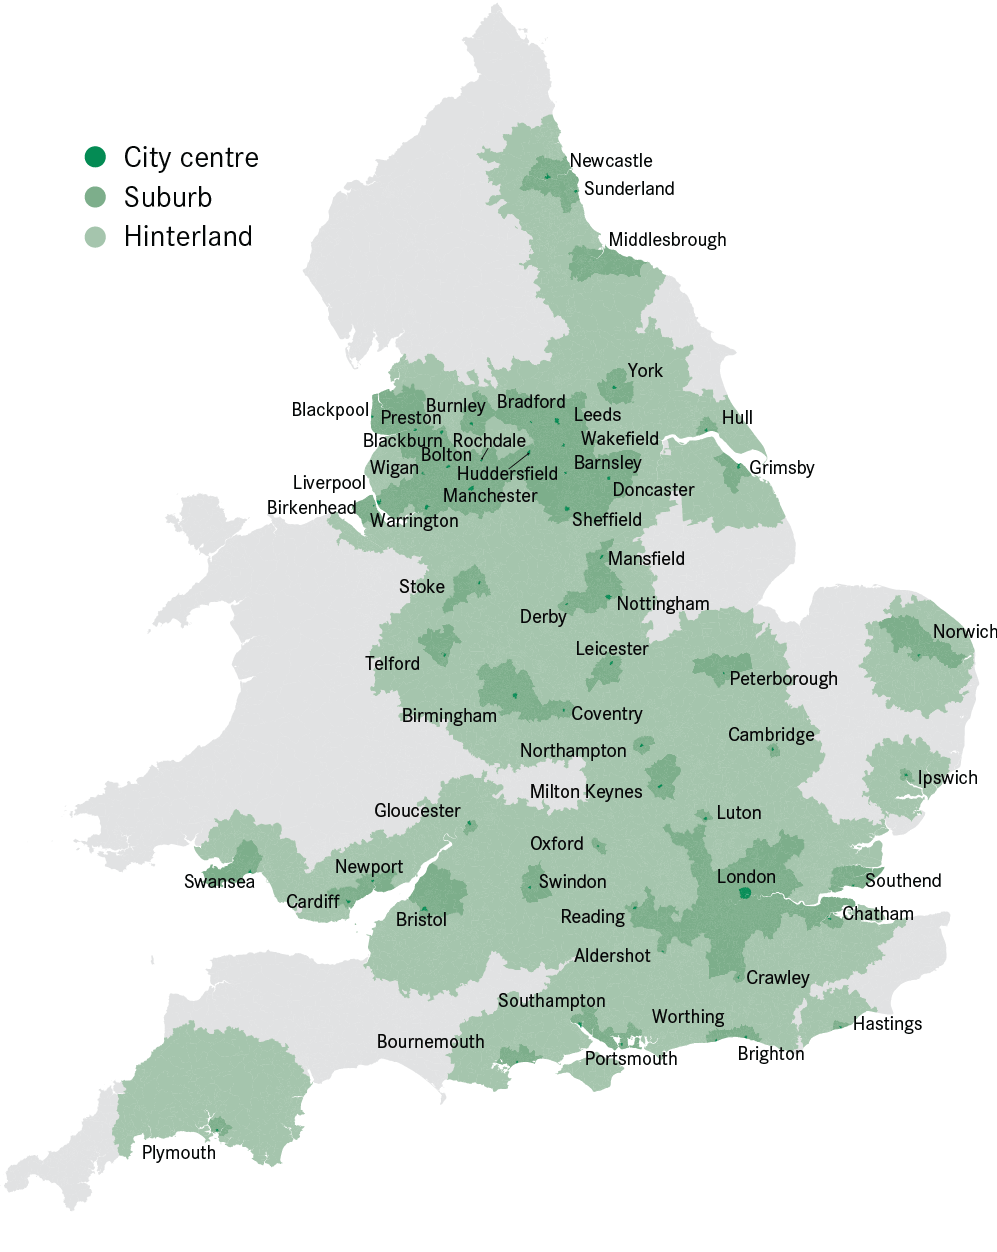
Figure 1: City centres, suburbs and hinterlands in England and Wales
Box 1: Methodology
This analysis is built up from three parts of each city: city centre, suburb and hinterland. It also makes a distinction between four types of cities: London, large cities, medium cities and small cities.
City centres are defined based on all the lower super output areas (LSOA, the lowest geography available from census data, roughly equating to a neighbourhood) that fall within a circle of:
- London – radius of 2 miles;
- Large cities – radius of 0.8 miles;
- Medium and small cities – radius of 0.5 miles.
Suburbs are the rest of the Primary Urban Area, a standard statistical geography which reflects the continuous built up area of a city.7
Hinterlands are the areas around a city that are within commuting distance. They are bespoke to each city, and are dependent on the average distance travelled by those who live outside of the city but commute into the city. In Plymouth, for example, the radius used is 56 km; in Bradford it is just 30 km.
The majority of this research is built from census data from 2011 and, where comparable, from 2001 in order to understand the demographics of these areas. For a full explanation of the data used, refer to the appendix.