03The varying performance of exporters explains differences in productivity across the country
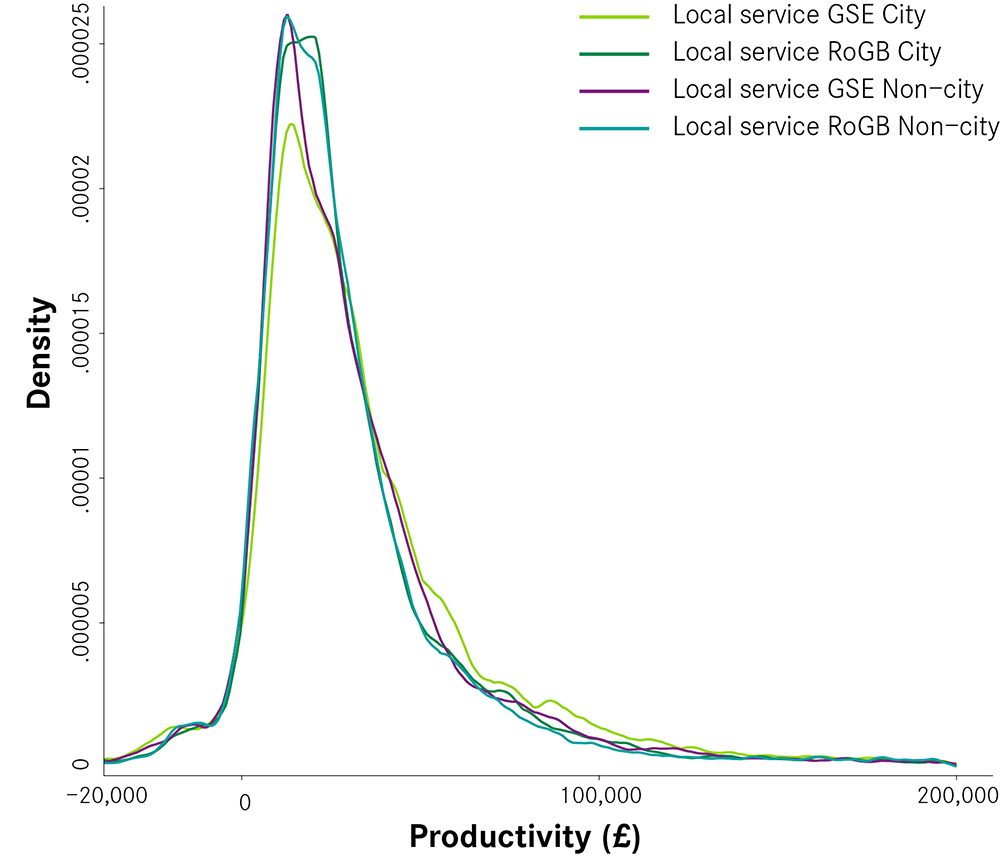
How these patterns play out varies across the country. Figure 4 sets out the distribution of exporters and local services across four areas in Britain: cities in the Greater South East; non-urban parts of the Greater South East; cities elsewhere in Britain and non-urban areas elsewhere in Britain. There are a number of things to note from this.
Firstly, the national pattern of the distribution of local services and exporters holds across the four geographies, with lower productivity businesses tending to be local services.
Secondly, there is little difference in the distribution of local services firms. Local services dominate the long tail in all areas, and have very similar distributions, with only local services in the Greater South East performing slightly better. This is in line with average productivity data for local services, which shows that there isn’t a great deal of variation in the productivity of local services across the country.
Thirdly, there is a greater degree of variation for exporter businesses. It is the varying performance of these businesses that drives the varying standards of living seen across the country. Cities in the Greater South East have the lowest share of low productivity exporting businesses, and a larger number of high productivity ones. Meanwhile cities elsewhere in Britain have the largest share of lower productivity exporting firms, even lagging behind their
non-urban neighbours.
Figure 4a: Distribution of firm level productivity in exporters and local services across different geographies, 2015
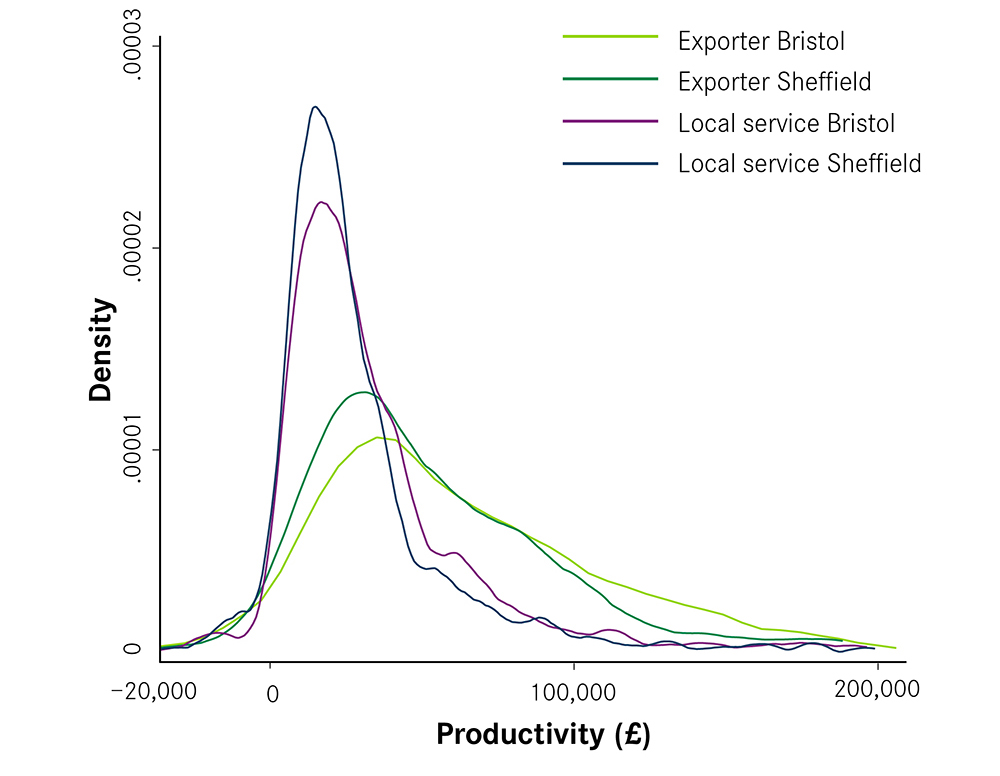
Figure 4b: Distribution of firm level productivity in exporters and local services across different geographies, 2015
Looking at the share of each geography’s export base that is amongst Britain’s productivity leaders (i.e. of all the exporters in an area, what share of them are amongst Britain’s leaders) emphasises this last finding. As Figure 5 shows, 35 per cent of all exporters based in cities in the Greater South East were amongst Britain’s leader firms, while 48 per cent of all their export jobs were in this category. In contrast, for cities elsewhere in Britain, 20 per cent of their exporting business were leaders in 2015, accounting for 25 per cent of their exporting jobs.
The implication from this is that it is the lack of higher productivity exporters in cities elsewhere in Britain that drives the divergence in productivity seen across the country, rather than the long tail of unproductive businesses in these cities. Box 3 shows how this plays out in Reading and Hull and Sheffield and Bristol.
Figure 5: The share of exporting businesses and jobs that are amongst Britain’s productivity leaders, 2015
Box 3: Productivity of businesses in Reading and Hull and Bristol and Sheffield
The productivity of businesses across the two groups of cities are reflected in the performance of individual cities. Figure 6 and Figure 7 compare the distribution of businesses in Reading and Hull and Bristol and Sheffield. The main difference between the two pairs of cities is the number of higher productivity businesses in them, with both Bristol and Reading having a greater share than Sheffield or Hull. This is most pronounced between Reading and Hull, with the latter having a much larger share of lower productivity exporters than the former.
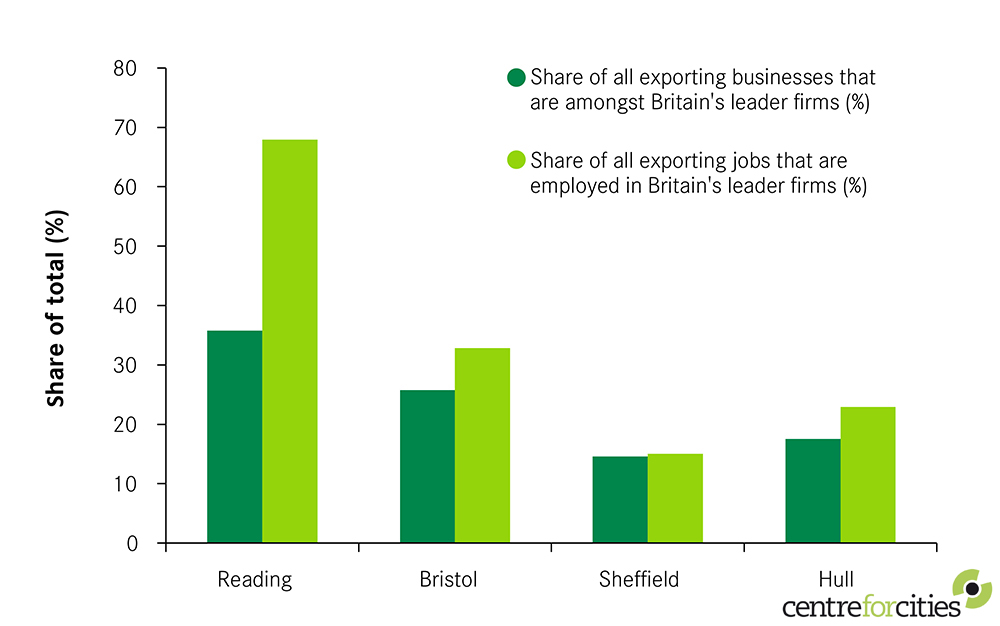
Reading also had by far the largest share of its exporting businesses and jobs amongst Britain’s leader firms, while Sheffield in particular performs poorly on this measure (see Figure 8).
Figure 8: The share of exporting businesses and jobs that are amongst Britain’s productivity leaders in Reading, Bristol, Sheffield and Hull, 2015
This has obvious implications for overall levels of productivity. As Figure 9 shows, cities outside the Greater South East are the least productive of all four areas. The gap in performance between cities in different areas in particular is stark. While the difference in productivity between non-urban parts of Britain is 15 per cent, cities in the Greater South East are almost 50 per cent more productive than cities elsewhere.
This is a major cause for concern for the national economy – the underperformance of these cities goes a long way to explain both why the rest of Britain lags behind the Greater South East and why it performs poorly on a European level. To illustrate the impact, if all cities were as productive as those in the Greater South East, the British economy would be 15 per cent more productive and £225 billion larger. This is equivalent to Britain being home to four extra city economies the size of Birmingham.


