
02Not all businesses make the same contribution to productivity (or should be expected to)
Previous work by Centre for Cities has shown that businesses that are more likely to sell beyond their local markets – such as car manufacturers, finance companies and communications businesses– tend to be more productive than those that focus more on local markets, such as retailers, restauranteurs or fitness instructors. For example, at the national level, information and communications produces twice as much to the economy per worker than distribution (which includes retailers and hotels), while finance is three times Previous work by Centre for Cities has shown that businesses that are more likely to sell beyond their local markets – such as car manufacturers, finance companies and communications businesses– tend to be more productive than those that focus more on local markets, such as retailers, restauranteurs or fitness instructors. For example, at the national level, information and communications produce twice as much to the economy per worker than distribution (which includes retailers and hotels), while finance is three times as productive.
These ‘exporting’ (or tradeable) businesses are also disproportionately responsible for productivity growth in the national economy. Between 1990 and 2017, productivity more than doubled in the manufacture of computer and electrical equipment and information and communications, and tripled in chemicals and pharmaceuticals. By way of contrast, it increased by just 2 per cent in accommodation and food services and declined in arts, entertainment and recreational services.
This occurs because of the greater ability for exporting businesses to absorb new innovations. The ability of manufacturing to automate certain processes, or the development of ever more sophisticated computer software in information and communications have greatly increased the output that a worker produces in these industries. But while a fitness instructor may use a smartphone today in place of a ghetto blaster in 1990, he or she can still only instruct one class at a time. And a waiter or waitress can only serve so many tables. Of course, improvements such as the introduction of handheld electronic devices allow orders to be sent to the kitchen more efficiently, will bring benefits, but these improvements won’t radically increase the output of the waiter. Understanding these facts changes our understanding of the long tail. Figure 2 shows the distribution of exporters and local services businesses according to their productivity, and shows how local services businesses are likely to be much less productive than exporters (Box 2 explains methodology).
Figure 2: Distribution of firm level productivity by exporting and local service businesses for Great Britain, 2015

Box 2: Understanding kernel densities
In this report the kernel densities plot the distribution of average worker productivity in individual businesses. The large skew to the left of the chart shows a concentration of lower productivity businesses. Perhaps confusingly, this bunching of businesses has been labelled as the‘long tail’.In the charts some businesses have negative productivity. This occurs when businesses spend more than they earn.
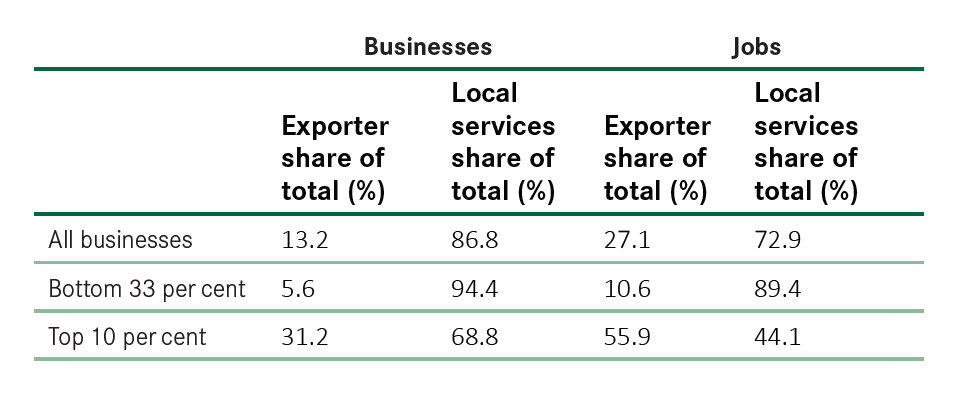
Looking at the composition of the long tail illustrates this. Figure 3 looks at the make-up of different groups of businesses according to their productivity. When looking at all businesses, exporting businesses accounted for 13 per cent of the total number in the non-financial economy in 2015, and 27 per cent of all jobs. But they were much less well represented in the bottom 33 per cent of businesses for productivity – the laggards – accounting for 5.6 per cent of all businesses and 10.6 per cent of all employment in this group.
In contrast, they were over-represented in Britain’s productivity leaders – the most productive 10 per cent of businesses. Of this elite group, exporting businesses accounted for 31 per cent of the total number of businesses, and an even larger 56 per cent of all jobs.
Figure 3: Share of businesses in the leaders and laggards, 2015
The result is that in 2015 just one in 10 exporter jobs were in laggard companies, compared to almost a third of all local services jobs.