
01Policy priorities
Figure 1: Overall policy priorities
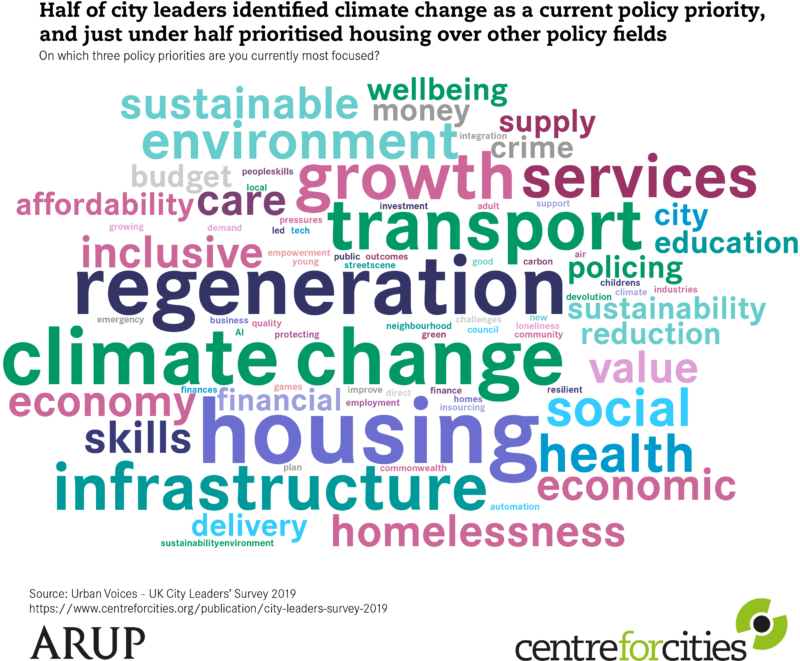
Half of the respondents (50 per cent) mentioned climate change as one of their top policy priorities. Challenges related to housing, such as affordability, availability of social housing and rising demand against supply, continue to be policy priorities. Almost half (44 per cent) of respondents said they are prioritising housing over other policy areas.
Almost one-third (29 per cent) of our respondents ranked either the development of local infrastructure or sustainable transport highly on their agenda.
Last year’s respondents overwhelmingly mentioned inclusive economic growth as one of their priorities. This was higher than the level stated by this year’s respondents. In addition, although some of last year’s respondents mentioned air quality and the environment as priorities, this was much more clearly stated by this year’s respondents. While we do not have the reason for the higher prominence of focus on these issues, they are likely to have been impacted by the growing awareness of climate issues, Extinction Rebellion and the ‘Greta Effect’.
Figure 2: Transport and infrastructure
![]()
Modal shift is a top transport priority for city leaders. 63 per cent of this year’s leaders put switching from car to public transport or active travel (e.g. walking and cycling) as a priority. In line with overall policy priorities, this highlights that zero-carbon active travel and lower carbon public transport are of high importance for this year’s respondents.
In addition, buses grew in importance compared to last year. While less than one-third of last year’s respondents mentioned buses as a priority, almost half (47 per cent) of this year’s respondents did so.
Despite the strong focus on public transport, 44 per cent of this year’s respondents stated that road connections to other cities are a priority to them. But while half of respondents last year identified roads within the city as a priority, less than one in five of this year’s respondents did.
Figure 3: Housing
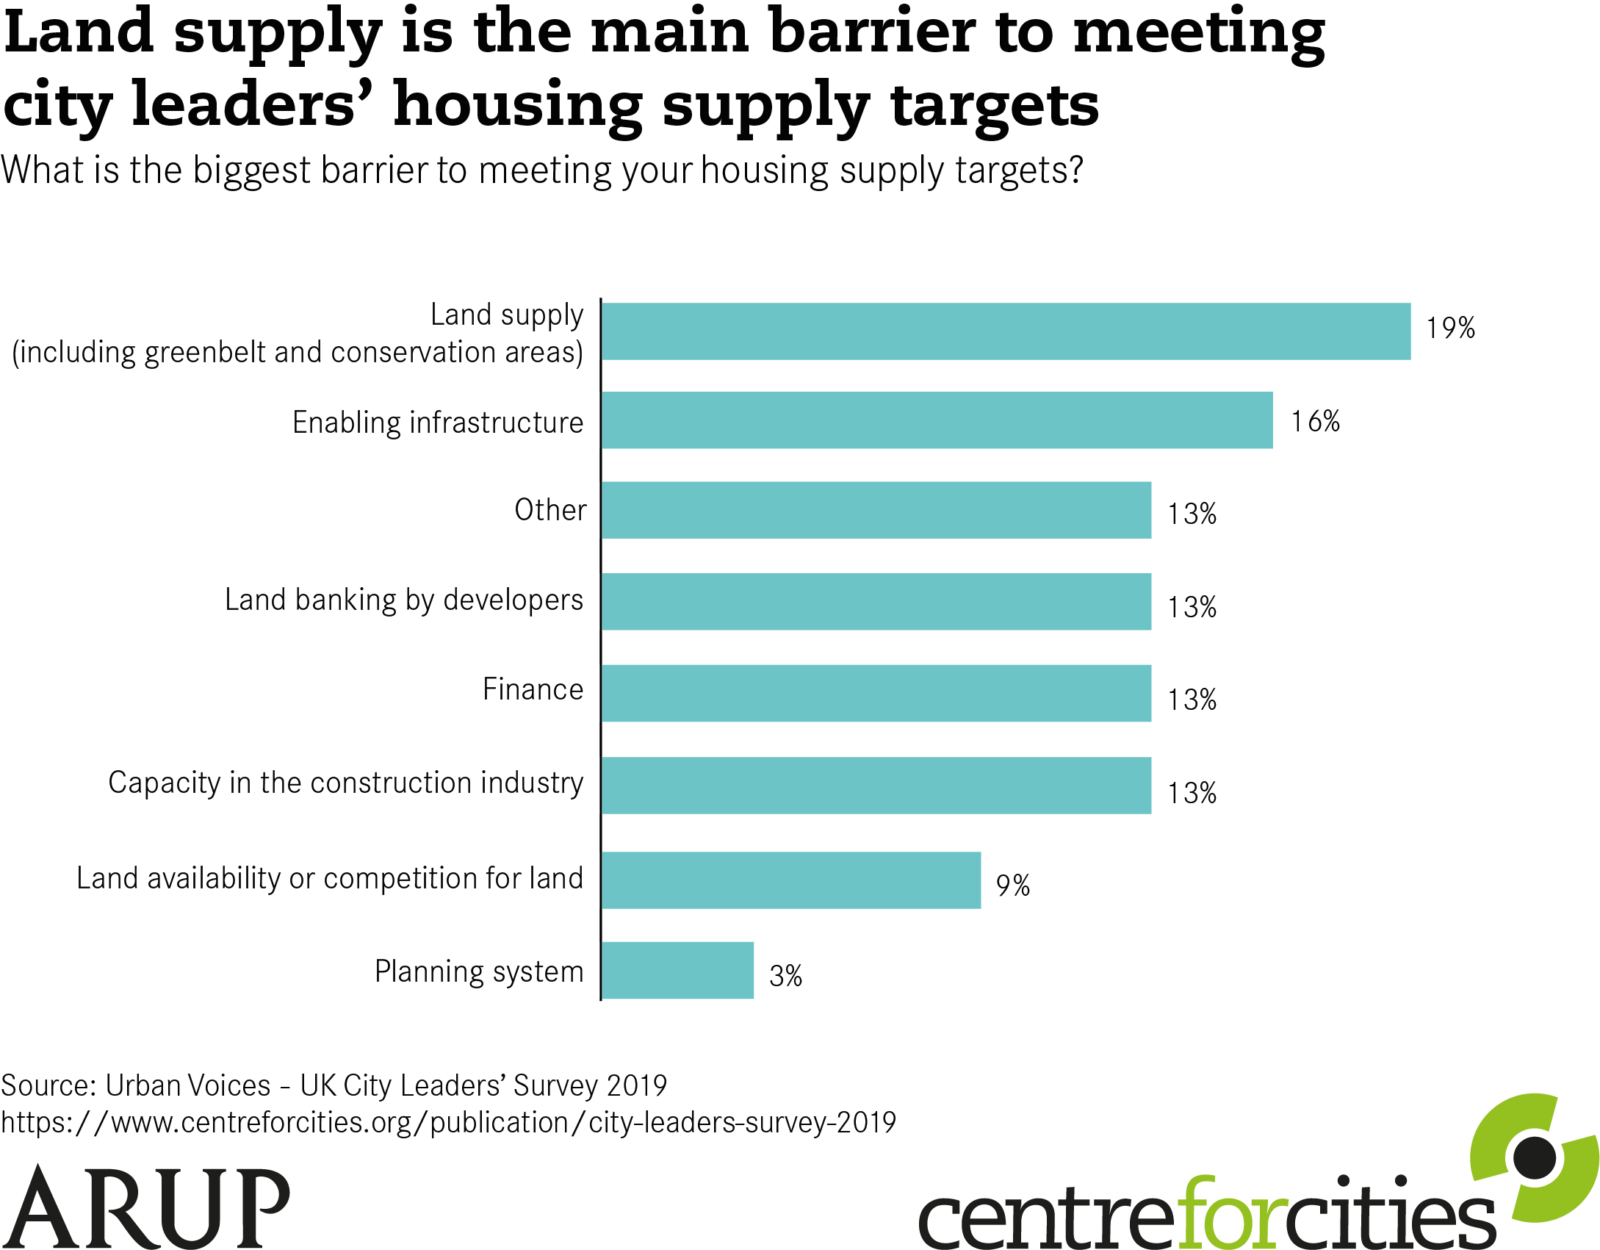
The UK still fails to build enough homes to meet demand. The strain on local areas varies across the country. Some areas have vacant homes and need regeneration, while other areas struggle to make housing affordable for many workers.
Land supply and enabling infrastructure development were identified by leaders as the biggest issues in regard to housing supply. Almost one in five (19 per cent) mentioned land supply as the biggest barrier to increasing housing numbers, and 16 per cent reported that infrastructure is an obstacle to the achievement of housing supply targets.
Land banking, finance, capacity in the construction industry and “other” (mostly financial and capacity barriers) all received an equal share of responses (13 per cent).
Only one respondent said that the planning system is the greatest obstacle to meeting housing supply goals, and no one reported that local opposition to development or low demand hinders the accomplishment of these goals.
Figure 4: Jobs
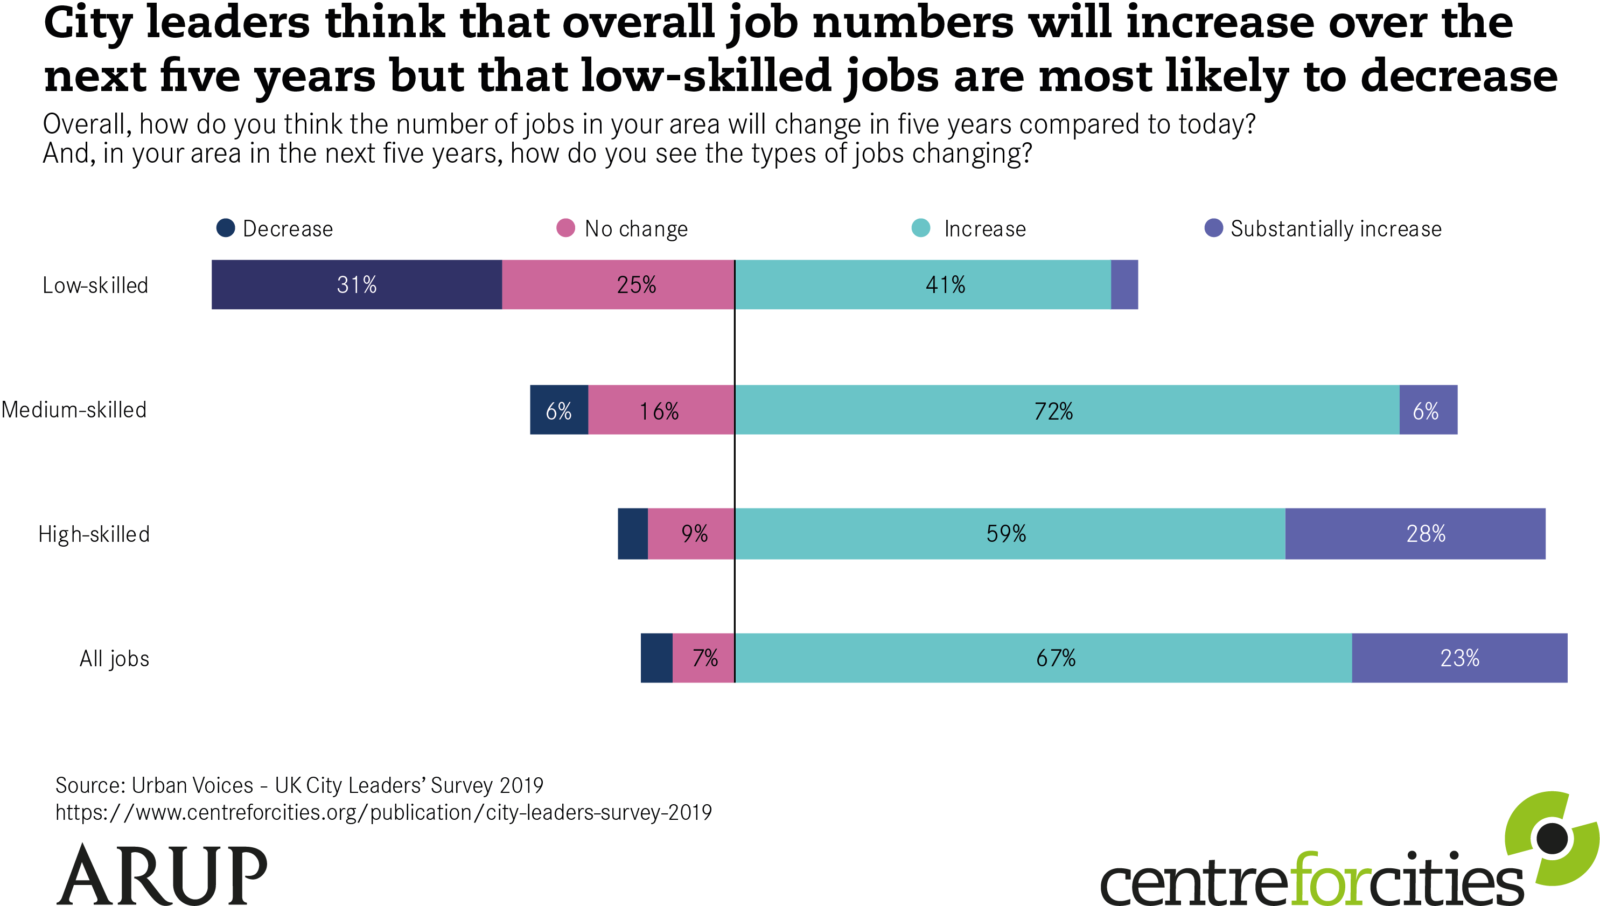
Technology is changing the way businesses work, and Brexit could change the types of jobs we have in the UK. So, we asked city leaders how they thought the types of jobs (by skill level) in their area might change in the coming years.
Most leaders (90 per cent) said that the number of jobs, regardless of their required skill level, will increase in the future. High-skilled jobs are perceived as most likely to either increase (59 per cent) or increase substantially (28 per cent). Just one respondent expected high-skilled jobs to decline. Only slightly more council leaders viewed low-skilled jobs as likely to increase (43 per cent) compared to decline (31 per cent).
Figure 5: Public services
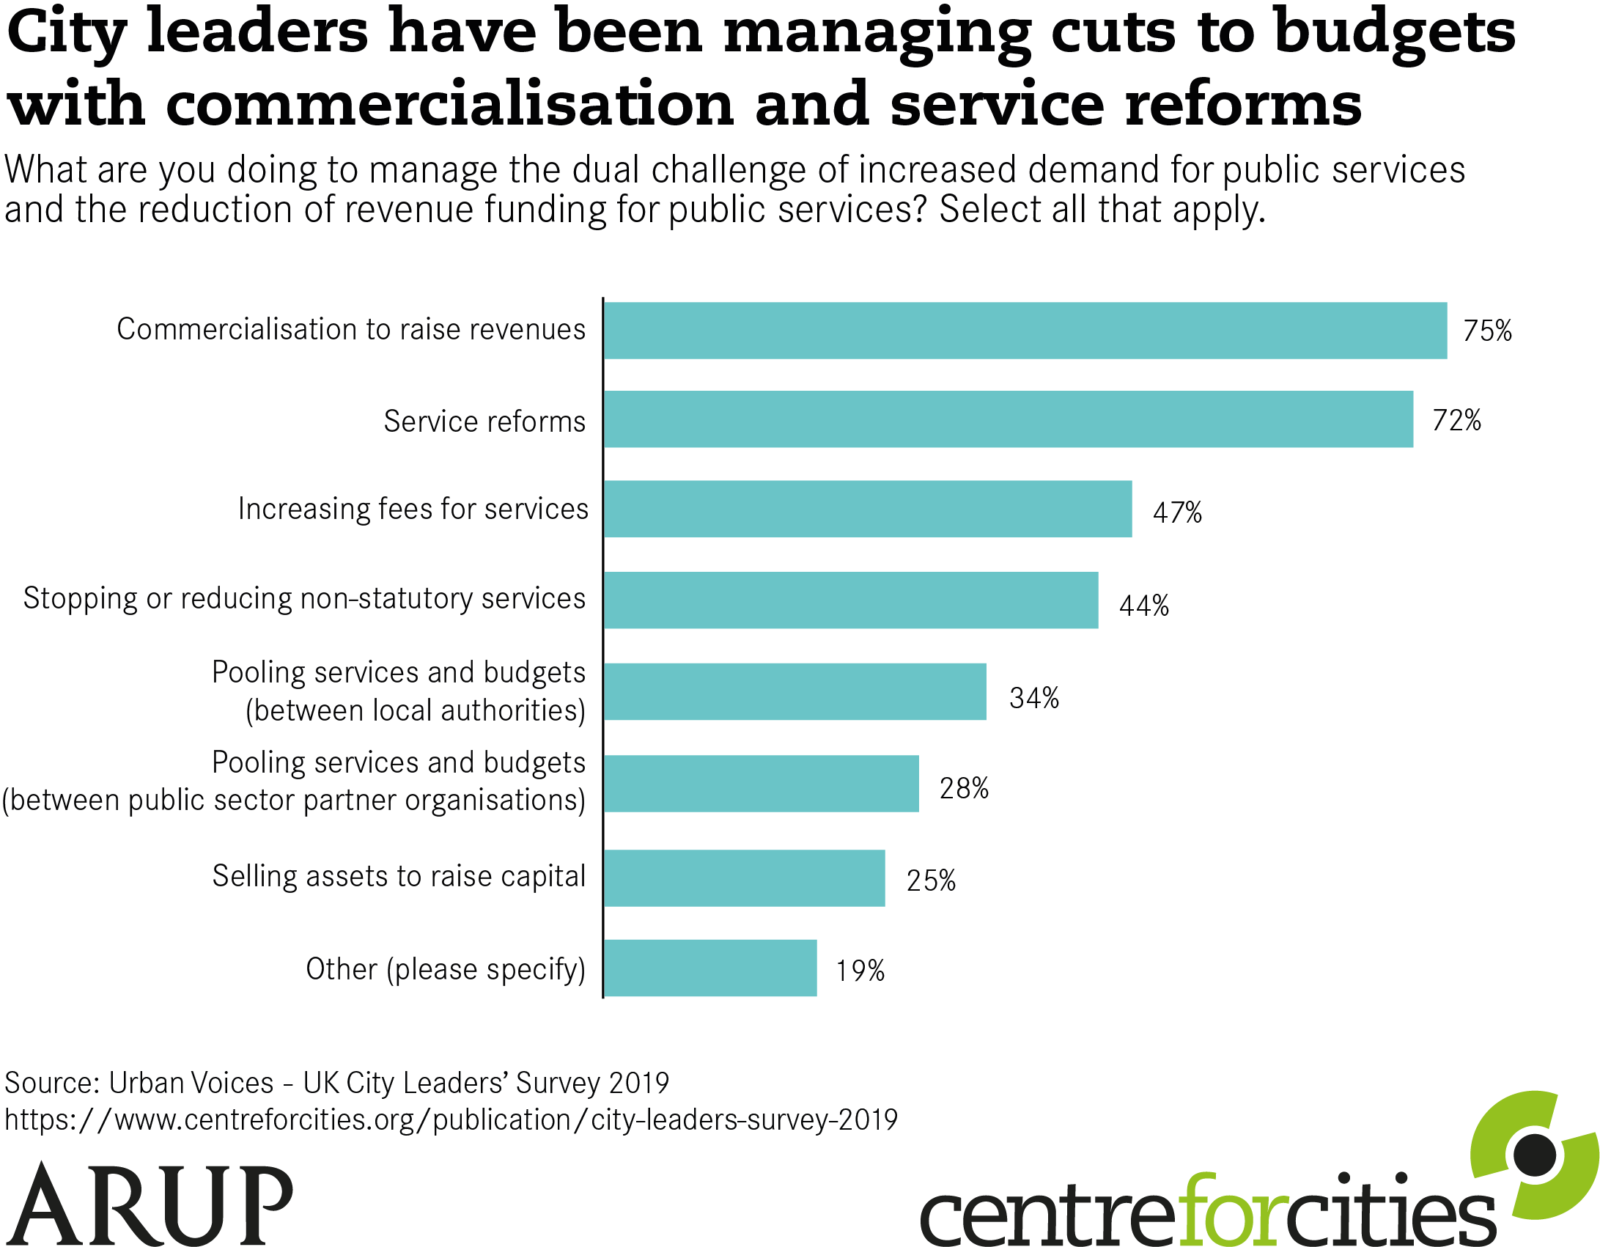
Since 2010, cities have borne a disproportionate amount of funding cuts. Nearly three-quarters (74 per cent) of all local government funding cuts in real-terms (accounting for inflation) have fallen on cities, despite being home to just 54 per cent of the population. Efficiencies have been made, but many areas now find it difficult to provide valuable services due to budget constraints.
Commercialisation and service reform are top priorities for leaders to respond to increasing pressures on public services. Three out of four respondents said they are increasing commercialisation, and almost the same number of respondents (72 per cent) are reforming services.
Others were pooling services and budgets between public sector partner organisations (28 per cent) and selling assets to raise capital (25 per cent).
Almost one in five (19 per cent) chose “other” ways of coping with public service pressures. Leaders who chose this option mentioned that they are approaching public service challenges with alternative finance models and a focus on efficiency and preventive measures.
Figure 6: Inclusive growth

Inclusive growth is the idea that the distribution of the opportunities to benefit from growth in a city are more evenly spread. Many city leaders are considering inclusive growth in their economic development strategies.
According to city leaders, attracting investment, housing affordability, education for adults and public transport are the greatest barriers to inclusive growth. A lack of new investment hampers inclusive growth in many cities, according to respondents; 41 per cent of leaders chose attracting investment as a central way to encourage inclusive growth.
Attracting investment is followed by housing affordability (38 per cent), public transport (31 per cent) and education and training for adults (31 per cent) as challenges to not just the levels of growth but how the benefits of that growth are distributed within cities.
Attracting new investment was only identified as a top barrier by about one in four of last year’s respondents. Similarly, local business support and access to health and social care are again perceived as less important than other factors to support inclusive growth.
Figure 7: Air quality

Air quality continues to be a local, national and international policy concern. But in particular, air pollution is an urban issue. According to the World Health Organisation (WHO), more than 80 per cent of people worldwide living in urban areas monitoring air quality are exposed to pollution levels that exceed their ‘safe’ limits1. In the UK, 40 cities and towns are at or have exceeded WHO air pollution limits.
The overwhelming majority of respondents (75 per cent) said that the encouragement of cycling and walking by improving pavements and cycling routes is critical to improve the air quality in their city. More than half (56 per cent) are prioritising reducing emissions from local authority vehicle fleets. Encouragement of bus use ranked third with 41 per cent, highlighting this year’s focus on the development of public transport.
On the other hand, higher parking charges for diesel vehicles and the support of scrappage schemes were only chosen by 9 and 6 per cent, respectively.
Figure 8: Climate change

Climate change has gained more prominence in the media over the past year, with groups like Extinction Rebellion making the headlines and the implementation of UN Sustainable Development Goals. In the UK, 65 per cent of all 353 local authorities and eight combined authorities have declared a climate emergency.
Access to financing constitutes a major obstacle to addressing climate change. More than two- thirds (69 per cent) identified access to funding as one key barrier and 41 per cent of respondents highlighted national policy barriers as a significant obstacle in the fight against climate change.
Municipal capacity was chosen by more than one third (38 per cent), indicating the lack of resources at the local level to understand and address climate change. Moreover, a quarter of city leaders regarded the lack of funding alternatives as hampering climate action.
Every respondent said that they were acting on climate change, and only one respondent identified local policy barriers as an obstacle to climate change mitigation.