02The geography of businesses and jobs in Britain
The concentration of businesses and employment varies across the country. Below we set out five findings about the nature of this variation.
1. The national economy is concentrated in cities, and particularly in city centres
Far from being evenly spread across the country, Britain’s 2.5 million private sector businesses and 21 million private sector jobs are located in very specific places. Figure 2 below looks at the share of land, jobs and businesses that our four areas account for.
Figure 2: Distribution of businesses and jobs across the four geographies, 2015

The chart shows that:
- Very little of the national economy is located in rural areas. As a whole, these areas accounted for 53 per cent of all land in Britain, but 13 per cent of businesses and 10 per cent of jobs in 2015.
- While 38 per cent of all land in Britain is accounted for by the hinterlands that surround cities, they are home to just over one third of businesses and 31 per cent of jobs.
- The suburbs of cities are home to the largest share of economic activity. They account for 9 per cent of land, but around 44 per cent of businesses and jobs.
- City centres see the greatest clustering of economic activity. Despite accounting for just 0.08 per cent of land, they were home to 8 per cent of businesses and 14 per cent of jobs in 2015. And despite their much smaller coverage of land, they had 40 per cent more jobs than the rural economy.
2. Britain’s service exporters tend to locate in cities, while goods exporters are more inclined to locate outside cities
There is also a difference in the types of businesses that are attracted to different areas.
To get a better understanding of this, we split businesses into three categories – goods exporters, service exporters and local services – all of which have different requirements when it comes to location. This categorisation is discussed in more detail in Box 2.
Box 2: Characteristics of goods exporters, services exporters and local services
Broadly there are three types of private sector business. The location requirements of these businesses look very different to one another.
Local services (also known as business to consumer (B2C) or ‘non-tradable’ businesses), such as hairdressers or newsagents, sell direct to the consumer, and so typically serve a very local market. Because of this their location decisions are decided predominantly by where their customers live, work, or trade from.
Exporting businesses (also known as business to business (B2B) or tradable businesses) sell to regional, national or international markets. They form the export base of the local economy. The markets these businesses sell to do not tie them to a specific location, and so long as they can easily access their target market, they are free to set up wherever they want. But given the different requirements of goods (e.g. car manufacturers) and services (e.g. computer programming) exporters, their location decisions are likely to look very different.
For this research we have defined exporters and local services firms using Standard Industrial Classification (SIC) codes. This means that we are not identifying actual exporters, but looking at businesses in sectors that have potential to sell to a market beyond their local area. A full list of how each sector has been allocated can be found in the Appendix.
Given that we are interested in the location decisions of the private sector, we do not look at where the public sector is located. We note however that higher education institutions have a role to play in exporting given the number of students from outside of their immediate area that they receive.
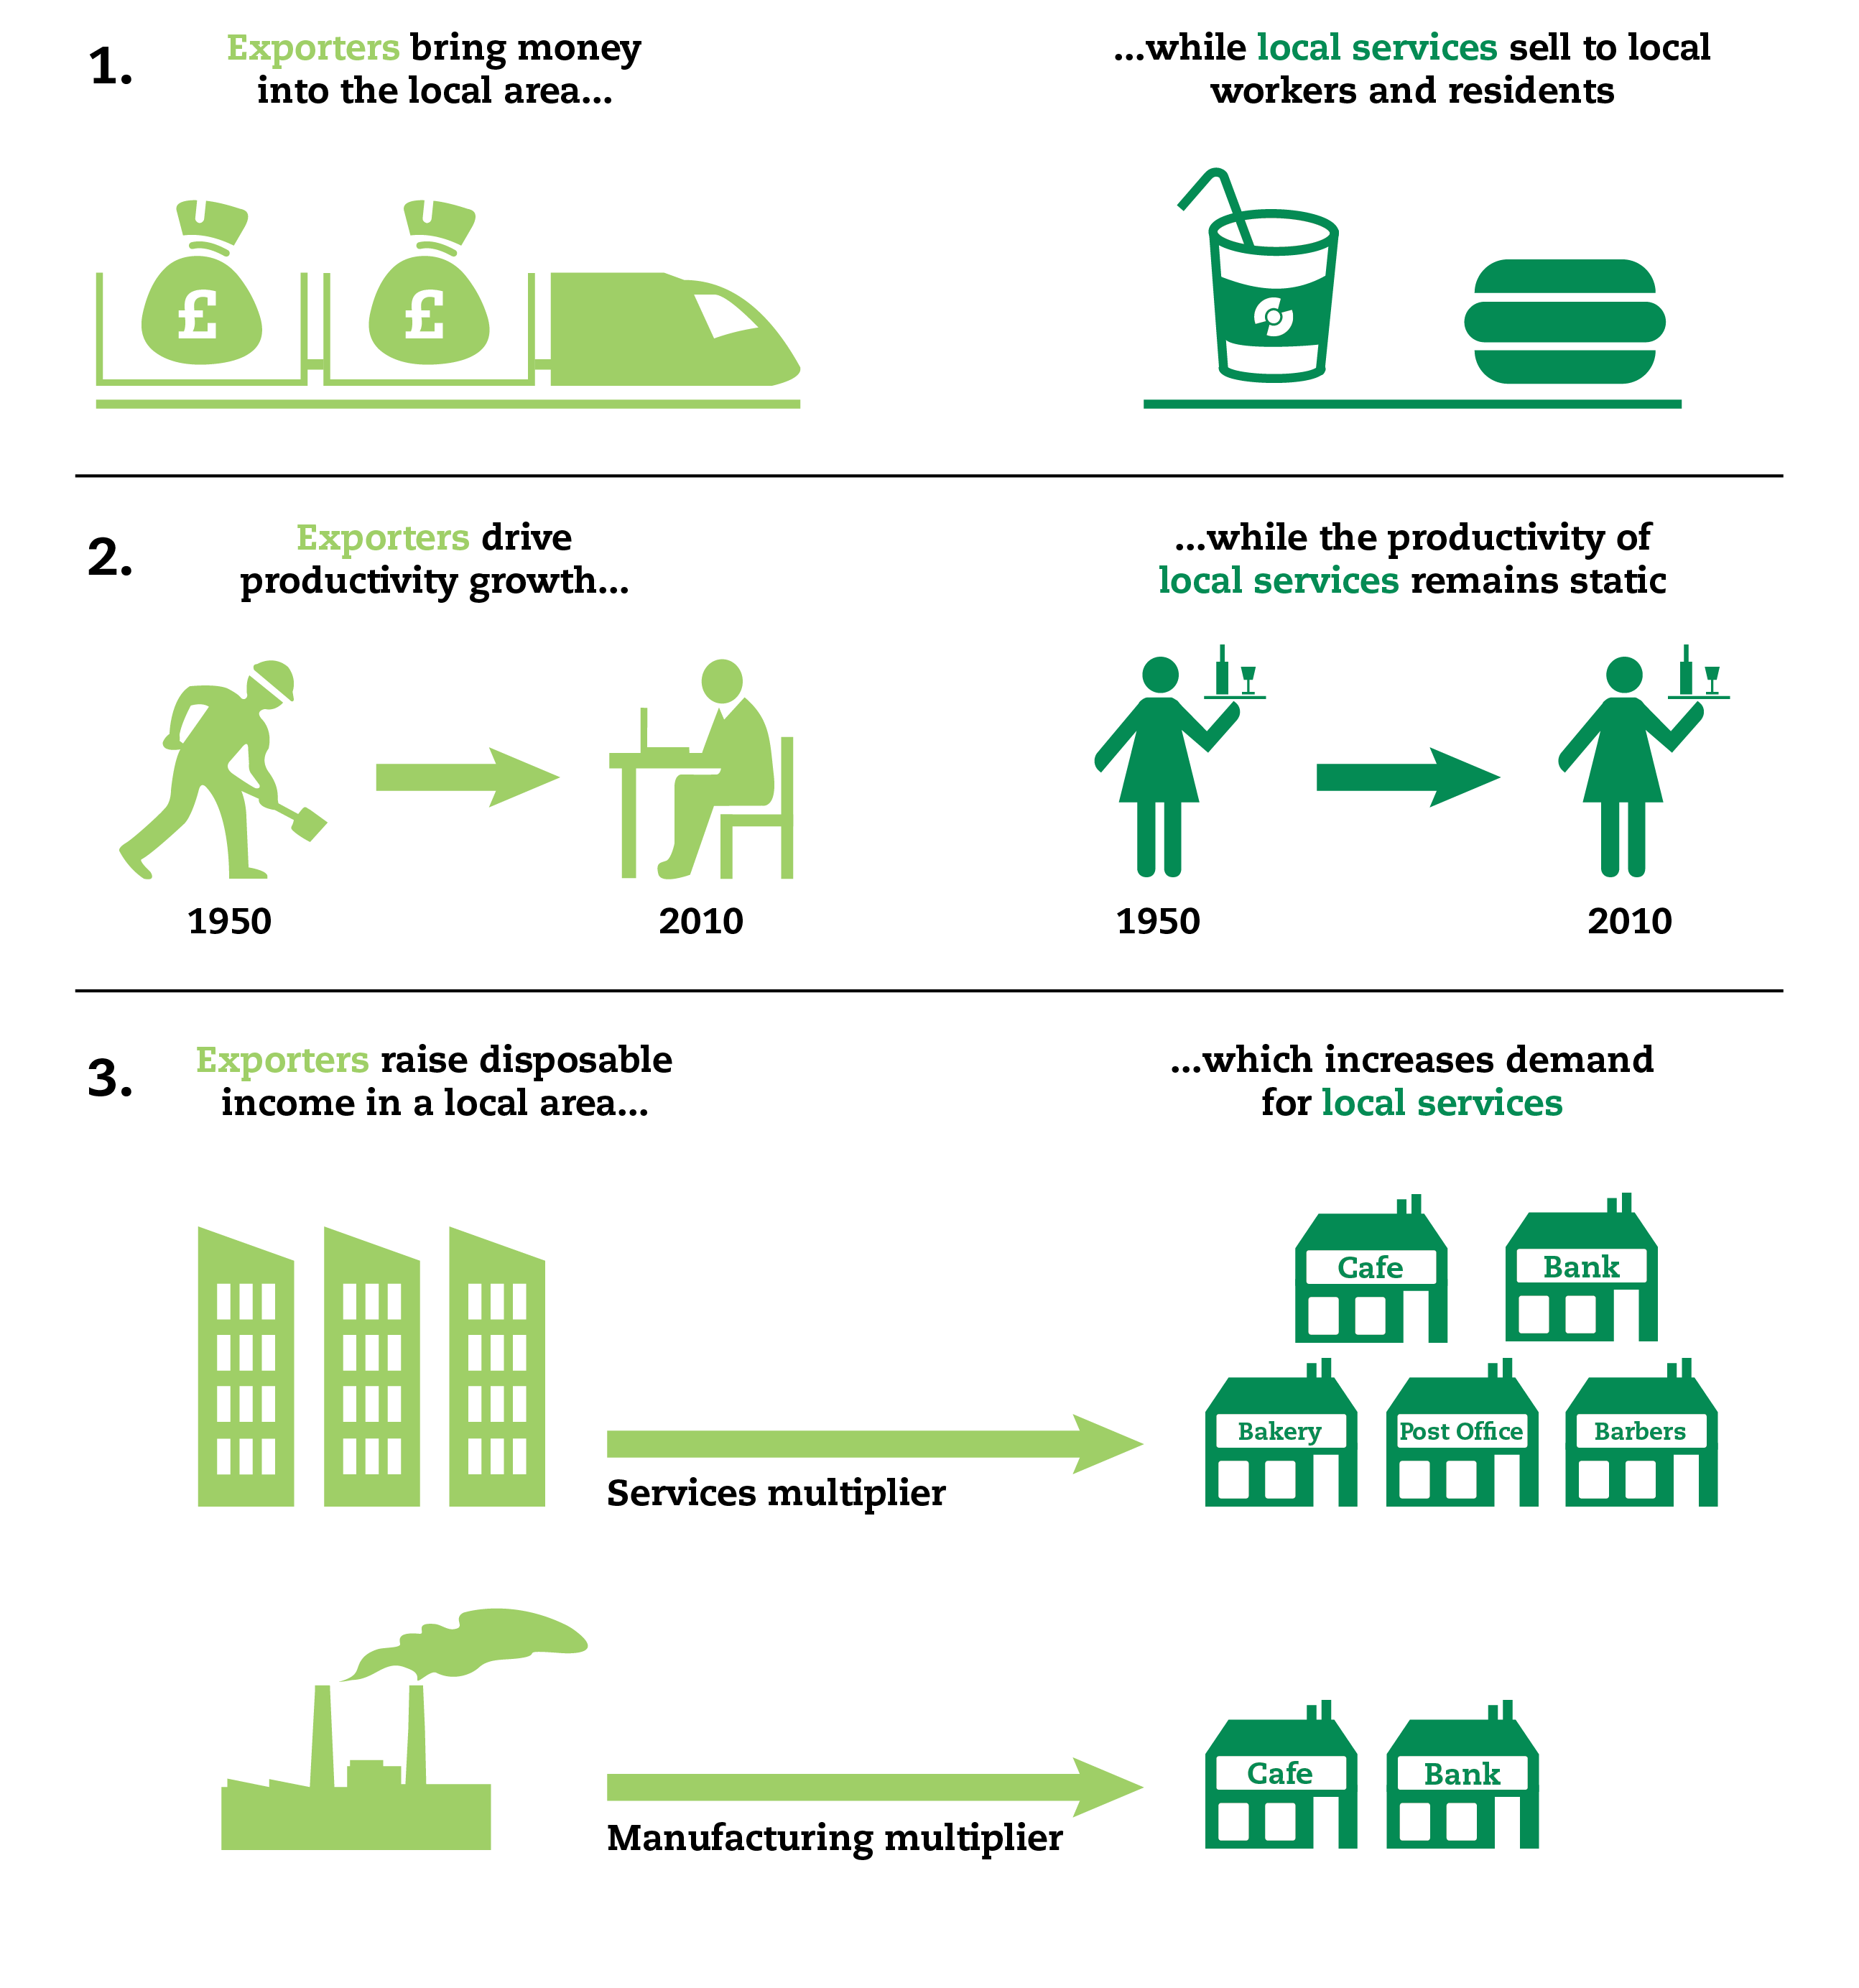
Why are exporters important?
Exporting businesses are important for three reasons. Firstly, because they receive their revenue from selling into markets at a regional, national or international scale, that they generate income independent of the performance of the local economy. 6
Secondly, they tend to be more productive than local services businesses. A study of American firms of all sizes found that value added per person in exporting firms in 2008 was around $120,000 per job, compared with $80,000 for local services firms.7 They also drive productivity growth, which drives long-run economic growth. For example, while a fitness instructor is as productive as he or she would have been 50 years ago, someone working in a car factory is now many times more productive than half a century earlier, while computers have vastly increased the value of work that someone working in cinema special effects, for example, can do in a day.8
Thirdly, exporting businesses also have a multiplier effect on jobs in local services. The better they perform, the higher local disposable income there is, and the higher the demand for goods and services provided by local services businesses such as shops and restaurants.
Enrico Moretti found that this multiplier varied according to the type of exporting business. He estimated that every extra traditional manufacturing job generated 1.6 extra local services jobs in US cities. But for the hi-tech exporting sector he found the ratio to be as high as five to one – for every one job created in the hi-tech exporting sector, five are created in the local services sector, both in high and low-skilled occupations.8
The graphic below summarises the three reasons why exporting businesses are important to the local economy:
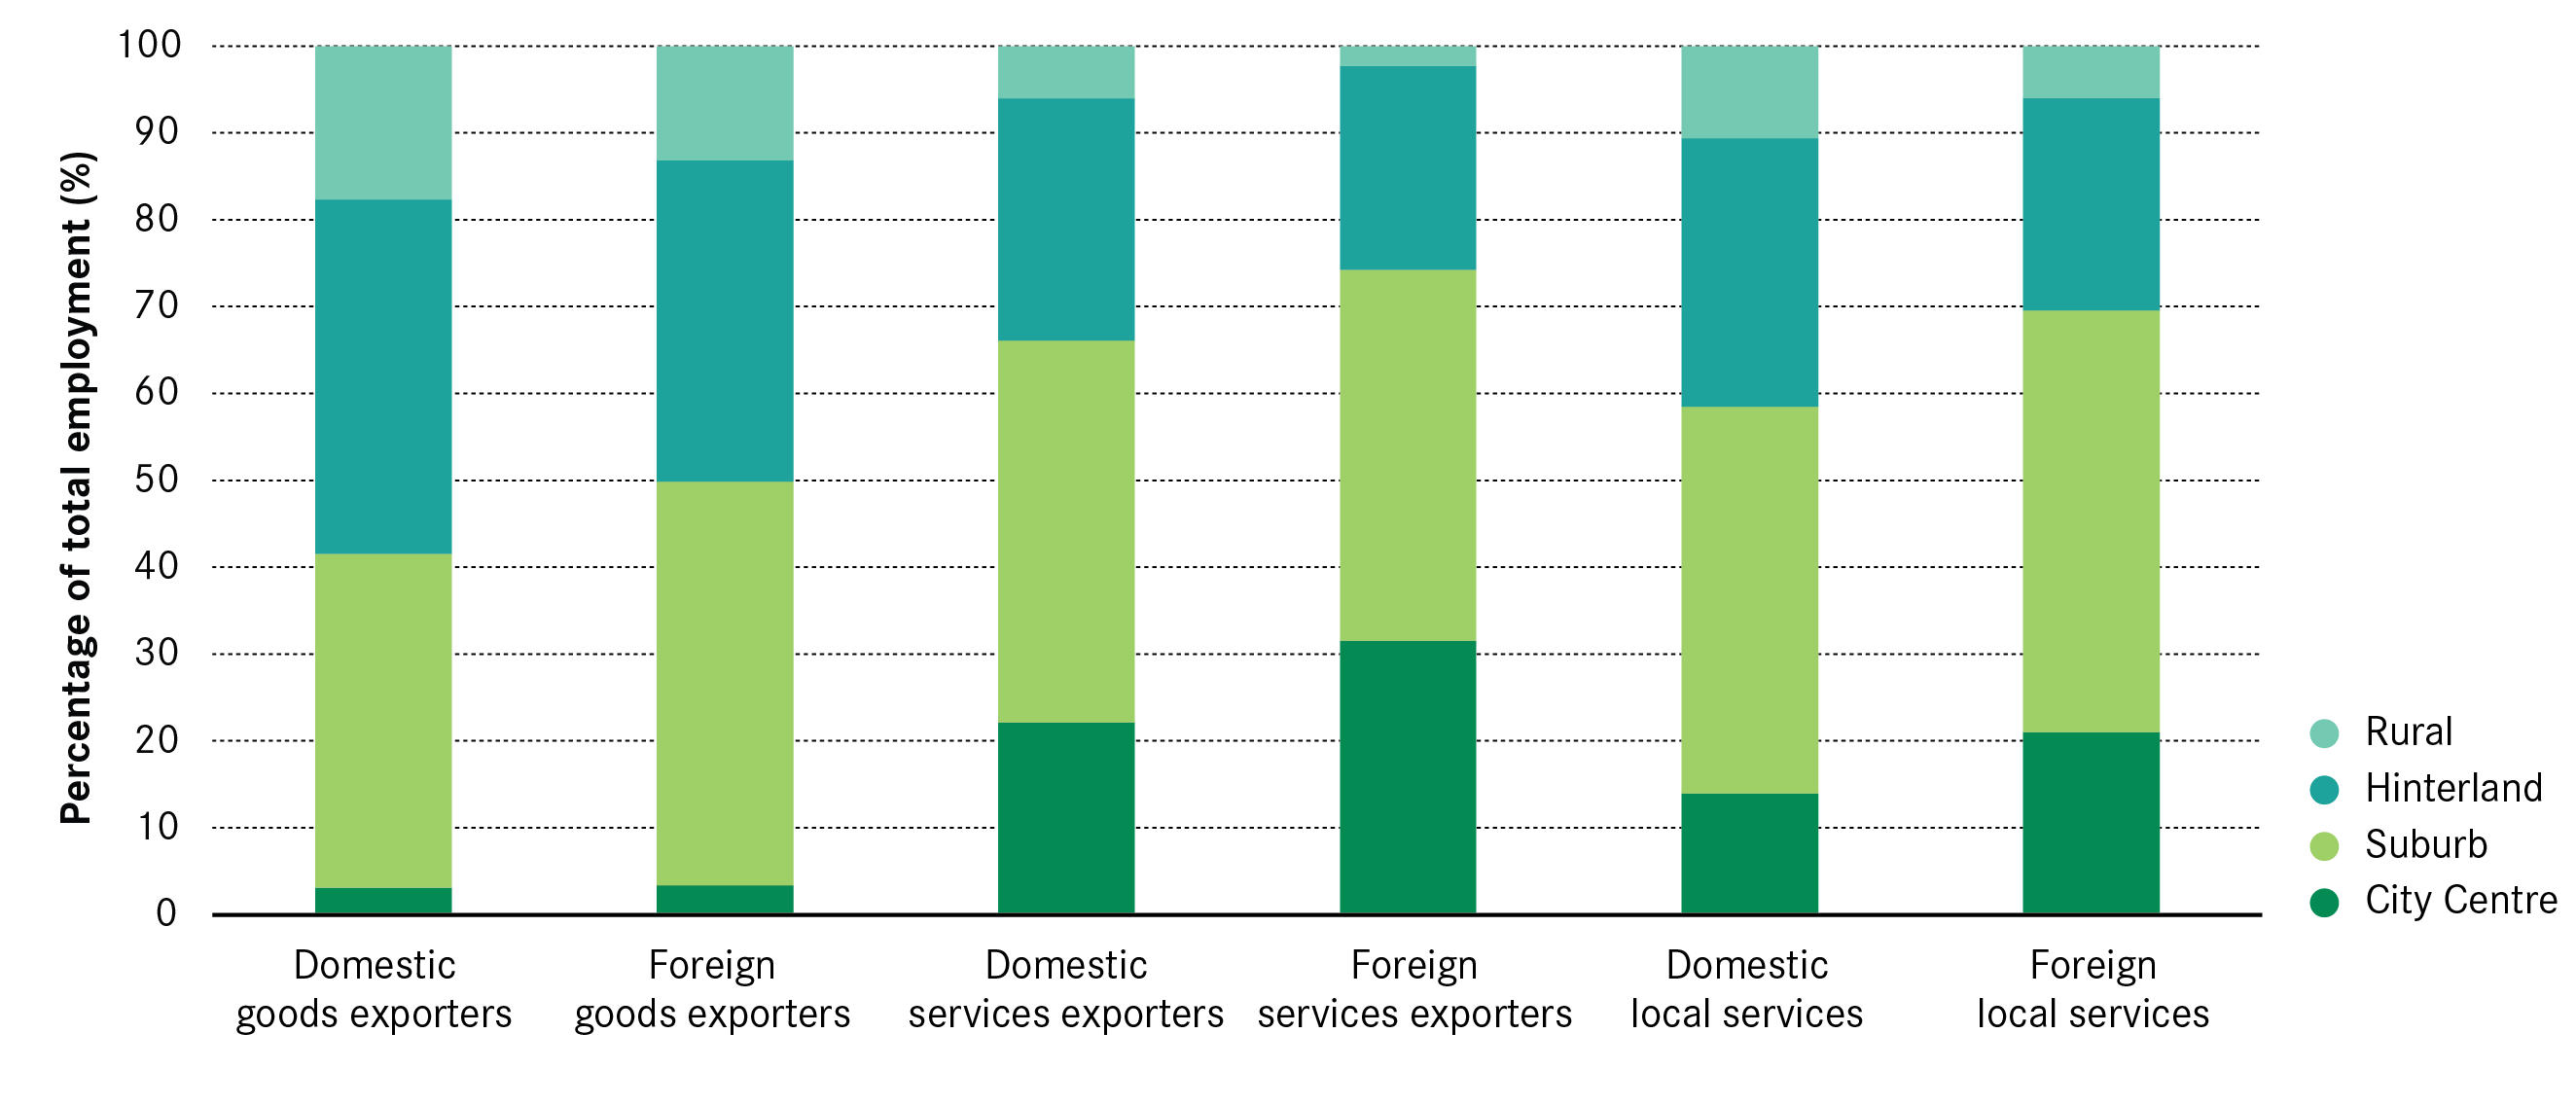
Although exporting firms are in principle free to locate anywhere they can serve national and international markets, Figure 3 shows clear distinctions as to where they actually locate. In 2015, services-exporting businesses were most likely to be in cities, and city centres in particular. In total, 61 per cent of these businesses were located in cities, of which 11 per cent were in city centres alone, despite the tiny area of land they account for. Employment was even more concentrated, with 25 per cent of all jobs in this sector located in city centres, and 69 per cent located in cities as a whole.
Figure 3: Where businesses in different sectors choose to locate, 2015


This meant that the total number of services exporters in city centres was higher than in rural areas (and jobs in service exporters was over five times higher), despite the radically different amount of land that they account for.
The location patterns of goods-exporting businesses were very different. Almost 70 per cent of these businesses were based outside of cities, with 44 per cent in hinterlands (compared to 35 per cent of all businesses).
The location of local services businesses, on the other hand, matches much more closely to overall patterns of businesses and employment. This suggests that the location decisions of these businesses is driven by the access to markets that locations give them.10 As Box 3 shows, similar patterns are seen for the public sector as well.
Box 3: The location of the public sector across the four geographies, 2015
As is the case for local services, the location of public sector jobs broadly matches the location of all private sector jobs. The only difference is the balance between city centres and suburbs within cities, with a higher share of jobs in suburban areas.

Taken together, these trends mean that the industrial structure of the four areas looks very different, as shown in Figure 4.
Figure 4: The industrial profile of the four geographies, 2015


In city centres, the export base is dominated by services. The role that services exporters play declines when moving out from the centre of cities through suburbs and hinterlands to the rural economy, while the role that goods exporting plays grows larger. This meant that out of the four areas the rural economy was most dependent on the fortunes of goods exporters in 2015.
Box 4 looks at the differences in economic structure of different parts of Manchester, its hinterland and the surrounding rural economy.
Box 4: Differences between cities and rural areas: case study of Manchester and beyond
Reflecting the aggregate results for the four different areas, different parts of Manchester, its hinterland and its associated rural area have very different economic structures.
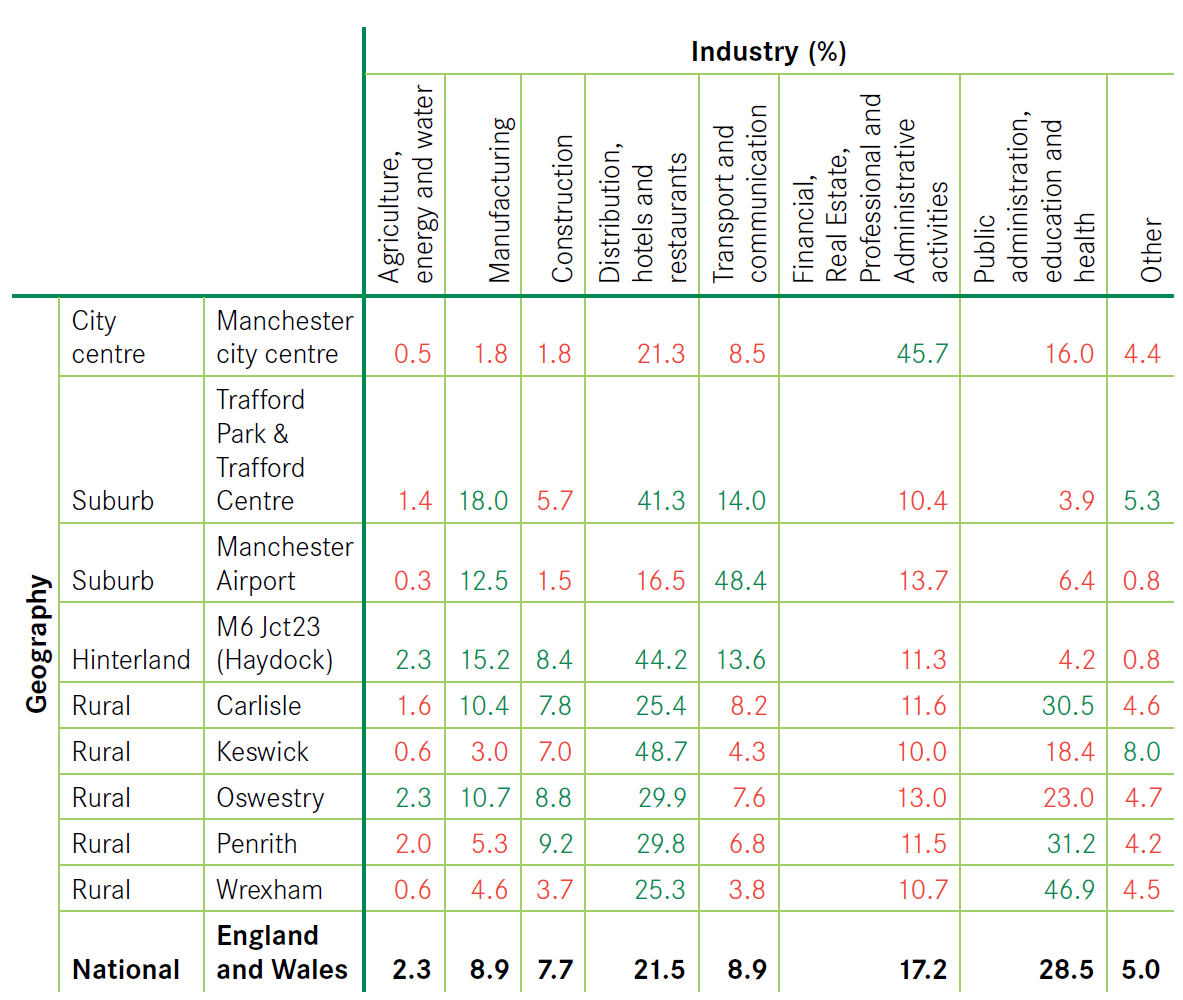
Source: NOMIS (2016), Census 2011. Colours denote whether the share of industry is above or below the average for England and Wales.
The above table shows that:
- Manchester city centre has a very high share of financial, real estate, professional and administrative activities (46 per cent) – much higher than other areas of the country.
- In Trafford Park and the Trafford Centre – located in Manchester’s suburbs – activities are predominantly in distribution, hotels and restaurants (41 per cent).
- Manchester Airport, as expected, has a very high share of activities in transport and communication (48 per cent).
- Around Junction 23 of M6 motorway, in Manchester’s hinterland, the major industries include distribution, hotels and restaurants (44 per cent).
But the rural economy within proximity of Manchester is very different. Compared to the average for England and Wales, the share of financial, real estate, professional and administrative activities is low (around 10 per cent). Rural areas, in general, are much more reliant on jobs in distribution, hospitality, leisure, recreation and tourism. And the share of the workplace population employed in the public sector is higher than in cities.
The differences across cities and rural areas also play out in the occupational structure.
Manchester city centre, for example, had a higher proportion of high-skilled occupations, accounting for half of all jobs in 2015. But in Trafford Park and Trafford Centre, one in two jobs were in low-skilled occupations. In Manchester Airport, most jobs required medium skills (35 per cent) but there was also a significant proportion of high skilled (30 per cent) and low-skilled occupations (34 per cent). And around junction 23 of the M6 motorway, the majority of occupations were low skilled (57 per cent).
In the rural areas, the share of high-skilled occupations was generally lower than the national average for England and Wales (41 per cent). In Oswestry, only 31 per cent of the workplace population worked in a high-skilled job in 2015.
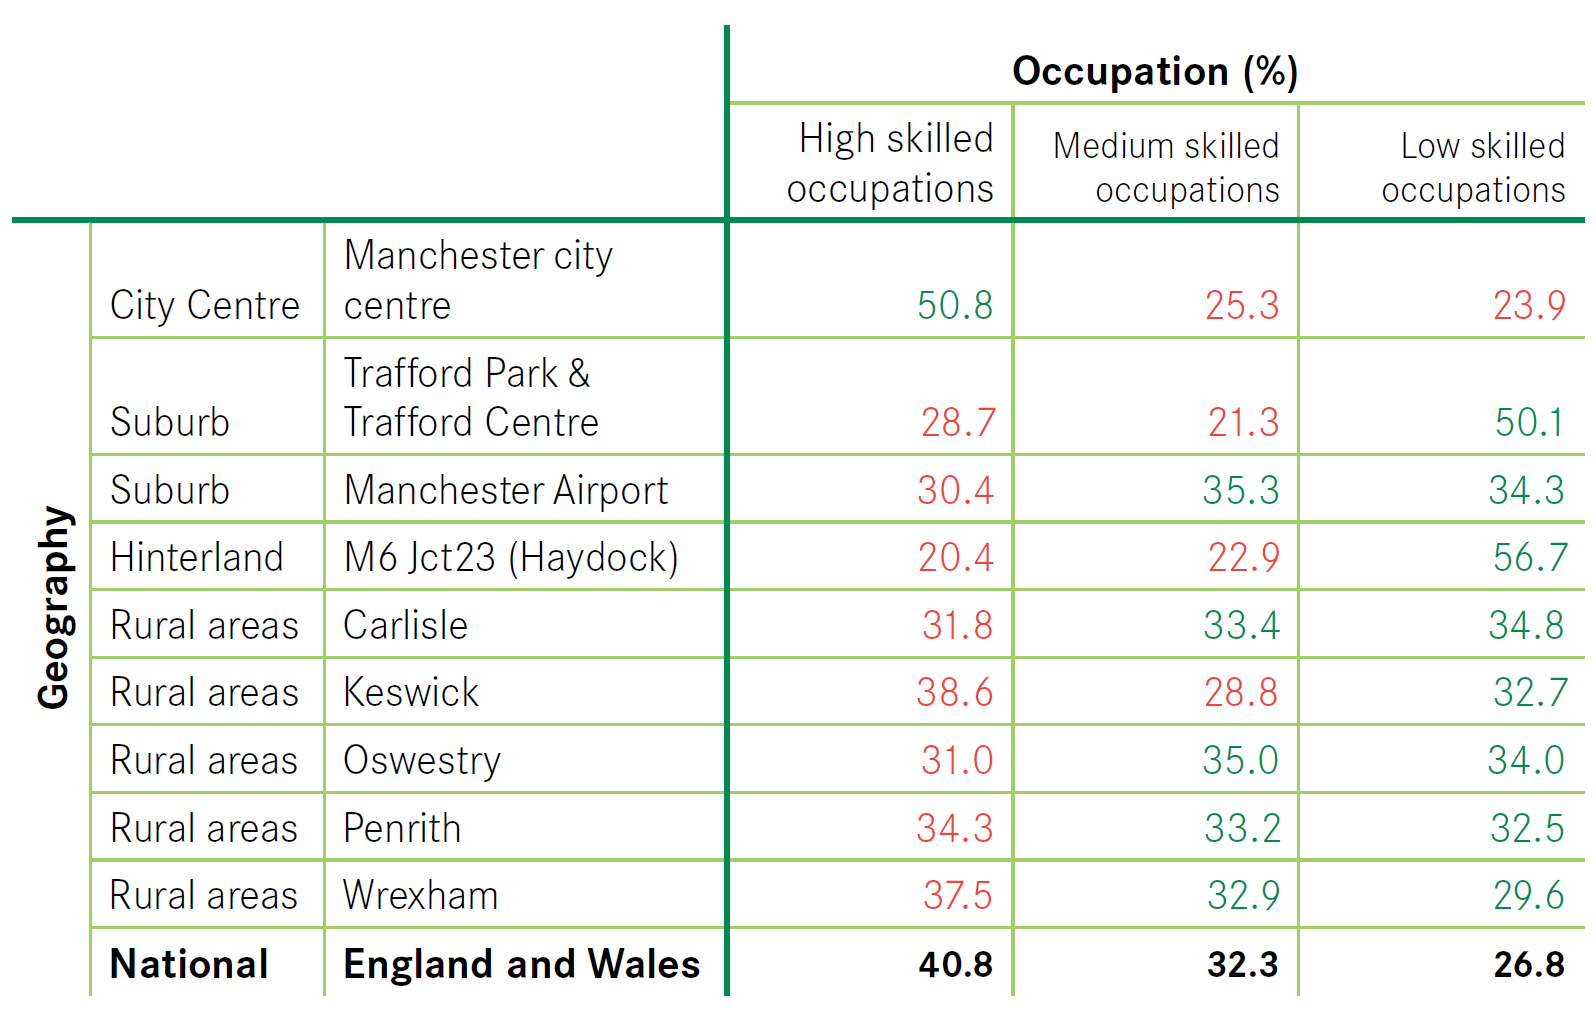
Source: NOMIS (2016), Census 2011. Colours denote whether the share of jobs is above or below the average for England and Wales. High skilled is defined as the SOC codes: 1. Managers, directors and senior officials; 2. Professional occupations; 3. Associate professional and technical occupations. Medium skilled is defined as the SOC codes: 4. Administrative and secretarial occupations; 5. Skilled trades occupations; 6. Caring, leisure and other service occupations. Low skilled is defined as the SOC codes: 7. Sales and customer service occupations; 8. Process, plant and machine operatives; 9. Elementary occupations.
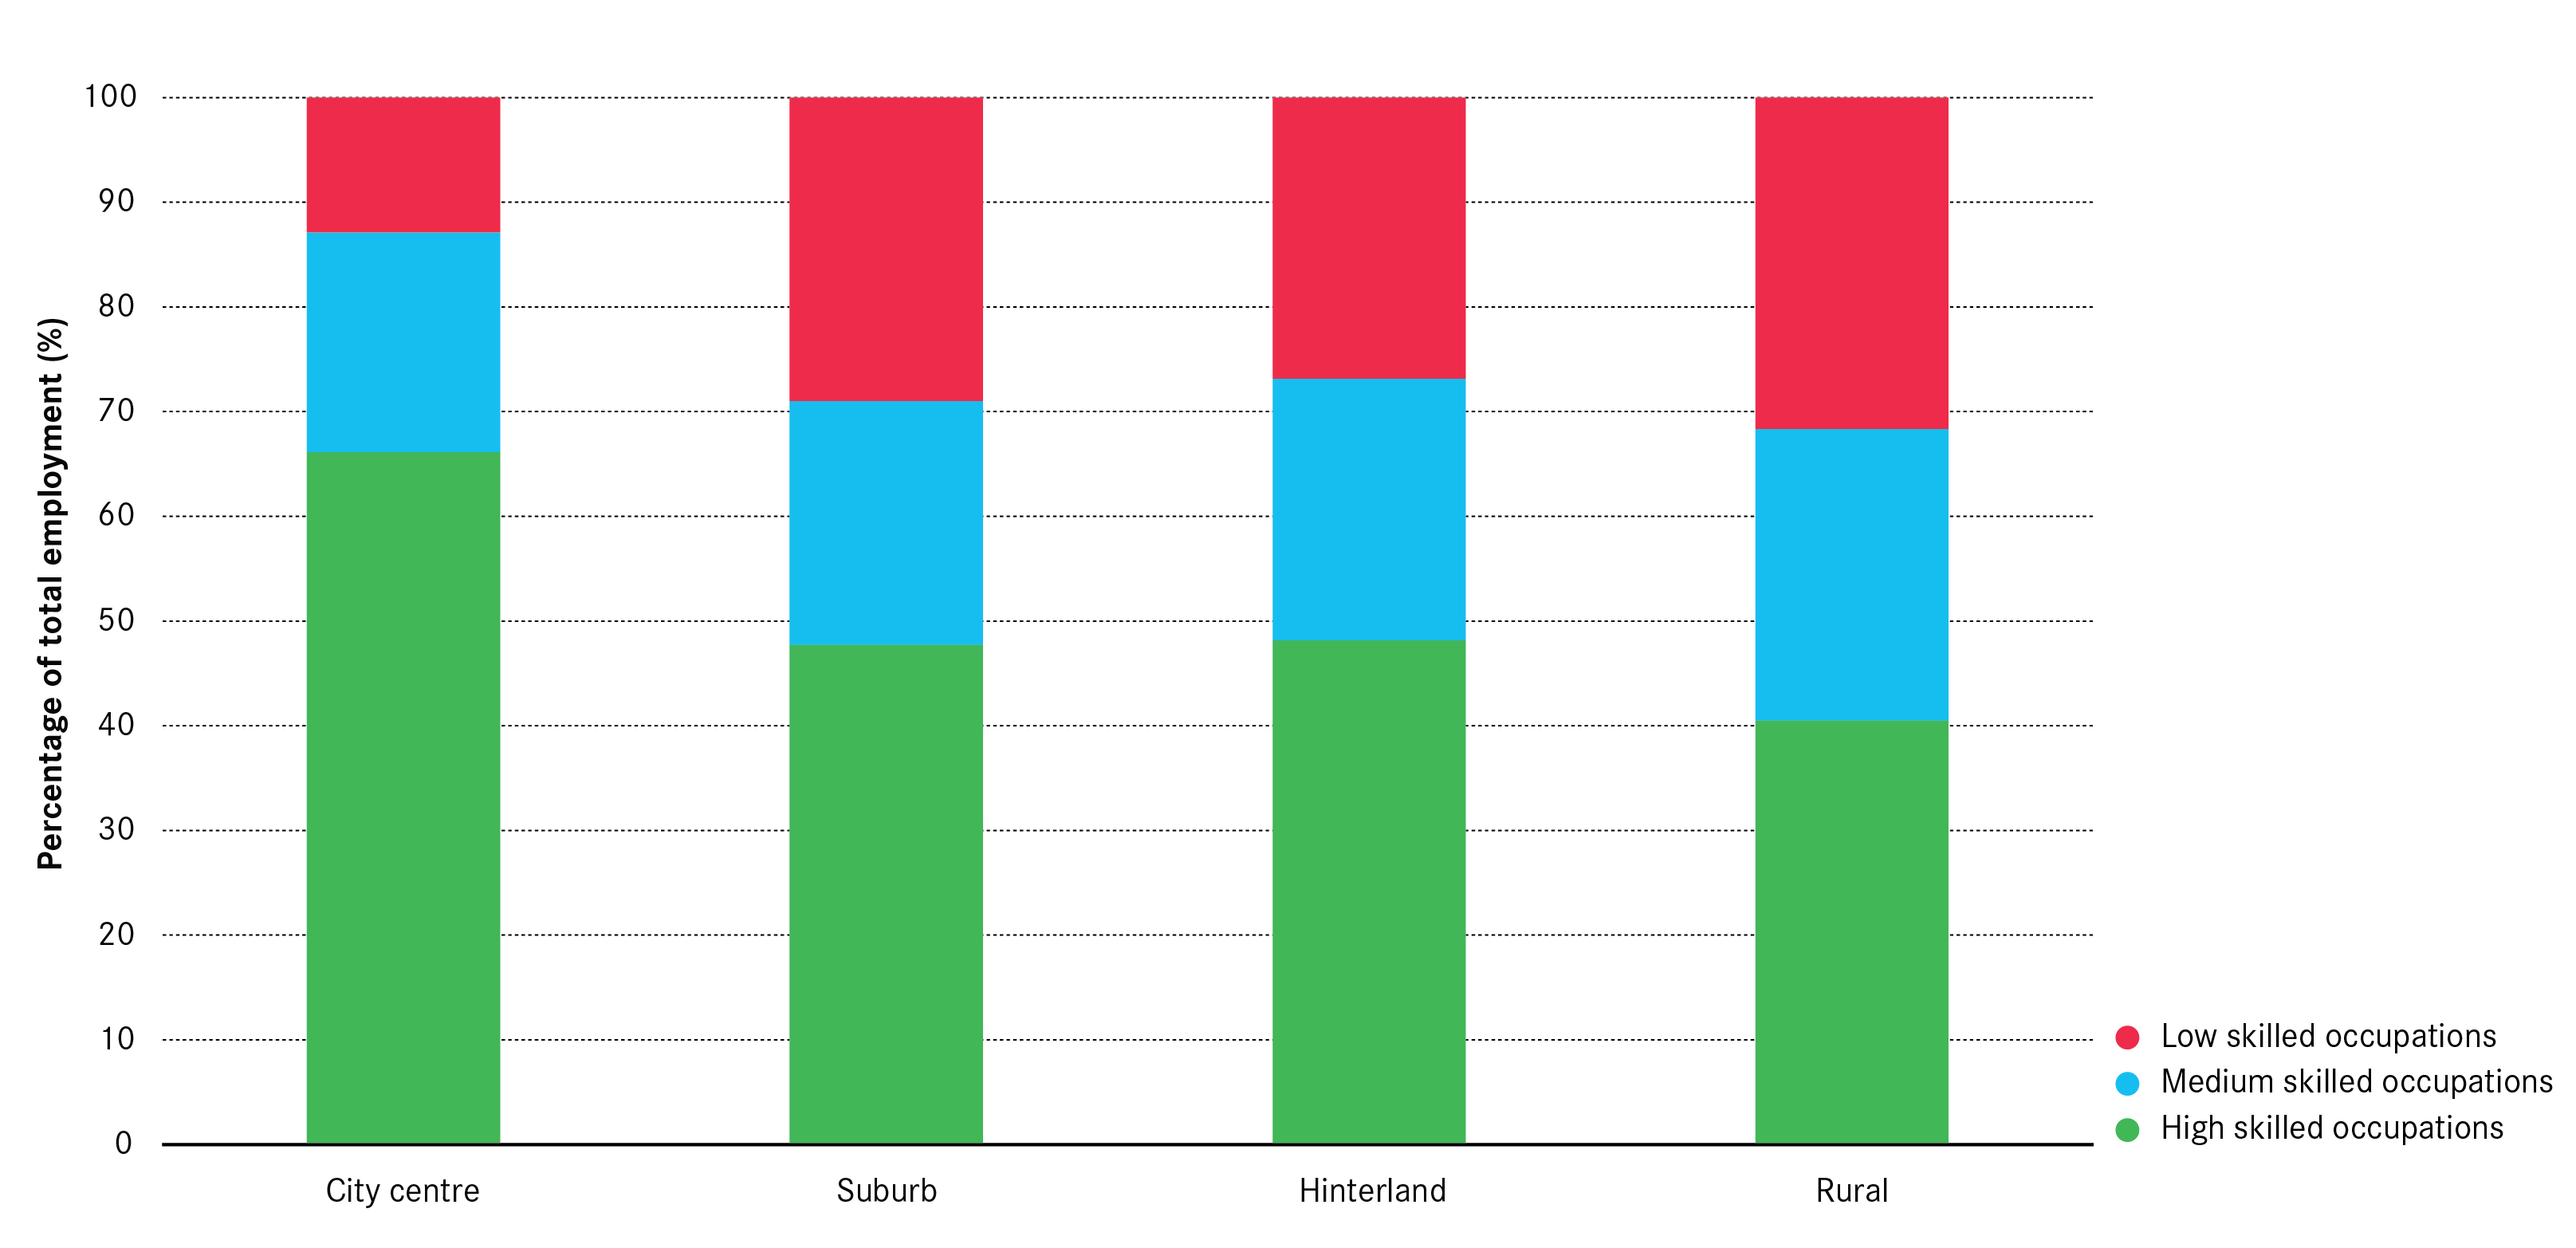
3. Service-exporting jobs in city centres tend to be more highly skilled
Jobs in service-exporting businesses include both low and high skilled positions, ranging from call centre operatives through to software engineers. Census data allows us to get a better understanding about the locational preferences of lower and higher skilled jobs within services exporters. As Figure 5 shows, service exporting jobs in city centres tended to be much more highly skilled than elsewhere in 2011, with two thirds being in a high-skilled occupation. There was little difference between suburbs and hinterlands, but the rural economy tended to have a higher share of lower skilled jobs in its services-exporting sector.
Assuming these proportions held in 2015, this would mean that that 32 per cent of all of Britain’s high-skilled jobs in service exports were located in city centres that year.
Figure 5: Occupational profile of jobs in service exporters across the four geographies, 2011
The pattern for goods-exporting jobs is similar (see Figure 6). The large number of high-skilled jobs in city centres for goods exporters may reflect that some manufacturers locate their head offices and office-based functions in city centres, rather than at their production facilities. Once again, the rural economy tends to have a smaller share of high-skilled jobs than the other areas.
Figure 6: Occupational profile of jobs in goods exporters across the four geographies, 2011

4. City centre businesses tend to be larger than in other areas
Businesses in city centres were on average larger than in other areas in 2015, and were smallest in the rural economy. As Figure 7 shows, these differences were most pronounced for service exporters. In the city centre, the average service-exporting firm had 20 jobs. In the suburbs it was eight jobs, while it was seven jobs in the hinterland and six jobs in the rural economy. Similar patterns were seen for local services businesses too.11
Figure 7: Average firm size across four geographies, 2015

Goods-exporting businesses did not follow this pattern. Goods exporters were largest in the suburbs, closely followed by those in city centres. Meanwhile the rural economy tended to have much smaller businesses in terms of employment.
5. Foreign firms are even more likely to choose a city centre location
While the home of the owner or a historic legacy may explain the location decisions of some domestic businesses, this is much less likely to be the case for foreign-owned businesses. So it is interesting to see that their location decisions emphasise the patterns seen for businesses as a whole.
Foreign-owned services exporters were overwhelmingly more likely to choose a city centre location. As Figure 8 shows, whereas 11 per cent of all businesses in this sector were in a city centre in 2015, this figure was 30 per cent for foreign-owned businesses (and 70 per cent were in cities overall). Meanwhile they were less well represented across the other three geographies, with just 5 per cent of them based in the rural economy, employing 2 per cent of employees in this sector.
In terms of goods exporters, foreign firms have shown a greater preference for suburbs over hinterlands relative to domestic businesses. And very few have invested in the rural economy – whereas 25 per cent of all businesses in this sector were based in a rural area, for foreign-owned businesses the share was equal to 14 per cent (noting that this distinction was smaller for employment).
Figure 8: Distribution of domestic and foreign businesses and jobs across four geographies, 2015