
02The nature of migration between Manchester and the rest of England and Wales
This section combines data on migration within the UK from the ONS and the 2011 Census to look at migration to and from Manchester by age and qualification. This data does not include international migration.
Manchester loses people to the rest of the North West
Between 2009 and 2017, 436,440 people moved into Manchester from elsewhere in England and Wales and 568,060 moved out, leading to a net outflow of 31,620 people from the city. This was the third largest net outflow from any English or Welsh city during the period. In comparison, London experienced a greater net outflow of 340,310 people while Bournemouth saw a net inflow of 15,090 people moving into the city.
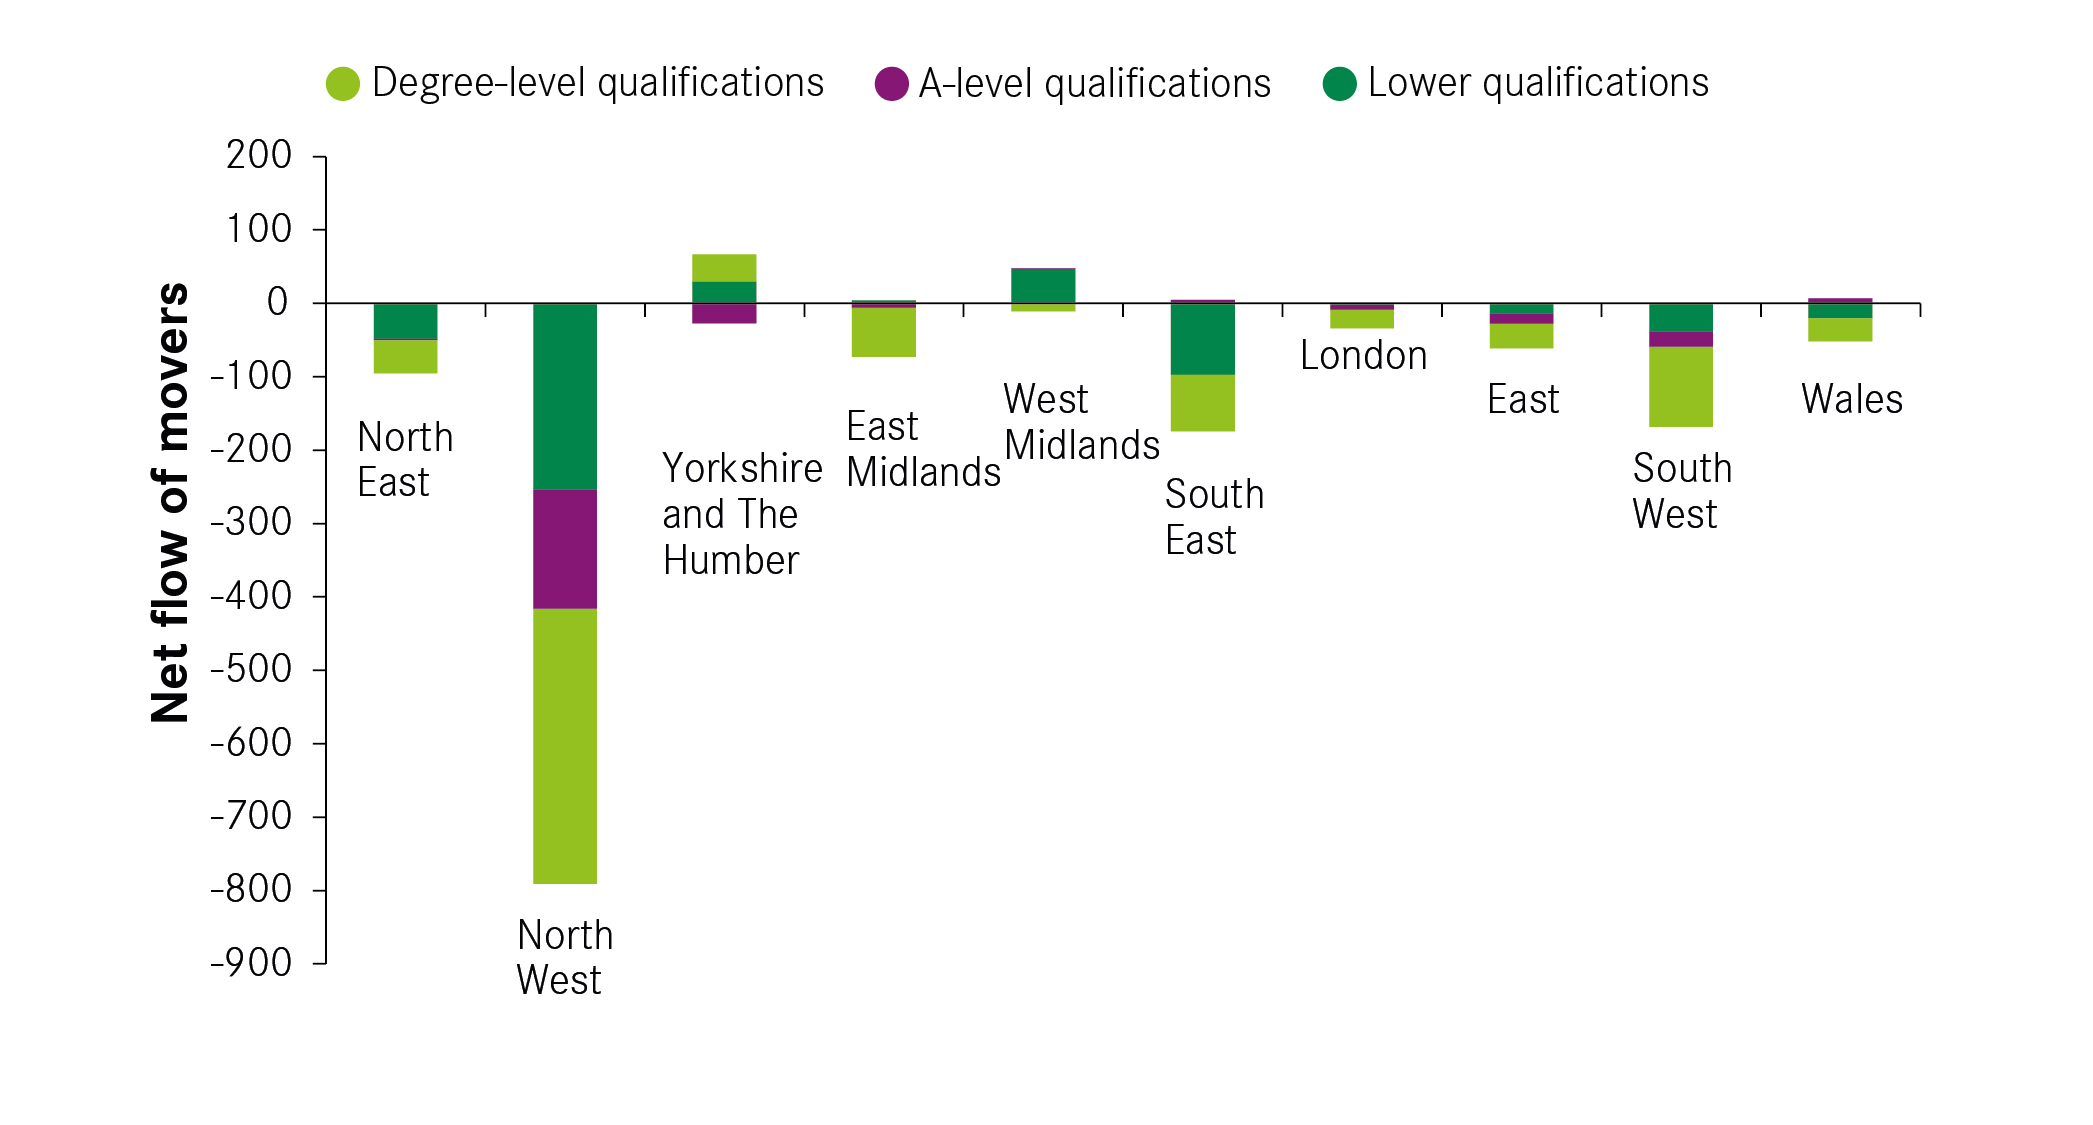
3Much of this migration was between Manchester and other parts of the North West. A third of those moving into Manchester came from elsewhere in the region, and a third of those leaving the city stayed within the North West. This resulted in an overall net outflow of 29,200 people to the region, as shown in Figure 1. There were also considerable net outflows from Manchester to London and the South West, 6,220 and 3,740 respectively. On the other hand, the city experienced net inflows from the North East, West Midlands, Yorkshire, South East and East, but these were small.
Figure 1: Net regional migration into Manchester, 2009-2017

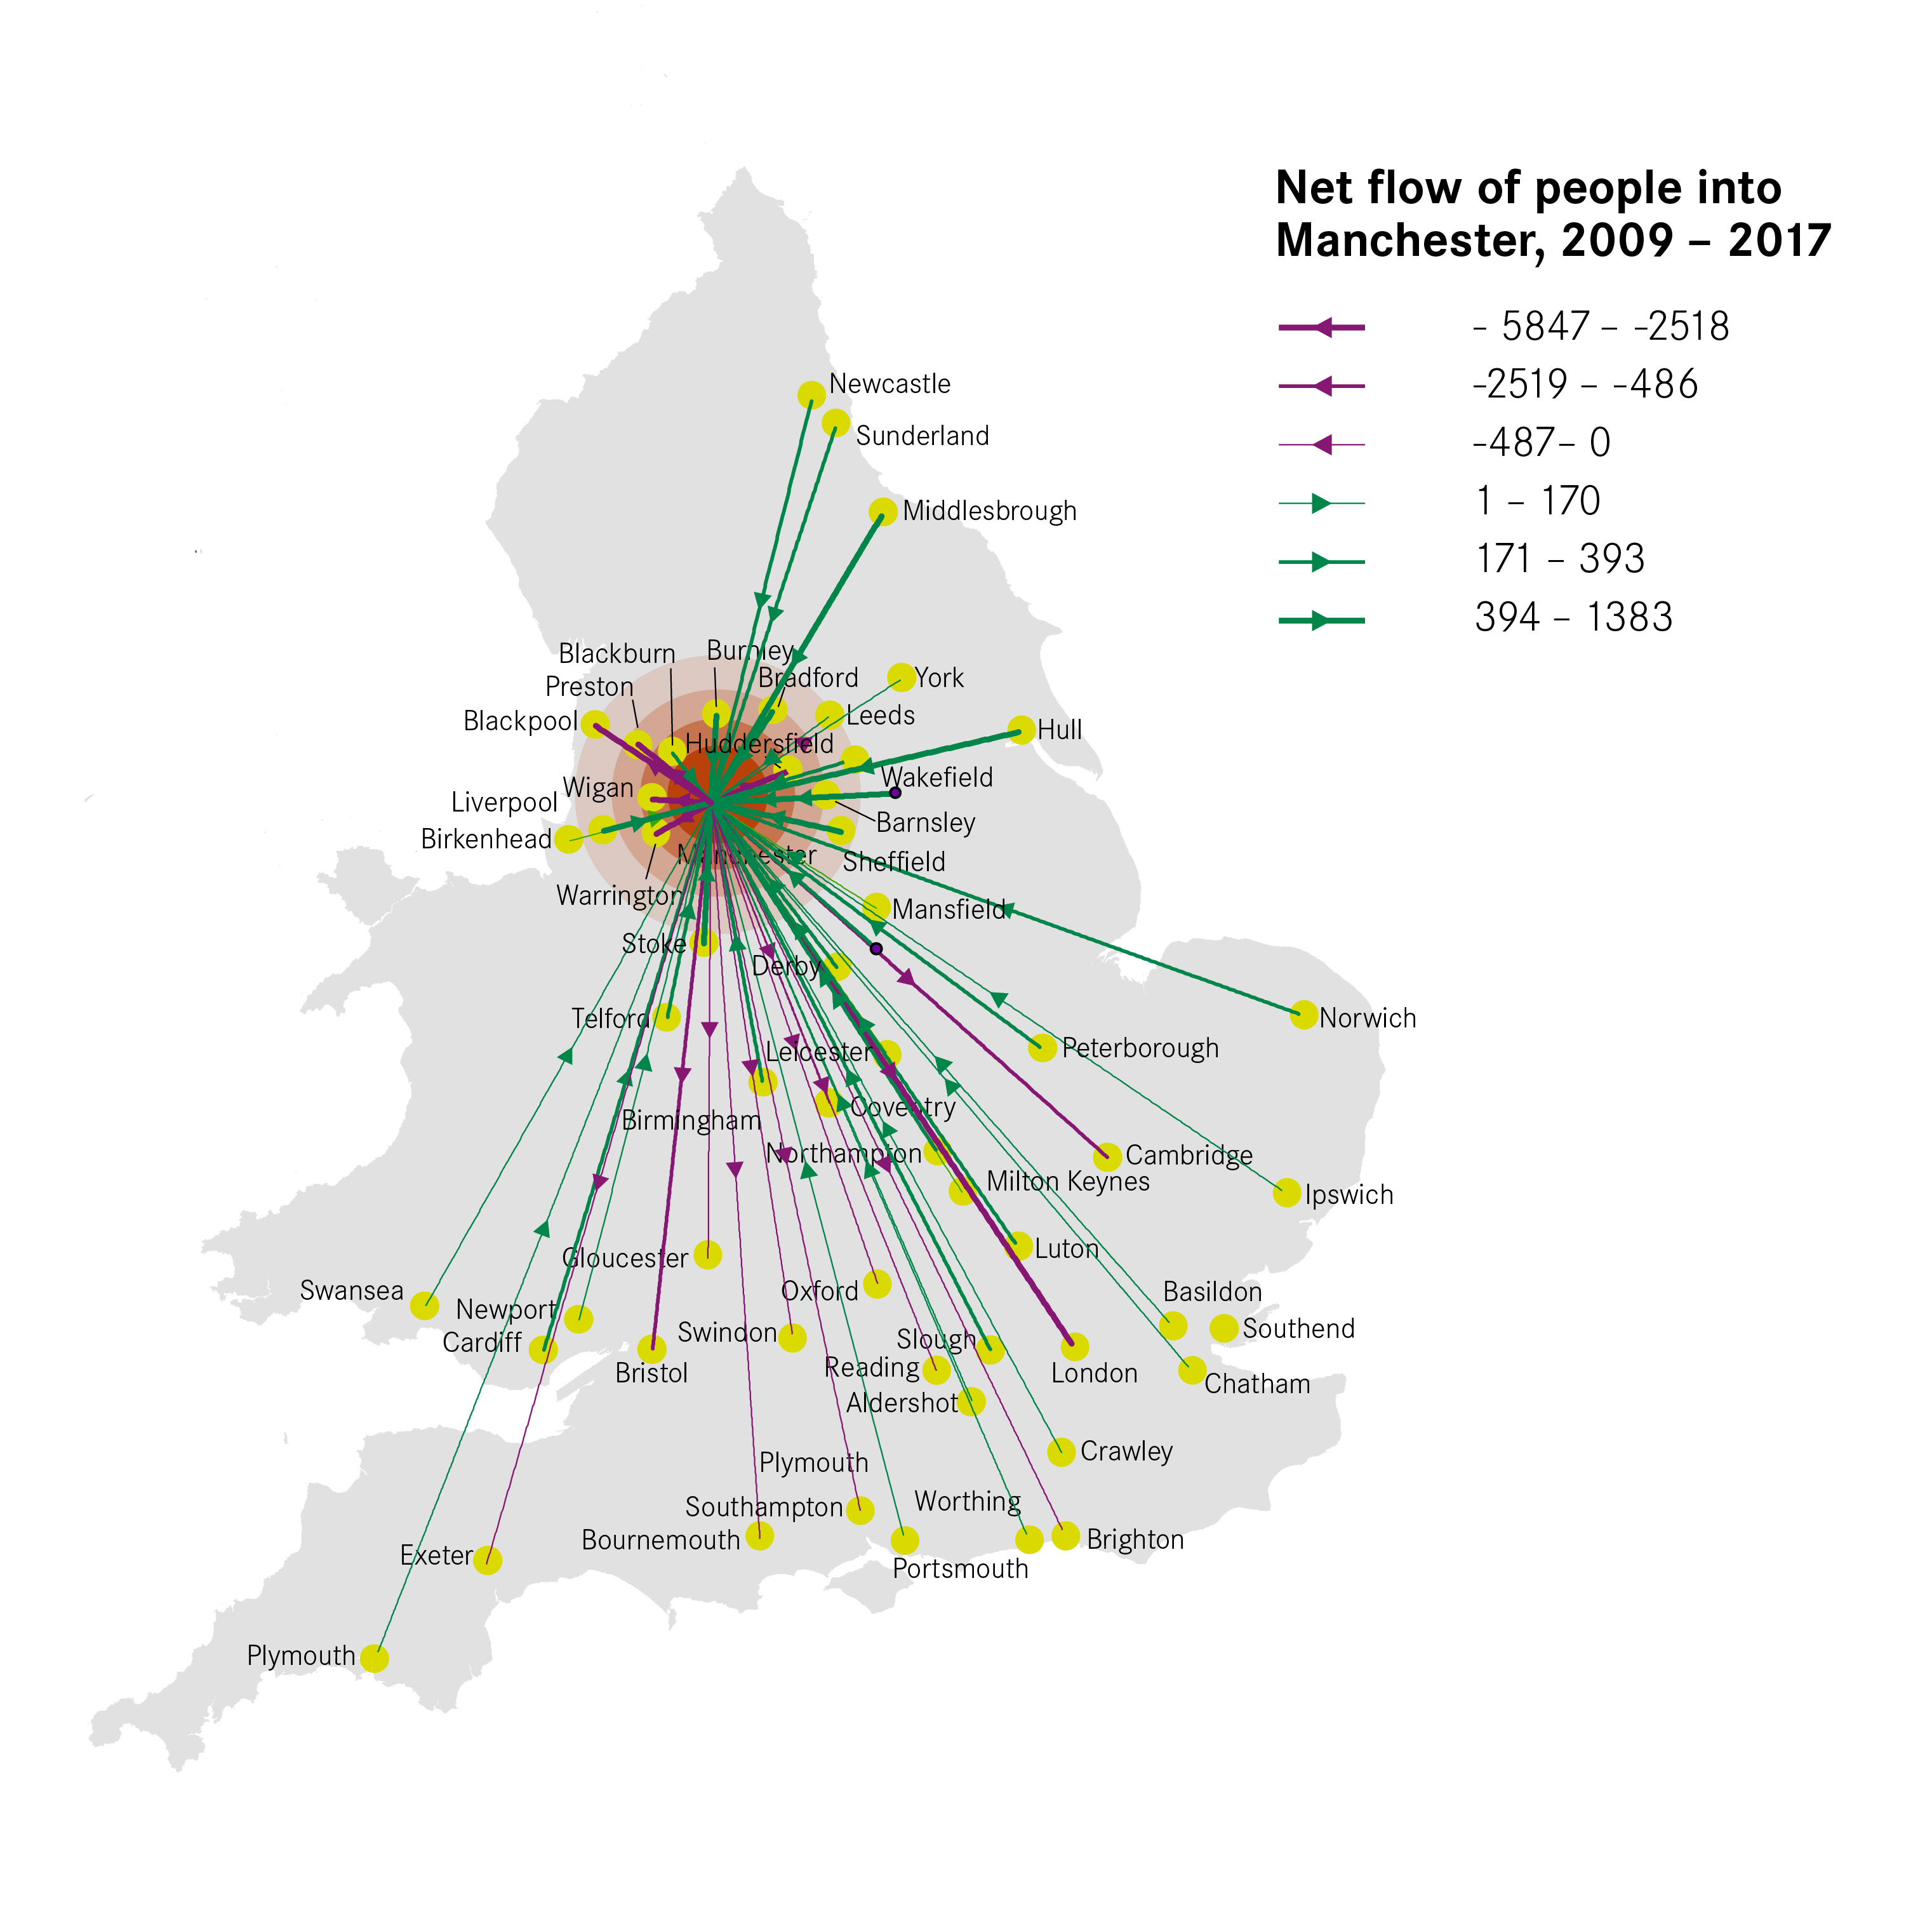
Looking specifically at cities, the greatest net outflow from Manchester was 5,850 people moving to London, as shown in Figure 2. The largest net inflows to the city were from Liverpool and Burnley, equivalent to 1,380 and 1,370 people respectively.
Figure 2: Net flow of people from UK cities into Manchester, 2009-2017
Manchester gains young people and loses older people
The pattern of migration varies significantly by age, with the movement of young people dominating flows, as Figure 3 shows. Those aged 16 to 21 accounted for a quarter of inward migration to Manchester and a fifth of outward migration, despite only representing 8 per cent of the city’s population. The 22-to-25 age group also contributed significantly to migration flows, although accounting for only 6 per cent of the population. In contrast, older residents were much less mobile. Those aged 46 to 64 only made up 7 per cent of inward and 10 per cent of outward migration despite being 23 per cent of the city’s population.
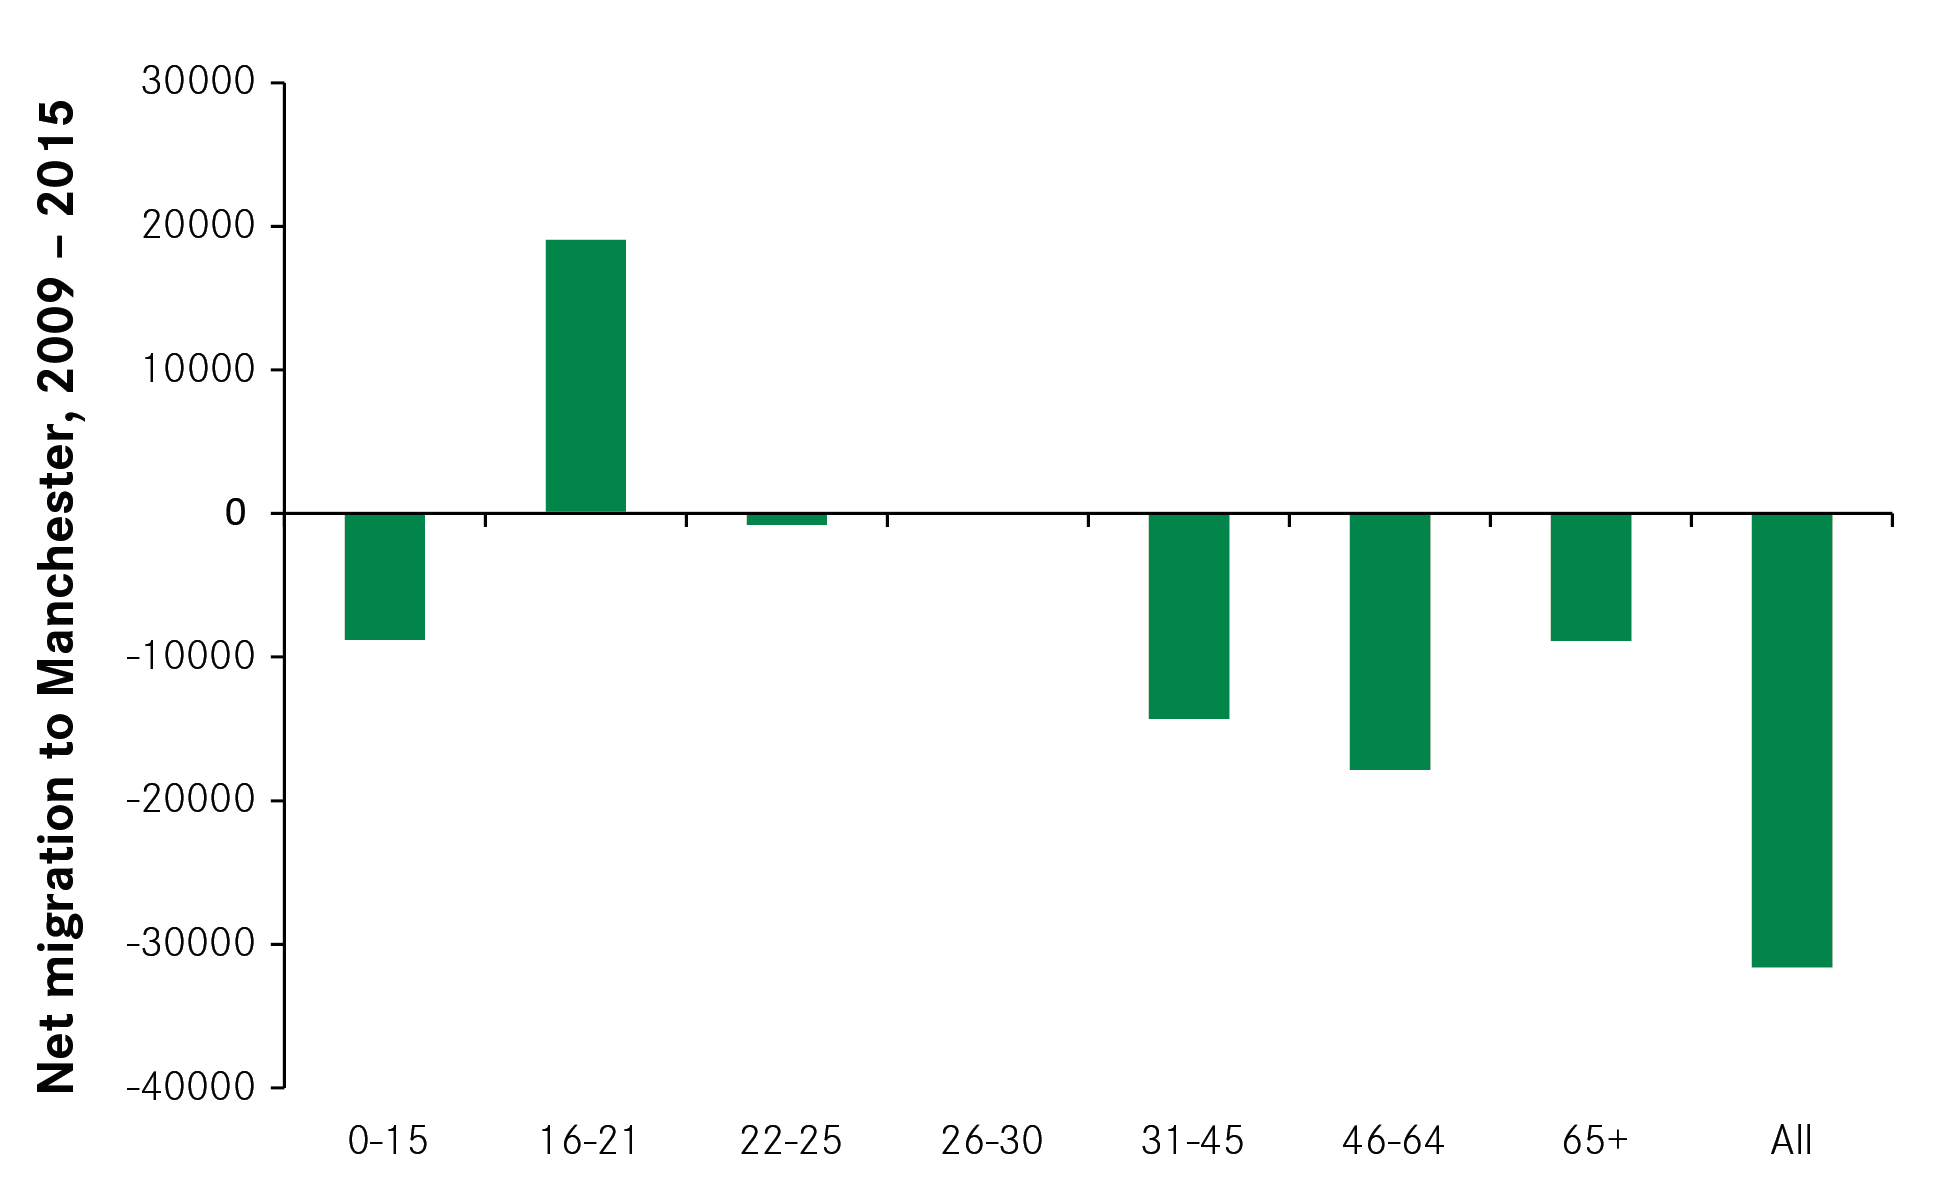
Overall, the city gained 19,050 16-to 21-year-olds between 2009 and 2017 (see Figure 4). For all other age groups, the city saw a net outflow. The most significant were 14,310 lost 31-to 45-year-olds and 17,840 lost 46-to 64-year-olds.
Figure 3: Contribution of each age group to migration and to the city’s population, 2009-2017
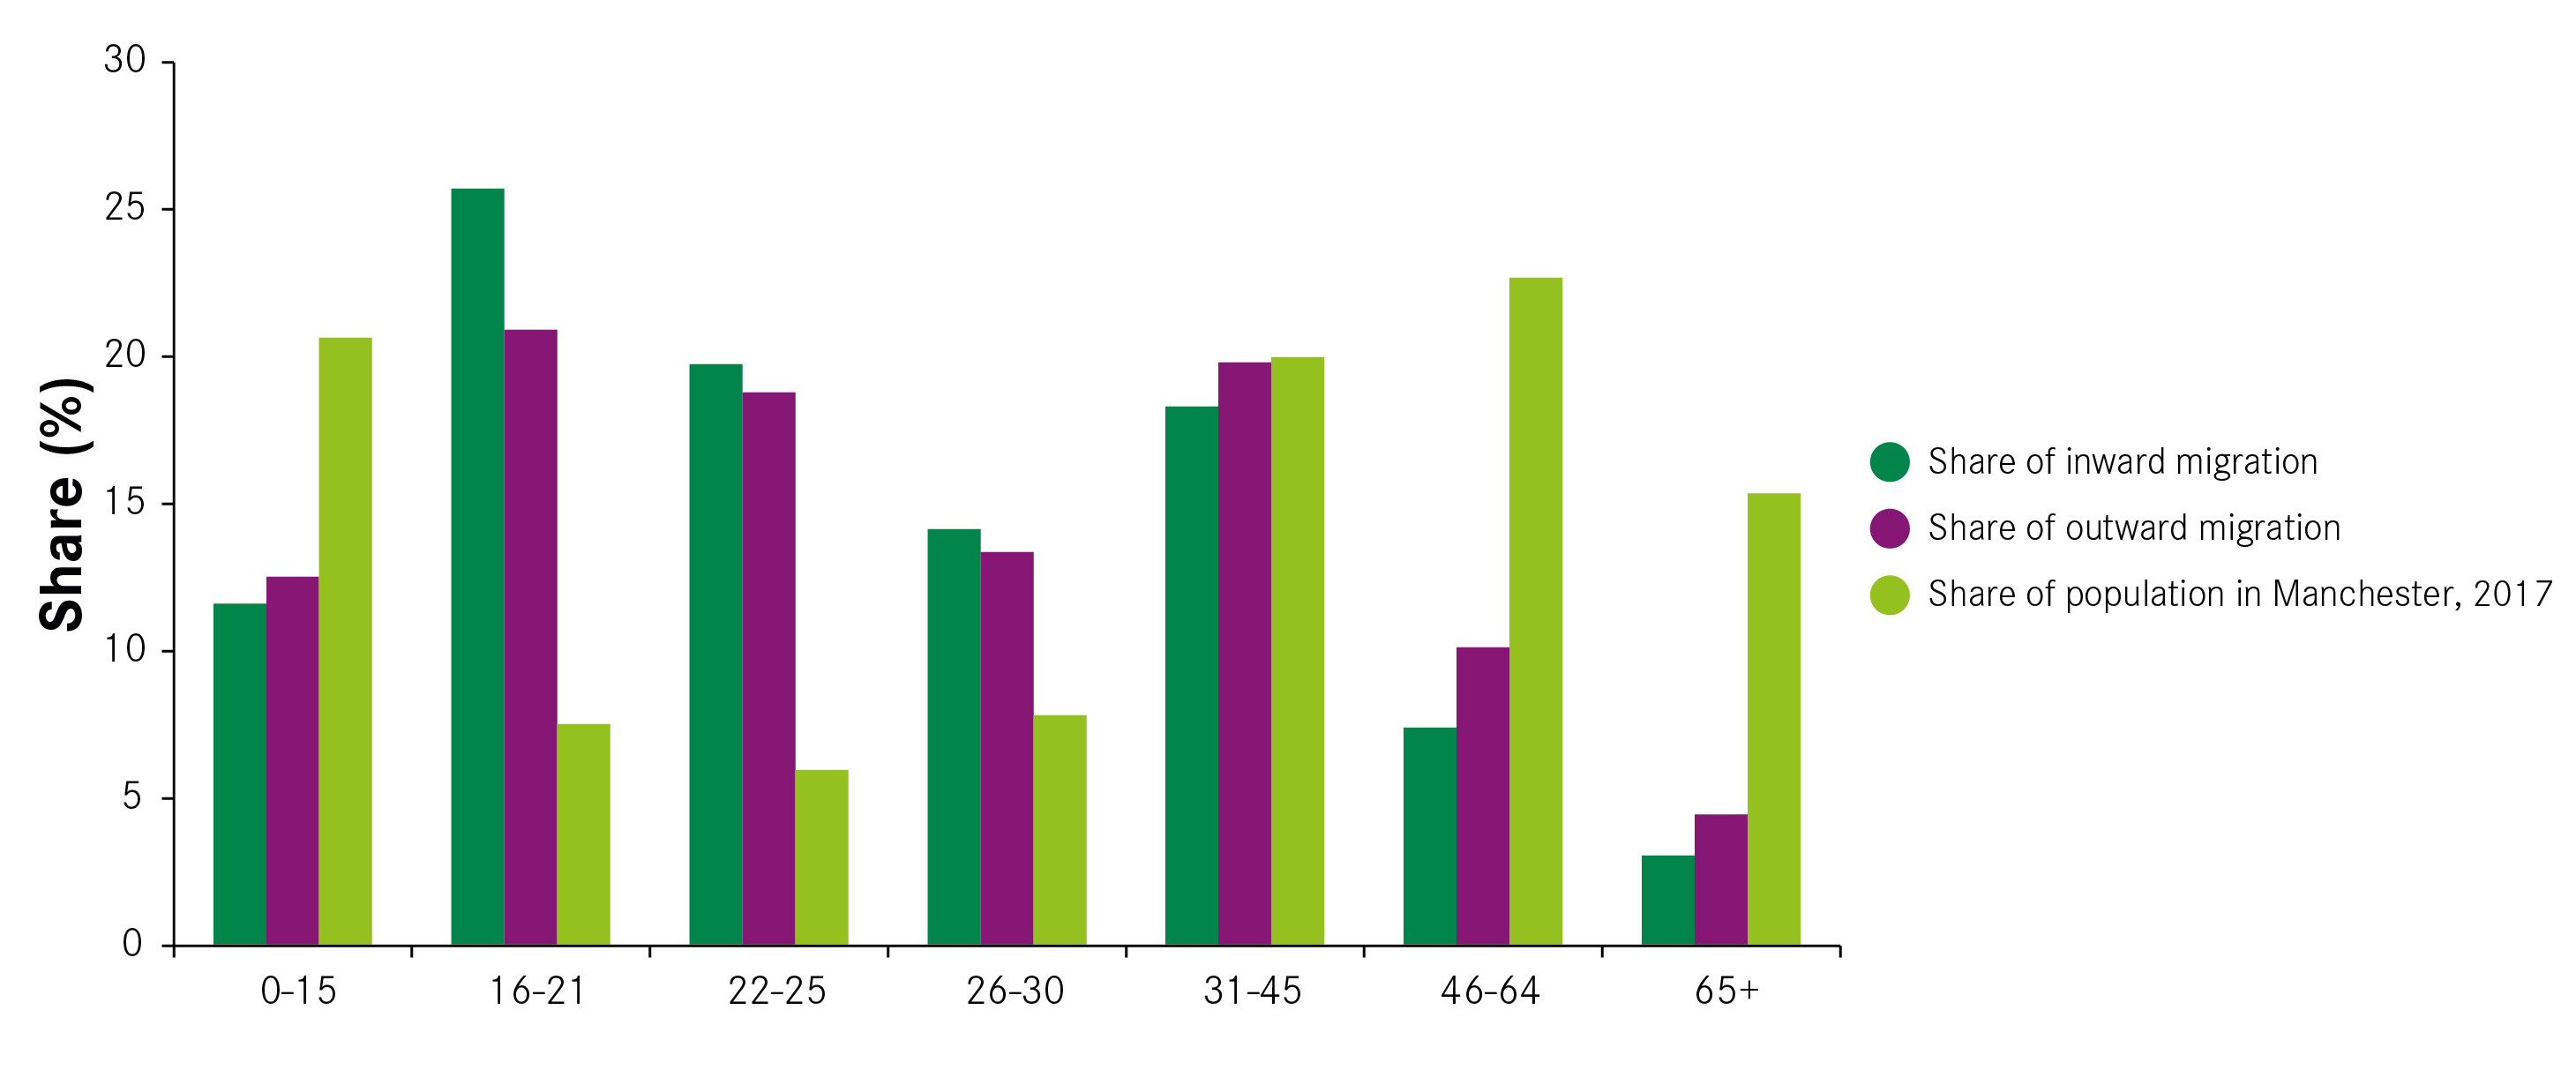
Figure 4: Net inflow of people to Manchester by age, 2009-2017
Manchester gains young graduates but loses older ones to the rest of the region
While the ONS migration data does not provide information on the qualifications of migrants, the 2011 Census does for those who moved between 2010 and 2011. When the data is split into three age groups: 16-to 21, 22-to 30- and 31- to 45-year-olds, three distinct trends emerge.
Manchester saw a net inflow of 16- to 21-year-olds from all regions but one, as shown in Figure 5. The largest inflows were from the West Midlands, South East and London. These flows were dominated by those with A-level qualifications or equivalent, highlighting the pull of the city’s universities which will be discussed in greater detail in the next section. The exception was Yorkshire, to which there was a net outflow of young people driven by movements to Leeds and Sheffield.
The city also experienced net inflows of 22- to 30-year-olds from several regions, the most significant being from the North West and Yorkshire, as Figure 6 shows. But for this age group net inflows were dominated by degree holders. The city saw a large net outflow of graduates to London, with an overall loss of 1,730 to the capital between 2010 and 2011. So the city pulls in young graduates from across the North while also losing many to London.
Figure 5: Net inflows of 16-to 21-year-olds by region and qualification, 2010-2011
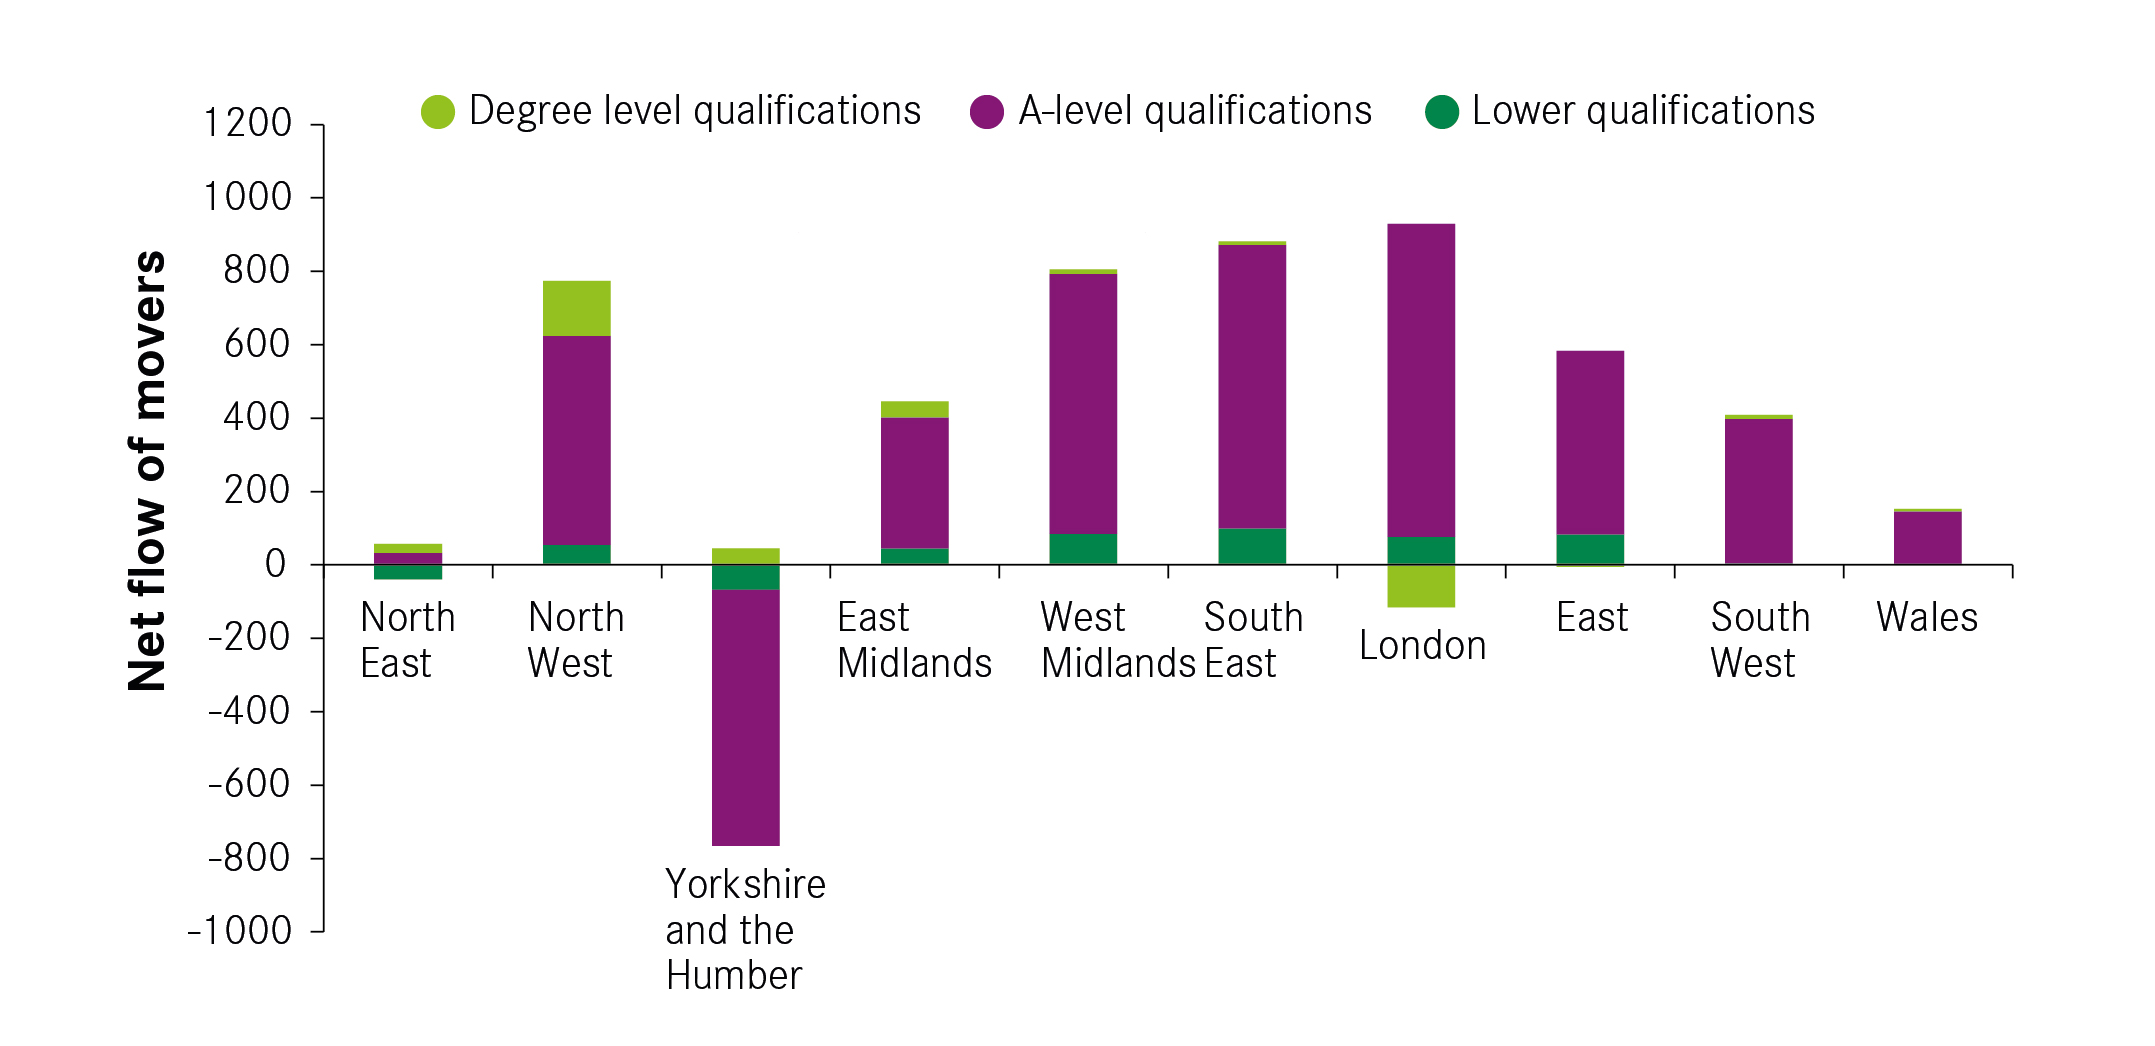
Figure 6: Net flows of 22- to 30-year-olds by region and qualification, 2010-2011
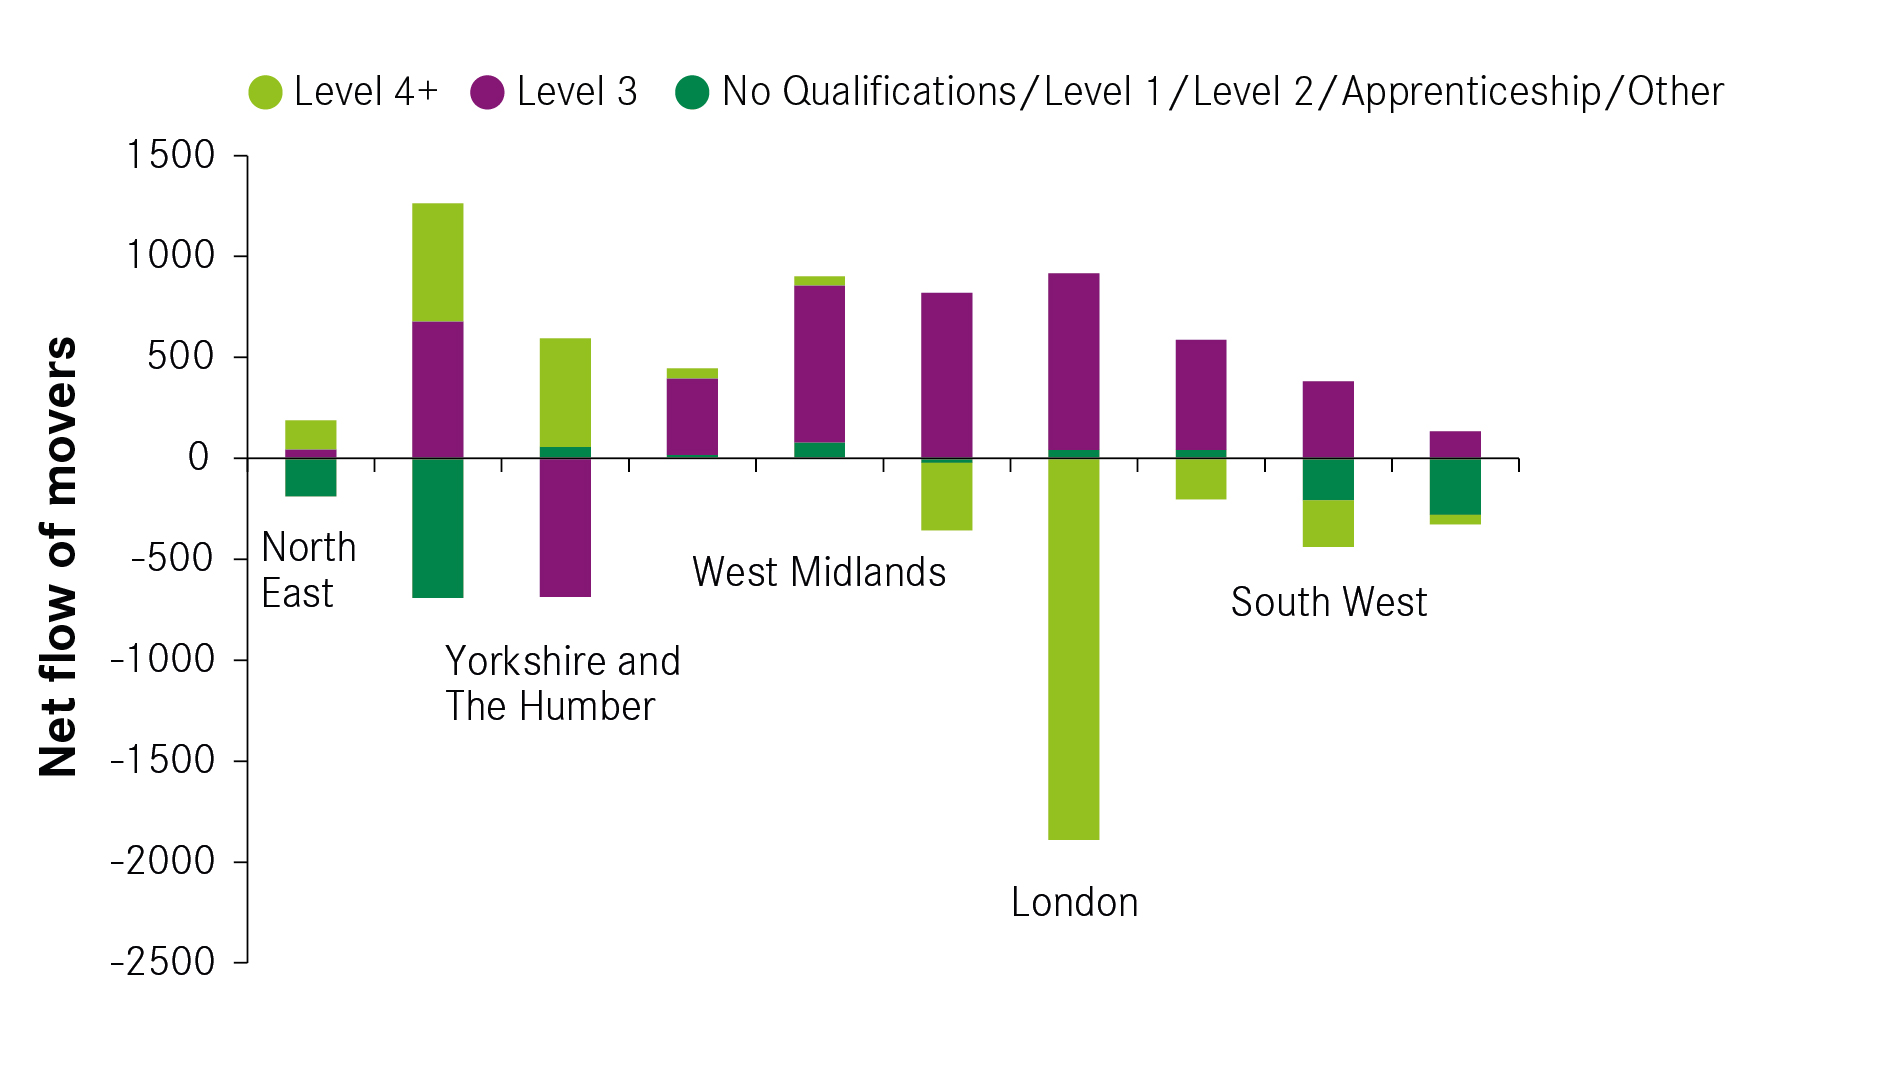
The pattern of graduate migration changed for those aged 31 to 45, with a net outflow of these residents to all regions except a small net inflow to Yorkshire (see Figure 7). So while graduates continued to move into the city up until their mid-0s, after 30 they were more likely to leave. But many stayed nearby, with the largest net outflows of this age group being to other parts of the North West. Those with lower skills were also more likely to leave than move to Manchester, with a net outflow of 420 of these residents to the rest of the region.
Looking again at the wider migration data for 2009 to 2017, from the ONS, allows us to see movements between local authorities and shows that the majority of people did not travel very far. Cheshire East and Warrington were the local authorities to which Manchester lost the greatest number of 31-to 45-year-olds, followed by Rossendale and High Peak. This means that many of these movers remained within commutable distances to Manchester even if they no longer lived in the city.
Figure 7: Net flows of 31-to 45-year-olds by region and qualifications, 2010–2011
This trend in older degree holders leaving the city but staying within commutable distance is common to many UK cities. Previous work by Centre for Cities has shown that those aged between 35 and 54 tend to place more value on the size and type of their houses, and access to local schools, leading many to prefer living outside cities.2
Summary
- Manchester experienced a net outflow of people between 2009 and 2017 from the city to other parts of England and Wales.
- However, there was a net inflow of 16-to 21-year-olds with A-levels to Manchester. Many of these are likely to have been students moving to the city for university, a pattern which is explored in the next section.
- The city saw a net inflow of graduates aged 22 to 25 from elsewhere in the North West, but a net outflow of these young degree holders from the city to London. Overall, there was a small net outflow.
- But this pattern changed for graduates aged 31 to 45 with the overwhelming trend being movement out of the city. Most of these older migrants stayed close to the city, moving within the North West staying a commutable distance to Manchester.