08Why does this pattern matter for cities?
This pattern, of concentrated supply in city centres and on the outskirts of cities alongside minimal construction in the existing, built-up suburbs, has two major consequences. It means that a small number of neighbourhoods provide a disproportionate share of new homes in every city. This contributes to the disconnect between the local supply of new homes and local demand, deepening the housing crisis in our most unaffordable cities.
Housing supply is concentrated in certain suburban neighbourhoods
New suburban supply is important because the primary economic role of the suburbs is to be places where the workers in cities live. Despite a return to city centre living in recent decades, city centres in England and Wales accounted for a total of just over 500,000 homes in 2019, compared to over 13.7 million homes in the suburbs.
Yet, across England and Wales, suburbs are building new homes at a slower rate than city centres in almost every city.12 Although the suburbs have added a greater number of homes because they are already much larger, city centres have seen their housing stock grow by 16 per cent from 2011 to 2019, compared to just 6 per cent growth in the suburbs.
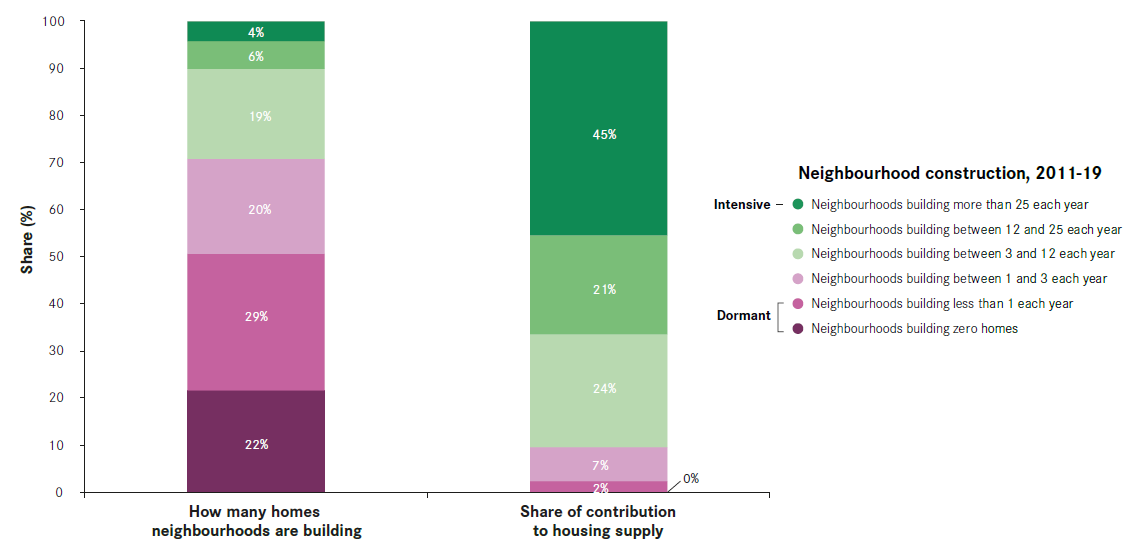
Figure 7 shows where these houses are built across all of the suburbs (including the existing, built-up suburbs and the outskirts within city boundaries) in England and Wales. On the left-hand side, the bar categorises each suburban neighbourhood according to its supply of new homes since 2011. The right-hand side looks at the contribution of these suburban neighbourhoods to total supply.
For instance, on the left-hand side, 22 per cent of all suburban neighbourhoods have built zero houses since 2011. These neighbourhoods therefore made zero contribution to total housing supply on the right-hand side of the chart.
The majority of our suburban neighbourhoods are building very little or nothing. Some 51 per cent of all suburban neighbourhoods have added less than one new home each year or none at all since 2011.13 These areas accounted for 2 per cent of all new supply in the suburbs, or just 17,000 homes. In the rest of this report, these neighbourhoods are together described as “dormant”.
Sunderland has the most dormant suburbs, with 70 per cent of neighbourhoods adding less than one house every year, compared to 22 per cent of neighbourhoods in Cambridge, with the least.
In contrast, while most neighbourhoods are building very little, a few are adding the lion’s share of new supply. Some 66 per cent of all new suburban houses since 2011, or almost 488,000 homes, have been built in the 10 per cent of our suburban neighbourhoods that have built at least 12 houses each year.14
Even within these high-supply neighbourhoods, there are those which are providing an especially concentrated amount of new homes. Neighbourhoods which have built more than 25 houses a year since 201115 account for 4 per cent of all suburban neighbourhoods. But the new houses they have provided are 45 per cent of all new suburban supply, or 333,000 homes. These neighbourhoods which have built more than 25 houses every year are described as “intensive”.
Milton Keynes has the most intensive suburbs, with 11 per cent of neighbourhoods in the city adding more than 25 houses each year. Neither Blackpool, Burnley, Luton or Oxford have any neighbourhoods in their suburbs building at that intensive rate.
A similar pattern has also been identified in the United States by the economist Issi Romem. Data on from American cities going back to the 1940s indicates that housing supply in cities ranging from San Francisco to Detroit has become increasingly “spiky”. After new suburbs are built around American cities they subsequently become “dormant” and see near-zero new supply and intensification. Increasingly, new construction continues only in high-density supply in certain town centres and in low-density suburban sprawl on the outskirts.16
Cities’ unbalanced supply shapes their total housing supply
An unbalanced supply across a city does not necessarily present a policy problem. After all, neighbourhoods which build lots of new homes are always going to account for a larger share of new housing than those that build fewer. These different patterns of supply may have economic explanations, such as higher demand in certain neighbourhoods than others, or better public transport access as in certain parts of London.
However, as large areas across all cities are building no more than a minimal amount of or zero new homes, intensive neighbourhoods have become very important to cities’ total supply of new housing.
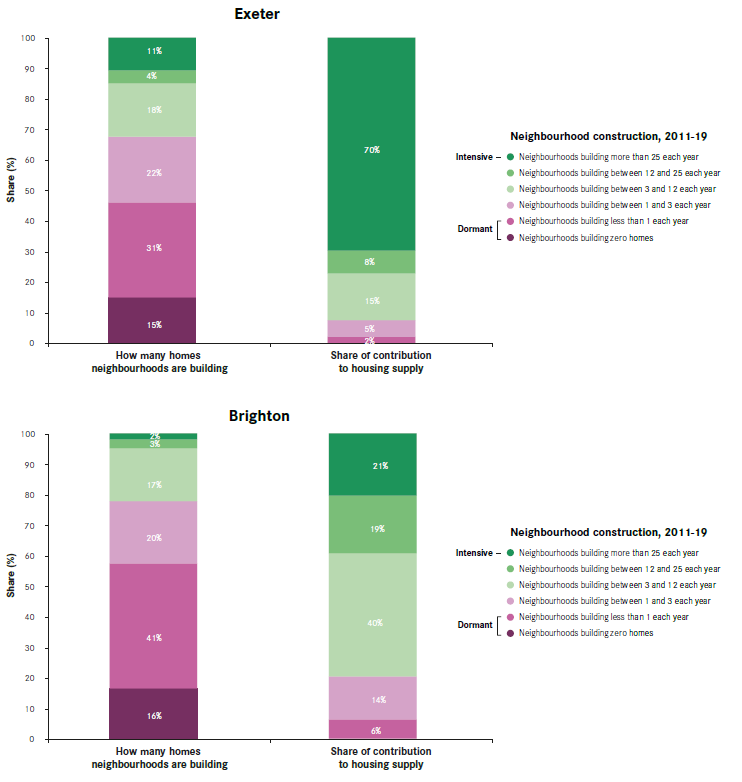
Figure 8 uses the graph above in Figure 7 to compare Exeter and Brighton, both cities with high demand for housing. Both Brighton and Exeter have certain parts of the city which are dormant – 46 per cent in Exeter, and 57 per cent in Brighton. But while 11 per cent of Exeter’s neighbourhoods are building intensively, only 2 per cent in Brighton are doing so.
That far fewer of Brighton’s neighbourhoods are adding more new homes at an intensive rate than in Exeter contributes to much lower housing growth in Brighton. Brighton’s total housing stock grew by 3 per cent from 2011-2019, compared to 8 per cent in Exeter.
The importance of intensive neighbourhoods to housing supply can be seen across cities in England and Wales. As Figure 9 shows, places with more neighbourhoods that are building intensively have seen faster total housing growth. The choices cities make regarding intensive supply in these specific neighbourhoods have a stronger link to the total growth in housing supply than factors that are actually connected to the demand for new homes, such as the affordability of housing in Figure 1.
Figure 9: Cities’ housing supply since 2011, and their share of neighbourhoods building more than 25 houses every year
This can be seen in Figure 9 with how cities with low demand for new homes, like Telford and Wakefield have seen a very large increase in housing supply because they have so many intensive neighbourhoods. In contrast, high-demand cities like Oxford, Brighton, Southend, and Bournemouth with serious housing crises are only building a small amount of new homes, partly because they have very few neighbourhoods building at an intensive rate.
The result is a paradox in the system which cities use to plan for and deliver new homes. It is currently crucial for cities responding to housing shortages to deliver intensive amounts of new homes in specific neighbourhoods in city centres and on the outskirts of cities. But this model disconnects local housing supply from local demand because it ensures that cities’ total housing supply depends on the decisions made about specific neighbourhoods in these places. At a system-wide level, this makes the housing crisis worse.
This pattern has other negative consequences
The lack of construction in the existing suburbs has other costs which go beyond the issues of affordability.
- The lack of supply in dormant suburbs means the existing housing stock is not being replaced by new, higher-quality As the needs of residents change due to smaller families, more single households, and an ageing population, an unchanging housing stock will become increasingly unsuitable. Furthermore, older homes tend to have lower energy efficiency even when insulated, meaning that an unchanging housing stock will continue to emit more carbon emissions than suburbs with newer housing stock.
- The new housing developments that are being built on the outskirts of cities in intensive neighbourhoods will eventually fall dormant once they are complete. That such little new housing is and will be added in the existing suburbs potentially lengthens commutes and increases car dependence as non-city centre housing growth is forced outwards.17
Infill development and intensification is particularly attractive to Small and Medium Enterprise (SME) builders who are prepared to work on small sites with unique requirements. The lack of such development within our existing suburbs may be contributing to the decline of the SME business model.18


