
07London – a large city with an extensive public transport network
A similar but distinct approach to Manchester can be seen in London in Figure 6, including both a 3D map of the entire Primary Urban Area of London where the height of the column and the colour represents local supply, and a 2D map zoomed in on the East End and including transport infrastructure.9 The highest column in Stratford indicates that one of the neighbourhoods in the Olympic Park has provided 5,572 homes over this period, or 697 houses a year.
London has seen housing supply increase by 8 per cent since 2011, which is faster than the urban average of 6 per cent. This is not just because of supply in the city centre, which seeing a 15 per cent increase built at a slightly lower rate than the city centre average of 16 per cent. Instead, there has been pockets of concentrated supply peppered throughout the suburbs, similar to Manchester but a much greater scale.
These pockets of supply in the suburbs have tended to follow public transport corridors due to the London Plan’s reliance on access to public transport10 to determine permitted housing densities. Certain pockets in the suburbs, which are frequently ex-industrial land or council estates such as the Olympic Park in Stratford, Wembley, Old Oak Common, Elephant and Castle, Nine Elms, North Greenwich, and Barking Riverside, are all experiencing very concentrated bursts of supply.
Figure 6: Where London has built new homes since 2011, with Network Rail and Transport for London routes mapped
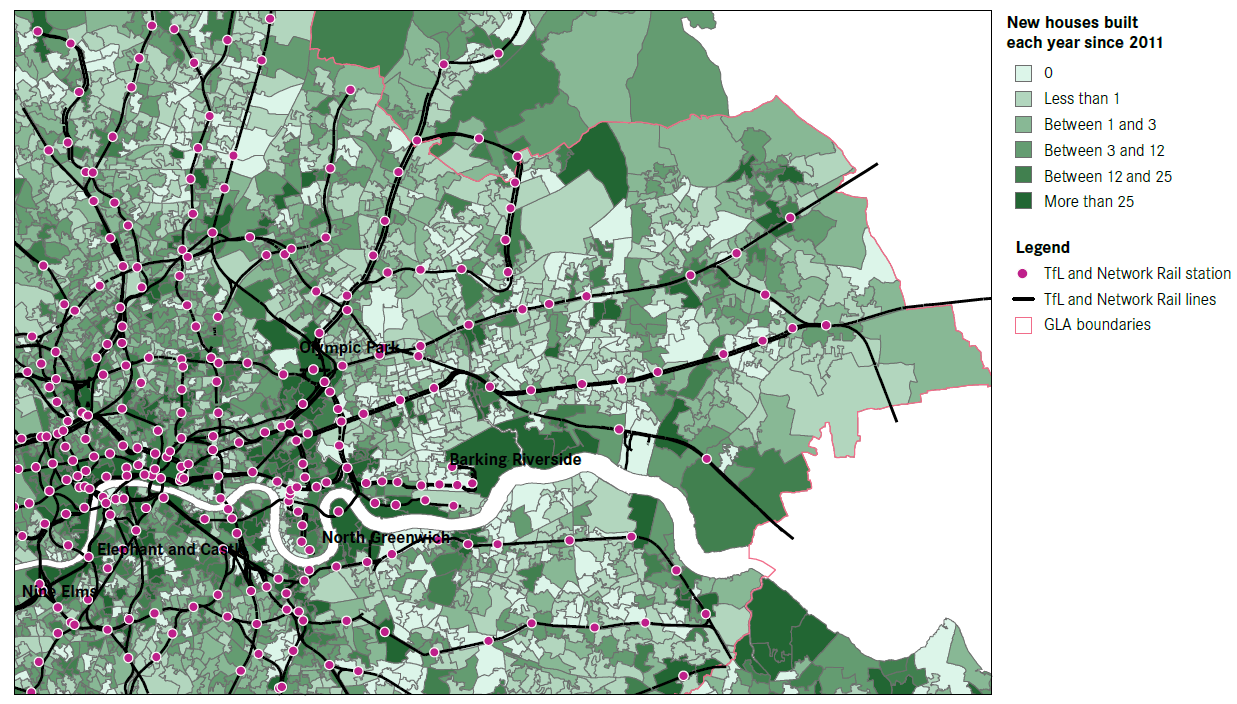

But not all public transport corridors have seen the same increases in housing supply. Large parts of the built-up area of London across every borough, including sections close to existing stations, have built very few new homes, particularly beyond Zone 2. Despite the pockets of intense supply, since 2011 43 per cent of suburban neighbourhoods in London have built less than one home a year, and 14 per cent have built zero. The result is that a small number of neighbourhoods experience major redevelopment – 6 per cent of London’s suburban neighbourhoods have provided 55 per cent of its new homes since 2011 – while a large swathe of the rest of London remains almost untouched.
The responsibility on these pockets of substantial supply in London is deepened because, like Manchester, there is little new construction on the outskirts of the capital. The Green Belt in the further reaches of London has reduced supply on the outskirts of the city. Unlike Exeter therefore, London is choosing not to make large amounts of undeveloped land available for new homes, even though there is enough land available in the green belt around London to provide 891,000 to 1,100,000 new homes within walking distance of existing train stations.11
In summary, across a range of cities in England and Wales of varying sizes and with differing economies, their existing suburbs add very little new housing. While the amount of homes supplied in cities’ outskirts, city centres, and certain pockets in the suburbs of larger cities all vary, large parts of all of these cities have seen minimal change in housing stock.