
02How does self-employment vary across the country?
There is significant variation in rates of self-employment across the country
Self-employment accounts for 15 per cent of all employment in the UK, but self-employment rates vary significantly across the country.
Interestingly, on average, self-employment is more prominent outside cities. Self-employment accounts for 14 per cent of total employment in cities, but for 16 per cent of all employment in other, less urban areas. In every region, self-employment accounts for a bigger share of all employment outside the major urban areas.
London stands out as an exception and dominates urban self-employment. The combination of the second highest rate of self-employment of all cities — 19 per cent of the capital’s working residents were self-employed in 2016 — and the city’s size means London accounts for 30 per cent of all employment in UK cities and for 39 per cent of all urban self-employment. When London is excluded, self-employment accounts for just 12 per cent of total employment in cities — 20 per cent less than in other, less urban areas.
Among cities too there is significant variation (see Figure 1). In Gloucester, only 6 per cent of those in work are self-employed, and that is similarly true in Hull (7 per cent) and Sunderland (8 per cent). In contrast, self-employment is particularly high in Worthing, where it is over three times higher than in Gloucester (at 20 per cent). Brighton and Southend also have particularly high levels of self-employment — 19 and 17 per cent respectively.
At first glance, there is no clear relationship between self-employment and the economic performance of a place. Despite some of the cities with the highest rates of self-employment being strong economies in the South of England, in Ipswich, Aldershot and Portsmouth, the share of those in work who are self-employed is lower than the national average. Meanwhile, Huddersfield, Blackpool and Bradford — which are weaker economies in terms of productivity — have high rates of self-employment and feature among the top 10 cities.
Figure 1: Self-employment as a share of total employment by city, 2016 (%)
| Top 10 cities | Self-employment as a share of total employment (%) | |
| 1 | Worthing | 20.2 |
| 2 | London | 18.5 |
| 3 | Brighton | 18.5 |
| 4 | Southend | 16.6 |
| 5 | Huddersfield | 15.9 |
| 6 | Blackpool | 15.6 |
| 7 | Bradford | 15.3 |
| 8 | Sheffield | 14.4 |
| 9 | Reading | 14.2 |
| 10 | Crawley | 14.2 |
| Bottom 10 cities | Self-employment as a share of total employment (%) | |
| 53 | Wigan | 10.5 |
| 54 | Glasgow | 10.5 |
| 55 | Derby | 10.0 |
| 56 | Coventry | 10.0 |
| 57 | Aberdeen | 9.4 |
| 58 | Newport | 9.4 |
| 59 | Telford | 9.2 |
| 60 | Sunderland | 8.1 |
| 61 | Hull | 7.4 |
| 62 | Gloucester | 6.0 |
Box 3: The demographics of urban self-employment
In cities, women are less likely to be self-employed than men and only account for 31 per cent of all self-employment in cities. This is true in every city. But their prominence in the self-employed labour market has increased significantly in recent years. Back in 2004, only 21 per cent of all self-employed people were women.
However, self-employment is much more likely to be an extra source of income for women than men. Of all women who are self-employed, one in three has an additional source of income, compared with just one in
five men.
There is a clear distinction in the industries worked in by gender, with women across the country accounting for 75 per cent of all self-employment in personal services, 73 per cent in human health and social work activities, 54 per cent in administration and 53 per cent in education. In contrast, they account for only 5 per cent of self-employment in transport, and just 2 per cent in construction.
In terms of age, 66 per cent of self-employed individuals in cities are between 25 and 49, 28 per cent are 50 to 64 and 6 per cent are 16 to 24. Older workers in cities, those aged 50 to 64, are approximately 10 per cent more likely to have self-employment as their only source of income than those aged 25 to 49 and 17 per cent more likely than younger self-employed people (16- to 24-years-old).
In all cities, self-employment is dominated by a small number of industries
While self-employed individuals work in a broad range of roles, most fall within just four industries. Construction, transport and storage, arts and entertainment, and personal services account for 54 per cent of all self-employment in cities (see Figure 2).
Construction alone accounts for almost a third of all self-employment in cities, compared with just 4 per cent of all city jobs. It is the most popular industry for self-employment in every city, and half of all those who work in the industry are self-employed.16
Transport and storage is the second most dominant industry, accounting for 10 per cent of city-based self-employed people. Within this industry, the most prominent categories in terms of self-employment are taxi drivers, other private hire and couriers.
The personal services industry — predominantly hairdressers and beauty professionals — and arts and entertainment are also much more dominant within self-employment than all employment. They account respectively for 6 and 5 per cent of all urban self-employment compared to 2 per cent each of urban employment.
Figure 2: Employment and self-employment industry breakdown in cities, 2015/16

These stark differences between self-employment and employment hold for all cities. The dominance of the four industries ranges from 40 per cent of all self-employment in Cambridge to 69 per cent in Luton, but is consistently higher than the share of general employment for which they account.
This is an important point for policymakers considering how best to support self-employed people, as it suggests particular focus should be given to these industries. Furthermore, this helps explain why, at first glance, there is no clear relationship between self-employment and economic performance.
In stronger cities’ economies, self-employed people are more likely to work in high-skilled occupations
Where there is a link between economic performance of a local labour market and self-employment is in its ‘quality’, i.e. in the type of roles self-employed individuals undertake and the role self-employment plays in their life.
Overall, 78 per cent of urban self-employment is in lower-skilled occupations,17 such as warehouse operatives, taxi and other private hire drivers, cashiers and lower-skilled construction workers.
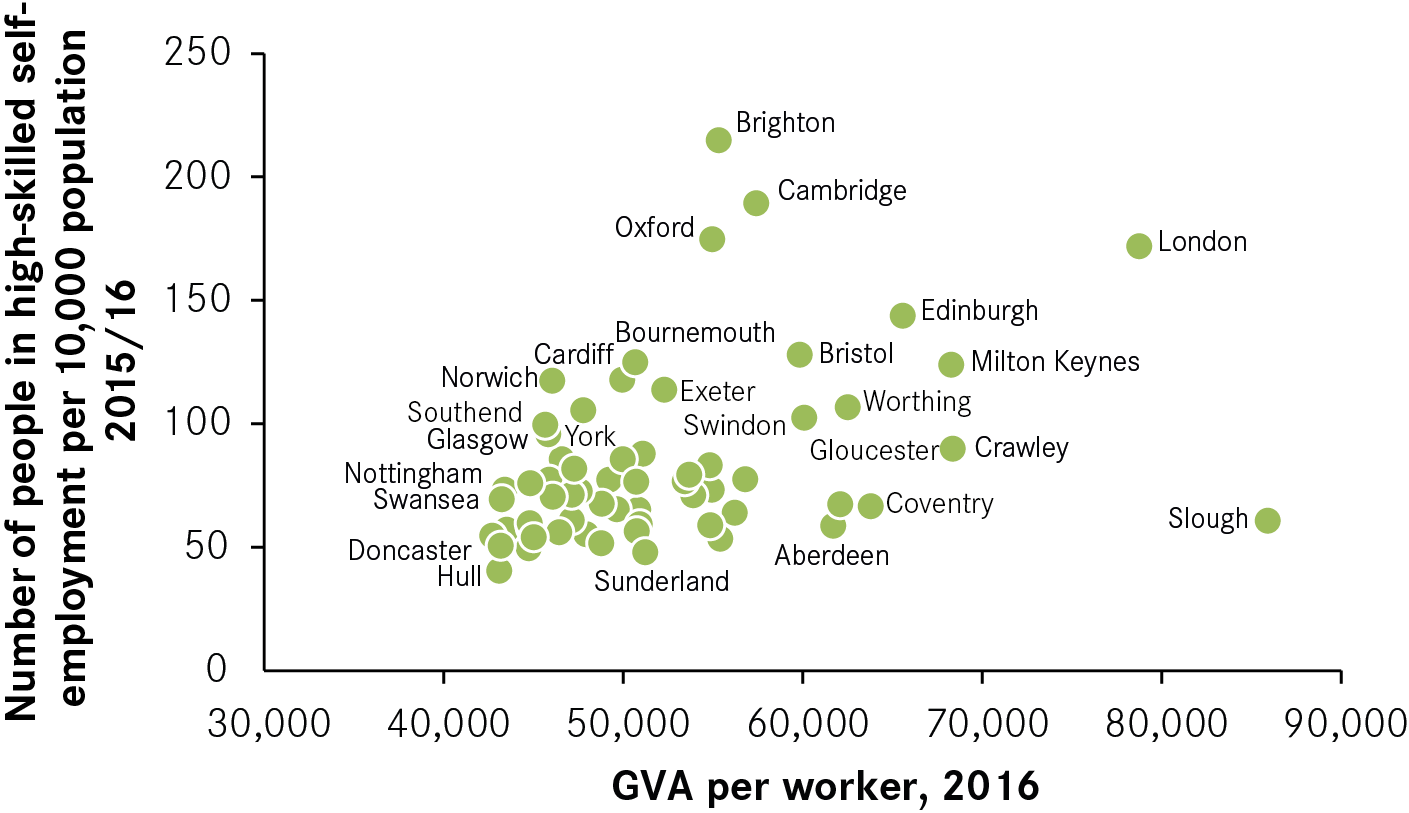
However, there appears to be a relationship — albeit weak — between the strength of an economy, measured by productivity, and the skill level of the roles self-employed people undertake (see Figure 3).
For example, in Mansfield and Stoke — both ranked at the bottom in terms of productivity — there are respectively 49 and 51 self-employed individuals in high-skilled occupations for every 10,000 people. In contrast, in London and Edinburgh – the second and the fifth most productive cities in the UK — the figures are three times higher or more: with 172 and 144 self-employed individuals in high-skilled occupations such as arts and entertainment, education and healthcare respectively, per 10,000 people.
Figure 3: The relationship between productivity and the number of self-employed people in high-skilled activities per 10,000 population, 2015/16
These differences in the nature of self-employment are significant and in line with broader labour market trends. A more productive city tends to have more people with high-skilled qualifications and more high-skilled jobs in general,18 and this is similarly reflected in the types of self-employment jobs it creates.
As such, these findings carry important implications for policymakers. They suggest that, if cities want to provide more high-skilled self-employment opportunities, they need to focus more broadly on boosting productivity rather than specific objectives related only to self-employment. That means changing the foundations of the economy, for example by boosting the education and training outcomes of residents and the workforce.
Box 4: The relationship between high-skilled self-employment and productivity in Slough
An interesting exception to the relationship between productivity and self-employment skills is Slough.
It is the most productive city in the UK and yet only 11 per cent of those self-employed are in high-skilled roles, the lowest share of all cities. This is driven by the dominance of self-employment in the transport industry which accounts for a quarter of all self-employed people in Slough and is predominantly made up of taxi drivers, other private hire and couriers. This might be due to Slough’s proximity to Heathrow and London.
The resident-based data used to measure self-employment may also be influencing this finding. Slough could be the workplace location of more high-skilled self-employed individuals than the data picks up, because they live outside of Slough.
Self-employment is less likely to be an additional source of income in weaker city economies
Just as the skills profile of self-employment varies according to a city’s economic performance, so too does the role played by self-employment in people’s working lives.
For three-quarters of those self-employed in the UK, self-employment is their only source of income, whether they live in a city or elsewhere.19
However, in weaker city economies in the North and Midlands, which tend to have lower productivity, the share of individuals who are self-employed only is even higher (see Figure 4). In Blackburn and Burnley for example, over 80 per cent of self-employed individuals rely solely on self-employment for income, a share 30 per cent higher than in Cambridge and Oxford where the economy is stronger.
In contrast, self-employment as an additional source of income is more frequent in cities in the South of England and Scotland. In Cambridge, four in every 10 self-employed people are also employed in another job, in Edinburgh 33 per cent of all self-employed people are also employed.
Figure 4: Share of self-employed individuals that are self-employed only, 2015/16 (%)

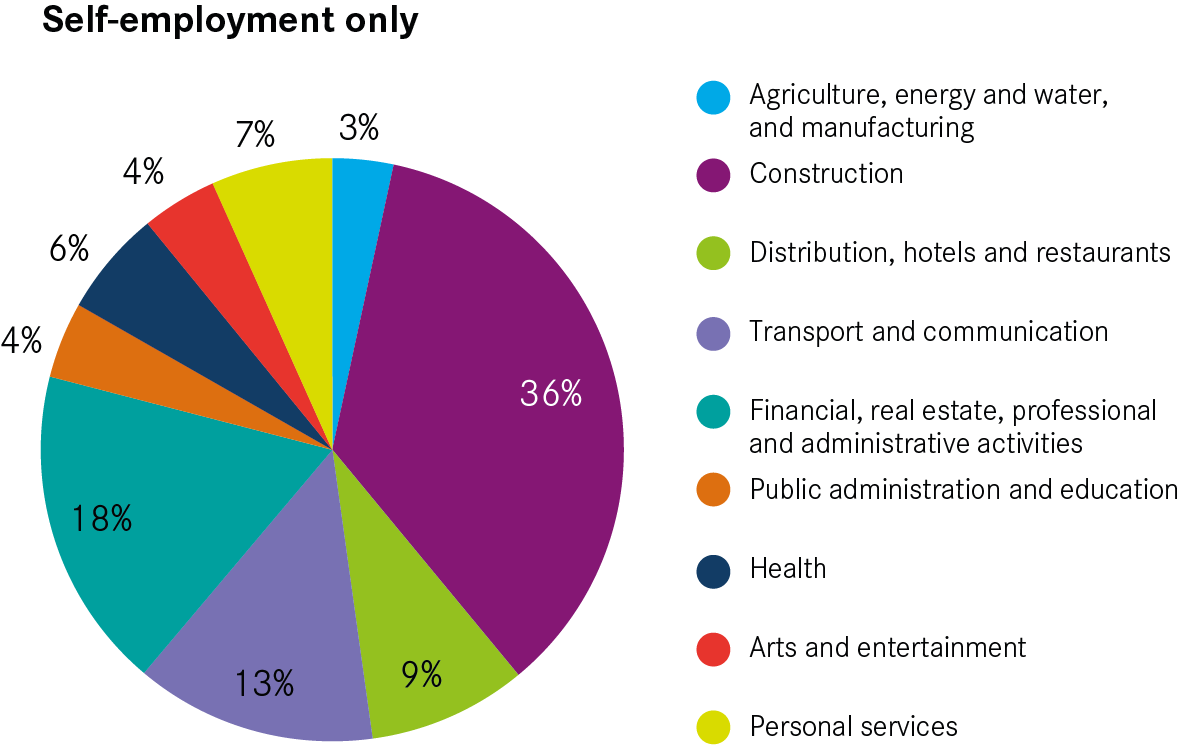
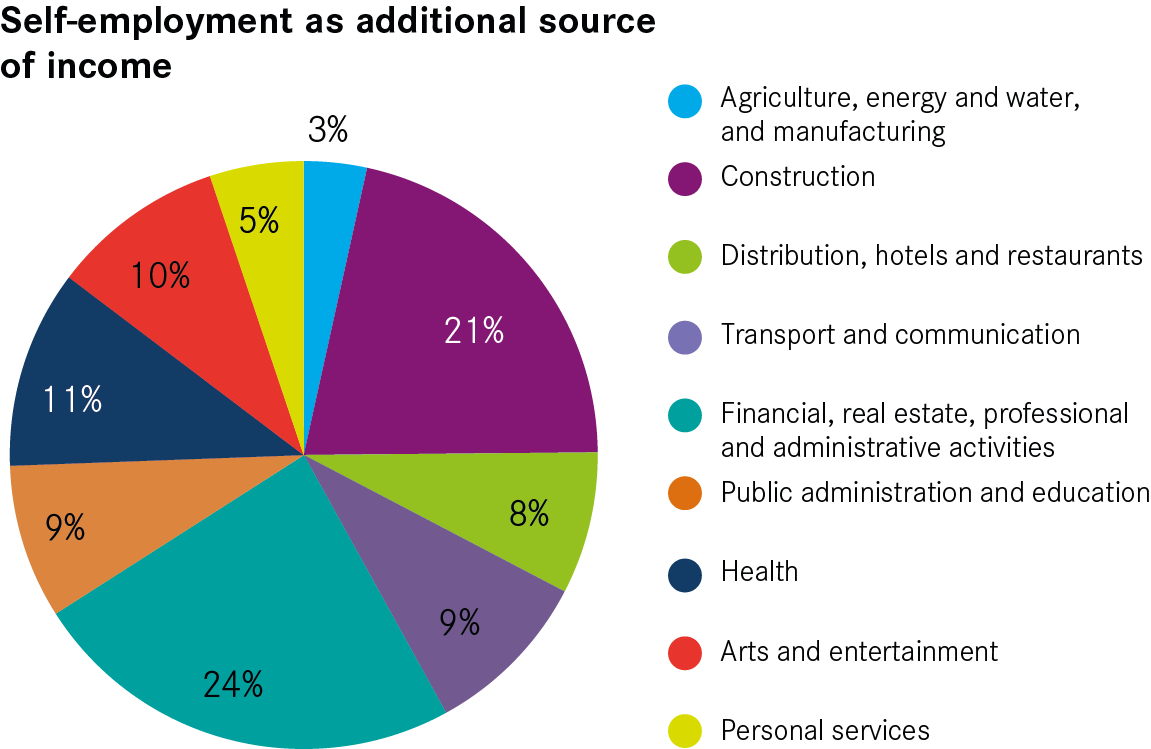
In cities, people for whom self-employment is an extra source of income are almost twice as likely to be in high-skilled roles as those for whom it is the only source (see Figure 5). They are more likely to work in the arts and entertainment industry (10 per cent compared with 4 per cent of those self-employed only), health and education (20 versus 10 per cent) and high-skilled professional jobs (24 versus 18 per cent).
On the other hand, self-employment in lower-skilled occupations, such as construction, personal service industries, transport, retail and accommodation is more common among those for whom self-employment is the only source of income (82 per cent compared with 66 per cent for those who are also employed).
Figure 5: The type of self-employment and industry breakdown, 2015/16
Combined, this suggests that, while self-employment has pros and cons, these benefits and costs are not evenly distributed. Those who are self-employed as an additional source of income and work in high-skilled roles are more likely to benefit from the flexibility and autonomy self-employment provides, while being more protected from the insecurity it creates thanks to the pay premium these roles tend to offer.20 Yet, the data shows that the majority of self-employed people in all cities are instead in lower-skilled, usually lower-paid, occupations and rely solely on self-employment for income. That means they might be more exposed to the insecurity self-employment creates.
This is particularly the case in cities with weaker economies, where the share of self-employed individuals relying solely on self-employment in lower-skilled occupations for their income is even higher. So not only are the costs and benefits of self-employment not evenly distributed across different roles, they are also unevenly distributed across the country. This highlights that the strength of a local economy matters in determining the quality of self-employment opportunities a place offers.