
02How the transport systems of big British cities measure up to their European counterparts
Transport within cities matters to the national economy because urban mobility determines not just the speed of commuting, but also the number of workers who can access high-demand locations, especially city centres. Larger concentrations of people in urban areas should unlock economies of scale known as ‘agglomeration effects’ that better match workers to firms and achieve greater levels of specialisation and productivity.
Big British cities are less productive than their Western European peers
Big cities in the UK have lower productivity than their population would suggest, as Figure 1 illustrates. While large German and French cities are more productive, only in London is there a strong relationship between the size of a UK city and its productivity levels.3
Figure 1: Unlike a number of other Western European countries, productivity does not increase with city size in the UK

If the UK’s largest cities underperform in terms of transport connectivity, their ‘effective size’ (see Box 2) will be smaller than their total population would suggest. Also, because those cities cannot connect as many people, it reduces the benefits they offer as a place for business investment, impacting their economic performance.
Box 2: Transport connectivity, criteria, methodology and terminology
Criteria
This briefing compares transport connectivity – either by public or private transport – by looking at the area (both network area and population covered) that can reach the city centre (defined by a single point), within a certain time threshold. The thresholds used are 30 and 45 minutes.
If not stated otherwise, the 30-minute criteria is used.
Methodology
For public transport, various data sources are used to determine which areas can be reached within those times by aggregating real-life public transport timetables.
For private transport, driving speeds have been built in using a combination of open data sources and TravelTime’s own proprietary algorithms to imitate how people travel. Data for private vehicles also considers a congestion factor, which is the same for all cities that are analysed.
The arrival time is set for 09:00 on Monday 26 July 2021. Some parameters have been altered, including increasing the cycling and walking time to the station.
Terminology
For this report, transport connectivity is compared and classified using the following terminology:
- Transport accessibility: The share of people, relative to the total number of residents, who can reach the city centre under a specific set of criteria (time threshold and mode of transport). This variable can be seen as a measure of how good transport connectivity is, as a result of both infrastructure (network size) and the urban form of a city (density).
A number above 100 per cent means that residents from outside the city can reach the selected city centre, for example people from other cities in the Ruhr being able to get to the centre of Dortmund and Duisburg. However, it does not necessarily mean that all of the city’s residents can reach the city centre under the selected criteria.
Transport accessibility is a function of:
- Network size: Total area covered (square km) by a mode of transport, under a defined time threshold. The size of a network, especially for public transport modes, will be seen as a proxy for both the quality and the supply of public transport infrastructure.
- Residential density: The number of residents per square metre of the defined area who can reach the city centre by a certain transport mode within the time threshold.
How it links to agglomeration benefits and productivity:
- Effective size: Overall population that can reach the city centre by a certain transport mode within the time threshold. The higher the effective size, the larger the expected agglomeration benefits.
The indicators defined above do not cover the quality of the service, frequency, pricing and other factors such as intra-centre or inter-city connectivity.
Public transport accessibility in British cities is worse than in European cities
In principle, almost everyone living in a large British city could drive to the centre within 30 minutes (see Figure 2).4 While some Western European cities are also very accessible to residents living further out, especially those in the Rhine-Ruhr, road transport doesn’t appear to be a particularly limiting factor in the productivity performance of big British cities. 5
Figure 2: British city centres can be reached by almost all the city’s residents in a 30-minute drive

But serving a city centre by private transport alone is impractical – there isn’t enough road space, which limits the number of jobs that can be created there.6 Given the preference for high-skilled service businesses to be located in city centres, the performance of the public transport network is crucial to the economic performance of the city.7
Yet fewer people in big British cities can get into the centre within 30 minutes by public transport than their European counterparts (see Figure 3) – on average, it’s 40 per cent versus 67 per cent. This is also true when looking at a 45-minute threshold (see Appendix 2).8 As Figure 3 shows, this is the case for every large British city except Glasgow.
Figure 3: All large British cities, except Glasgow, have worse public transport accessibility than their European peers

This means that the labour markets of big British cities outside London are not as large as their populations would suggest. They have a smaller effective size as measured by the number of people who can reach the city centre by public transport compared with similar European cities.9 In reality, they don’t offer the business benefits they would be expected to.
Box 3: Transport performance as cities get larger
As cities get larger and physical distances increase, the share of workers who can reach the centre in 30 minutes does drop, as London and Paris show. This doesn’t mean, however, that these two cities have underperforming public transport networks. The large populations of economically successful megacities mean labour markets require bigger public transport networks, so many commutes are longer than 30 minutes.
There are two reasons why this may be the case. The first is a supply-side problem; British cities may have less public transport infrastructure than their European counterparts, resulting in a smaller network that is harder for residents to reach. This is what the debate on regional inequalities tends to focus on.
The second reason is a demand-side issue that is given much less air time – the built-form of British cities. As they are of a lower density than European cities, it is harder to scale public transport services and people are forced to live further away from existing infrastructure.
The following two sections look at the evidence available on each potential factor.
The area that public transport covers in big British cities is not universally worse than in European cities
Networks in large British cities do not necessarily cover less ground in 30 minutes than those on the continent. As Figure 4 shows, five of the nine big cities outside London have public transport systems of a similar size to their European peers. In fact, Birmingham, Glasgow, and Newcastle have networks that cover a larger physical area from which residents can still access the city centre in 30 minutes (Figure 5 compares the coverage in Birmingham and Lyon).10 In contrast, public transport systems in Leeds, Manchester and Sheffield allow a much smaller area to access their city centres in 30 minutes, despite the Metrolink and Supertram in the latter two.
Figure 4: The size of the public transport network is not a problem in all British large cities

Figure 5: Birmingham’s public transport network (green lines) is larger than Lyon’s (pink), when measured by coverage area, but the two areas cover a similar number of residents

British cities have poor public transport accessibility because they are not as dense as European cities
In large British cities, fewer people live in neighbourhoods that can easily access the city centre by public transport than in their Western European counterparts.11 Figure 6 shows that as European cities get larger, the areas that fall within 30 minutes of the city centre by public transport become denser. This is not the case for UK’s largest cities, with the exception of London, which is still less dense than Paris.
Figure 6: Britain’s biggest cities outside the capital have the biggest density mismatch with their European peers

As a city becomes bigger, connectivity and congestion issues are likely to increase. In response to this, densifying larger cities allows people to share land more efficiently, which in turn supports demand for public transport in terms of capacity, frequency, and infrastructure, especially to city centre locations.12 But the UK’s biggest cities have fewer people living in well-connected areas closer to the city centre, reducing potential demand for public transport. Cities like Birmingham should be substantially denser than Liverpool, just like Lyon is denser than Toulouse or Nantes.
Spatially, the impact of British cities’ built form can be seen in Figure 7. Despite the public transport networks of Manchester and Milan covering a similar area within 30 minutes, far more people can access Milan’s city centre in that time.
Figure 7: Milan's 30-minute area has more people living in it than Manchester's 30-minute area, despite being a similar size

In practical terms, mid-rise apartment living is much more common in European cities than Britain’s predominantly low-rise, terraced and semi-detached urban form (see Figure 8). Transport systems need users, but the built form of Britain’s big cities prevents people from living near stations where they can easily access these networks.
Figure 8: Urban form of both Milan and Manchester, approximately 15 minutes from the city centre by public transport

This is not necessarily down to different preferences in Britain, it is also an unintended result of the discretionary planning system. Its case-by-case decision-making process concentrates new homes at high densities in certain pockets on the outskirts, or in centres, of cities and prevents new development in suburban neighbourhoods, including around stations.13 In approximately 50 per cent of suburban neighbourhoods in England and Wales, fewer than one home was constructed every year between 2011 and 2020, and in 20 per cent none were built. 14
In addition, the English phenomenon of train stations in the green belt also reduces public transport accessibility. Stations such as Whitlocks End in Birmingham have rapid city centre connections, but there are few houses within accessible walking distance. At Pilning station in Bristol, which is on the Bristol-Cardiff rail line, a lack of residents means it cannot reach its full potential (see Figure 9). By only allowing a few people to live within walking distance of climate-friendly commuting to city centres from green belt stations, English big cities make poor use of the public transport infrastructure they already have, even though they could provide more than two million homes at suburban densities.15
Figure 9: Whitlocks End (left) and Pilning (right) stations sit among fields despite being within commutable distance of Birmingham and Bristol respectively

Public policy should invest in public transport infrastructure. But the UK’s big cities cannot reach European levels of public transport accessibility by just expanding their public transport systems, as described in the case study below. They need to change their built form too.
Case study 1: A Leeds metro will not close the public transport gap
Leeds has a relatively small public transport network when compared with its European peers (see Figure 10), plus low levels of public transport accessibility and effective size. Marseille is a similarly sized city in terms of population, and has a metro.
Although Leeds and Marseille have comparable populations, Figure 10 shows the French city has around 776,000 residents who can access the city centre by public transport in 30 minutes or less, while 299,000 people can reach Leeds city centre under the same criteria.
Figure 10: Unlike Marseille, the labour market in Leeds is much smaller than its total population
![]()
Source: TravelTime; ONS; Eurostat; Centre for Cities’ calculations.
However, the observed gap in effective size would not close if Leeds simply had a public transport network the same size as Marseille’s, as Figure 11 demonstrates. Currently, 87 per cent of people living in the French city can reach the centre by public transport in 30 minutes, but this is the case for only 38 per cent in Leeds.
Figure 11: The gap between Leeds and Marseille will not be fully closed just by increasing the size of the public transport network
![]()
Source: TravelTime; ONS; Eurostat; Centre for Cities’ calculations
If Leeds had a similar-sized public transport network to Marseille’s, it would almost double the area within reach of the city centre in 30 minutes, from 66 to 112 square kilometres. The share of people who could access it in that time would rise by 23 percentage points to 61 per cent of the population. However, 26 per cent of the population would still be living in inaccessible neighbourhoods because of the low-rise urban form that forces people in Leeds to reside further away from public transport stops.
Figure 12: The urban form next to public transport is significantly different in Marseille and Leeds
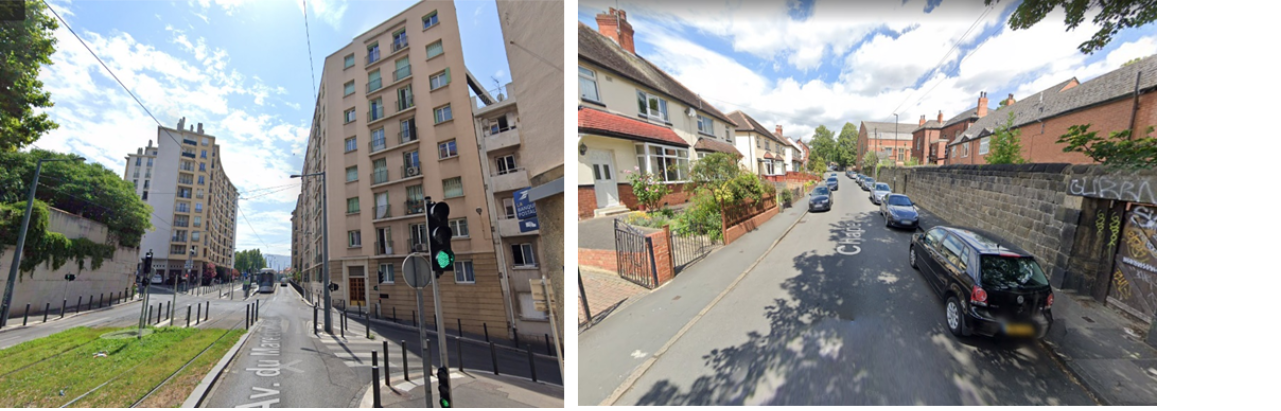
Source: Google Maps, 2021. Marseille (next to La Blancard train station) and Leeds (next to Burley Park train station). Both areas are approximately five minutes away from the main station.
In other words, even if Leeds could build a metro system as good as Marseille’s, the city centre would still be far less accessible by public transport because a lack of mid-rise housing would prevent people from living within walking distance of new and existing stations.
Lower accessibility inhibits public transport use
Poor accessibility can affect how frequently public transport networks in big British cities are used. As Figure 13 illustrates, British cities (circles) tend to be less accessible and accommodate less commuting by public transport than European cities (triangles). While factors such as ticket price will undoubtedly impact ridership, improving accessibility is the way to increase it.