02How exports relate to wider economic performance
Britain needs to increase its exports to improve its productivity
Exports matter because exporters tend to be the drivers of productivity growth as a result of their greater ability to generate and absorb new innovations. To take an extreme example for illustrative purposes: while a barber is unlikely to be much more productive than he or she would have been 50 years ago (the time it takes to cut a head of hair is unlikely to have reduced a great deal over that period), someone working in a car factory is now many times more productive than half a century earlier, and computers have vastly increased the value of work that someone working in cinema special effects, for example, can do in a day.
This can be seen in the productivity growth of different sectors in Britain.3 Since 1990, productivity has more than doubled in the manufacture of computer and electrical equipment and information and communications and has almost tripled in chemicals and pharmaceuticals. But very little growth has been seen in a number of sectors that tend to sell to local markets only. For example, productivity increased by just 2 per cent in food and accommodation and has declined in arts and entertainment and real estate.4
Given the ongoing policy imperative to increase the productivity of the British economy, encouraging the growth of exporting firms will be important. By extension, this will require an understanding of the performance of exporting companies across the country – and the low exporting activity of many cities – if the lagging productivity performance outside of the Greater South East is to be addressed.
But at a city level, having high exports does not automatically mean it is a more productive place – the type of exports matters too.
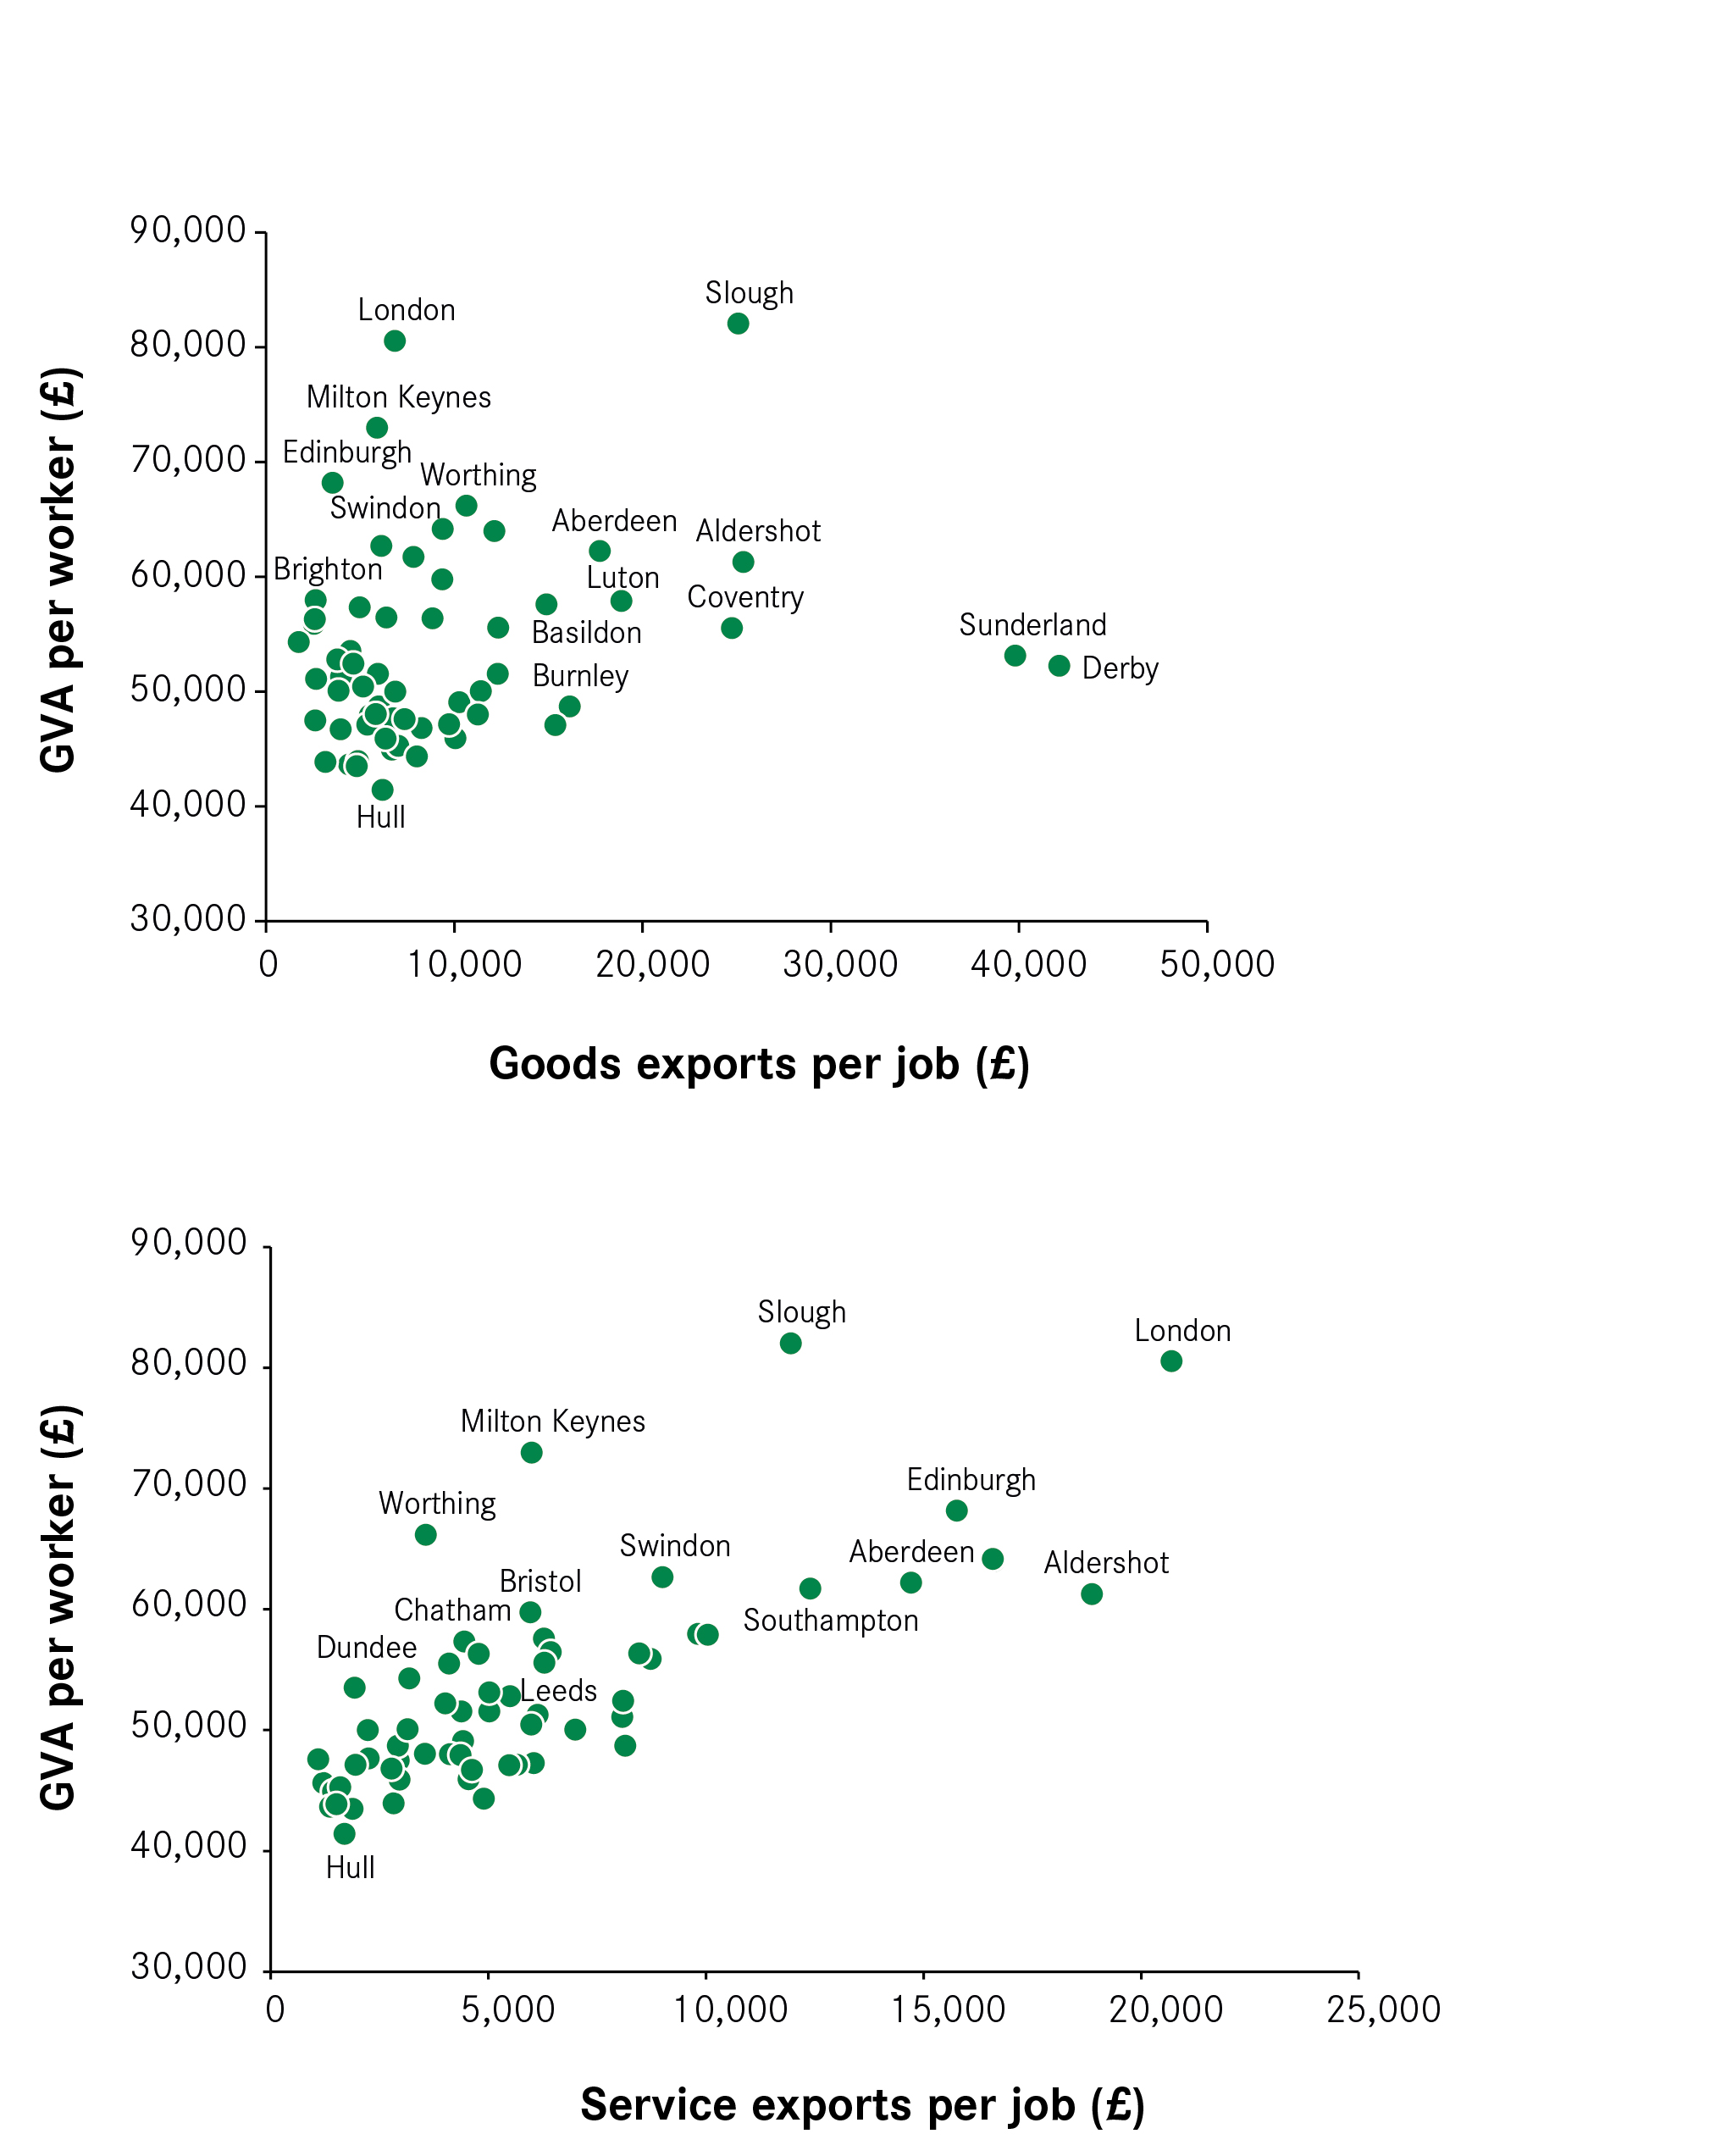
While there is a link between exporting industries and productivity at the national level, the impact that exporting has at the city level is much less clear cut. As Figure 10 shows, there is some relationship between exports per job and productivity for cities (a very similar relationship is also seen between exports per job and wages). However, this appears to be driven by services exports – there is very little relationship between goods exports and output per worker (see Figure 11).
This is likely to arise because of the way that manufacturing supply chains work relative to services and the impact that this has on measuring exports. To take Nissan’s Qashqai car as an example: it was designed in Paddington, engineered in Cranfield and is assembled in Sunderland. So while the car is assembled and exported from Sunderland, much of the ‘value add’ is carried out elsewhere. The relationship between services exports and productivity suggests that where the value add of services takes place is more closely aligned to where it is exported from than with goods exports.
This means that a British strategy to boost productivity cannot simply focus on boosting exports; it needs to consider how to boost the value add of those exports. The Local Industrial Strategies, currently being developed by Local Enterprise Partnerships, should focus on how they can improve productivity and exports in their areas.
Figure 10: The relationship between exports and productivity
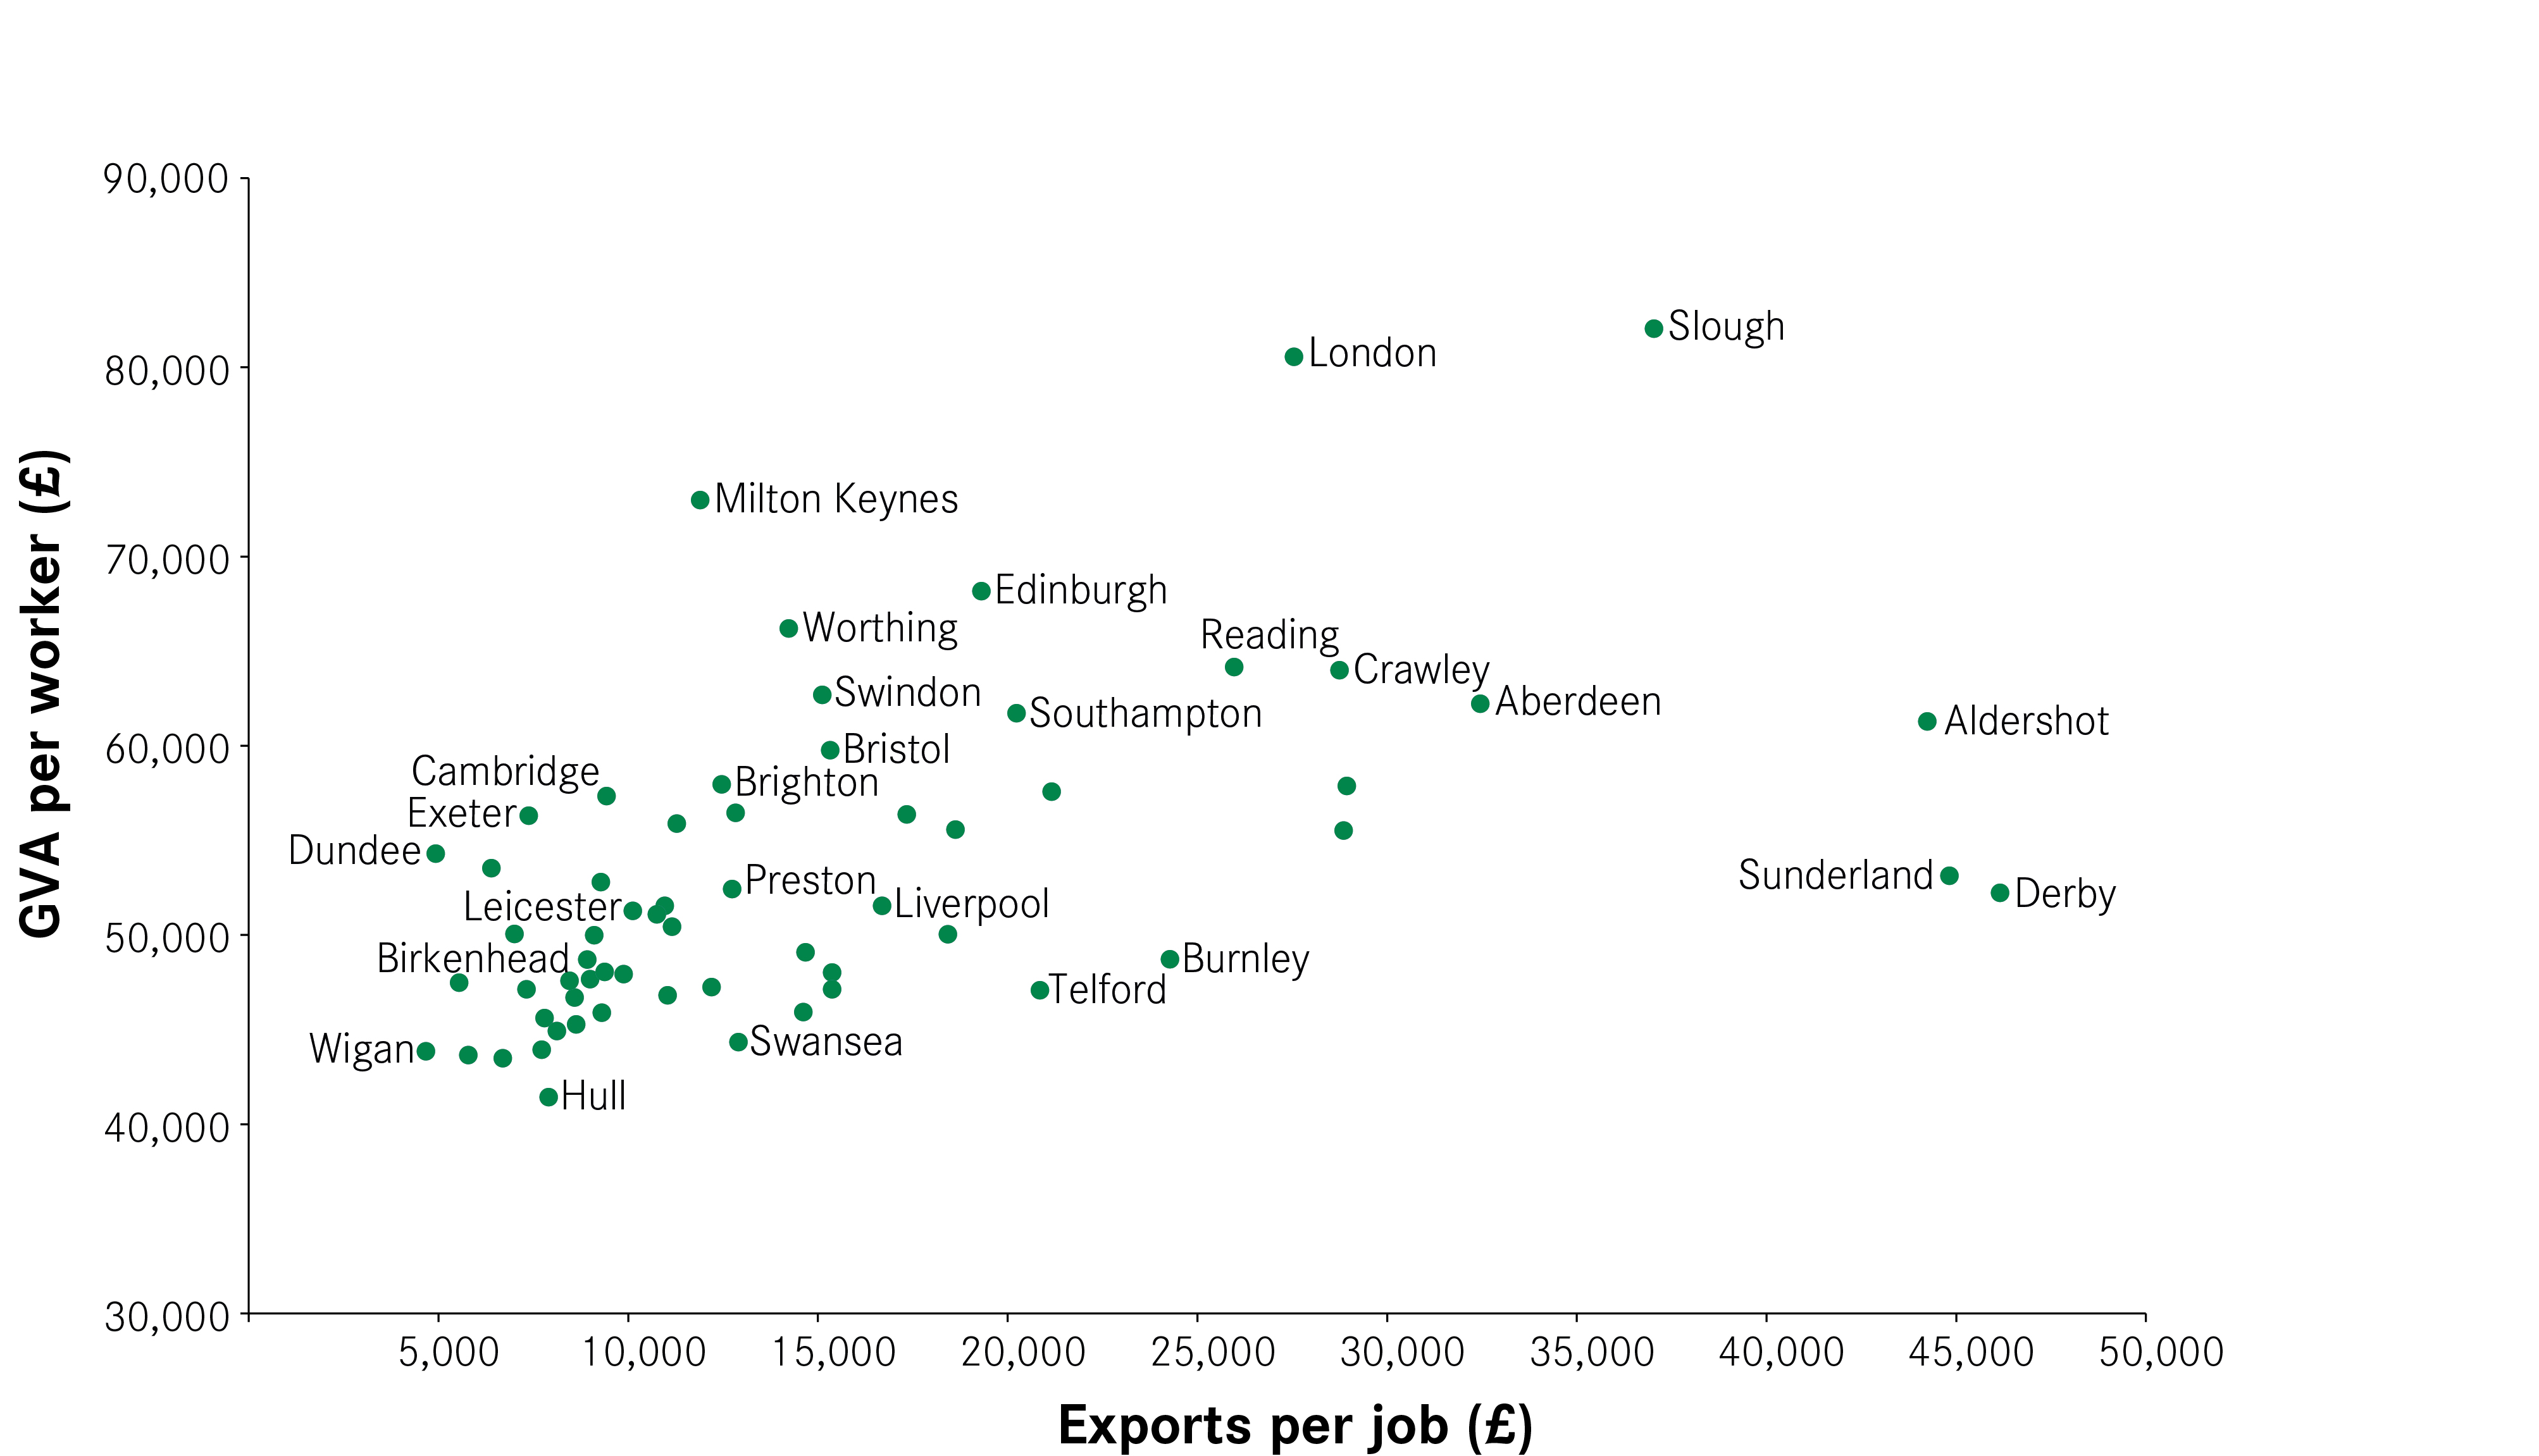
Figure 11: The relationship between services exports, goods exports and productivity
Industrial policy options for different cities
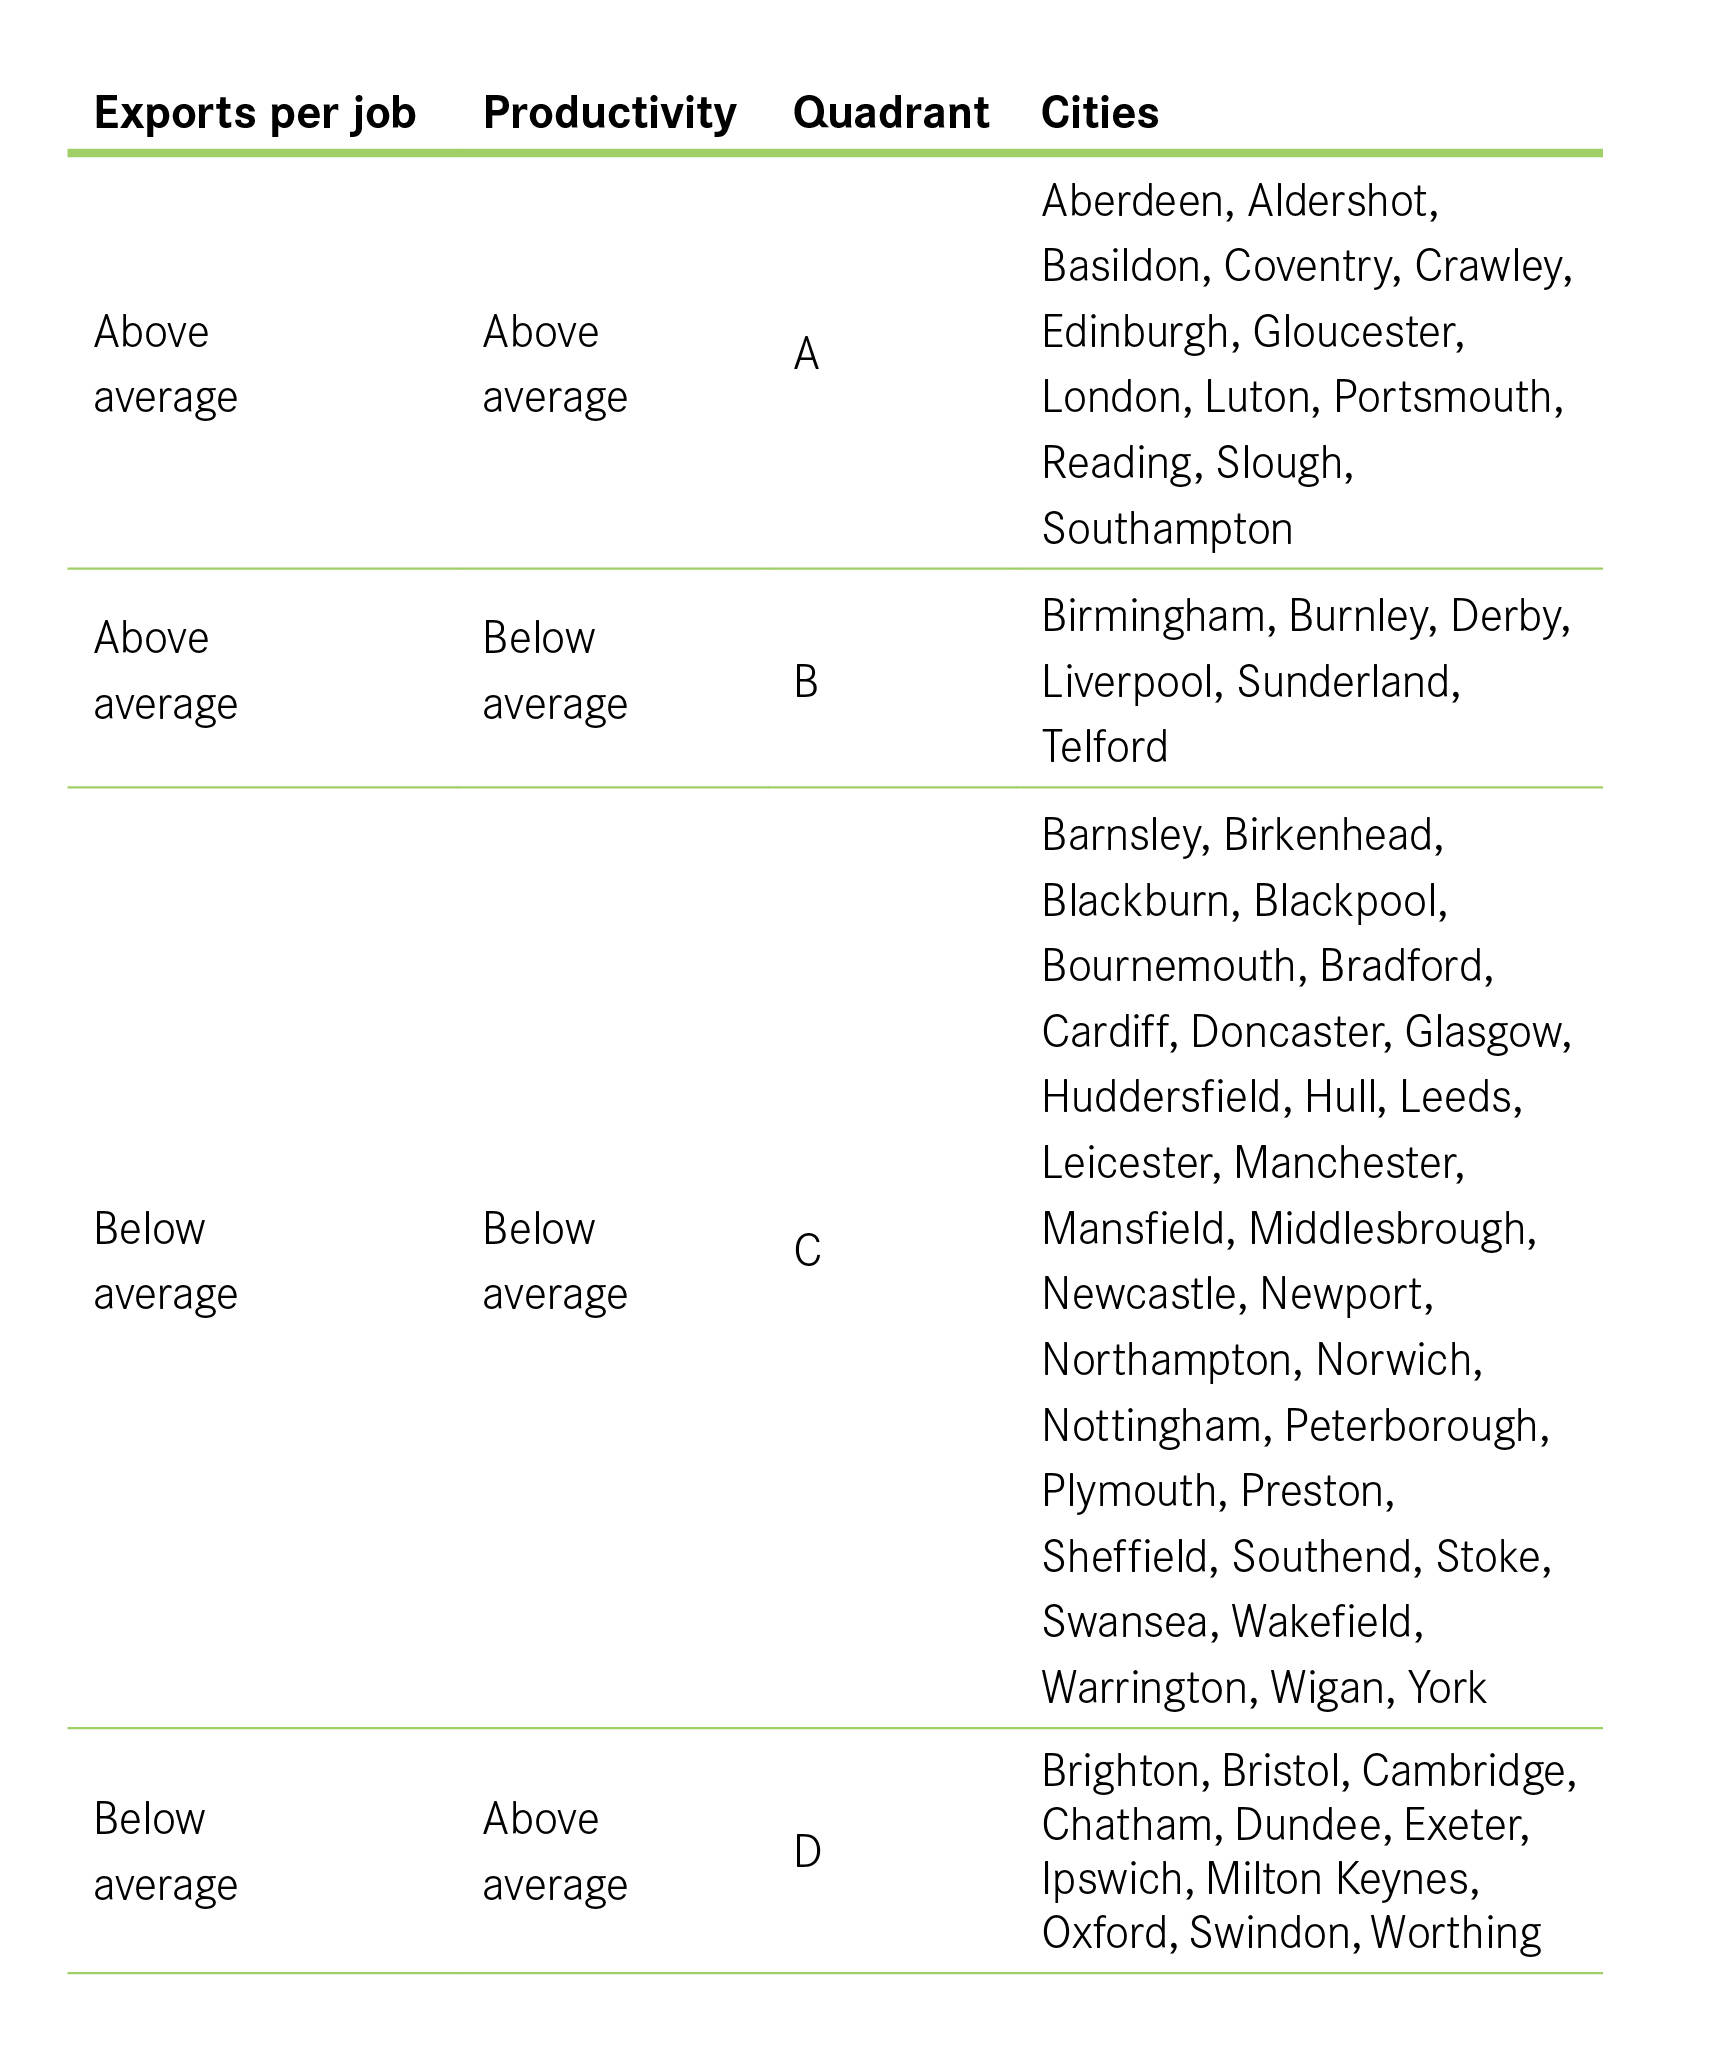
To help policymakers consider how this might work, Figure 12 splits cities into four groups according to their performance in terms of exports and productivity. It does this by looking at city performance relative to the national average for both indicators.
Quadrant A has the top performers – those that have both above average exports per job and productivity. Nine of the 13 cities in this category are in the Greater South East, matching what is known about the geography of productivity in Britain. A policy focus on helping already successful businesses to expand into new markets would be the best way to support higher exports and contribute to higher productivity in these cities.
Cities in Quadrant D, with above average productivity but below average exports per job, are likely to require a similar policy approach. That they have below average exports per job may suggest that businesses in their cities are successful at selling to businesses elsewhere in Britain, but are less successful at selling abroad. Again, support to export may be helpful in boosting growth. Seven of the 11 cities in this category are in the Greater South East.
Those cities in Quadrant B have less productive economies despite their high exports. This suggests that much of the ‘value add’ of the goods and services exported takes place outside these cities. While the exporting activity is important for local jobs, if these cities are to see an increase in both wages and productivity in the future, then the focus on policy should be attracting higher-value business investment and jobs.
It is notable that Quadrant C contains the most cities – 32 of 62 cities underperform the national average on both indicators. This urgently needs to improve if we are to boost the performance and productivity of the national economy. Policy – both at the local and national level – should focus on improving the attractiveness of these cities as places for business investment for exporters through improving skills and local infrastructure. Of these cities, 22 are in the North and Midlands – just two are in the Greater South East.
Figure 12: Grouping of cities according to exports per job and productivity