
01Cities and their exports
Cities account for the bulk of Britain’s exports
In total, cities accounted for 64 per cent of Britain’s total exports in 2017. The dominance of cities was particularly marked for services – they accounted for 52 per cent of goods exports, but 77 per cent of services exports.
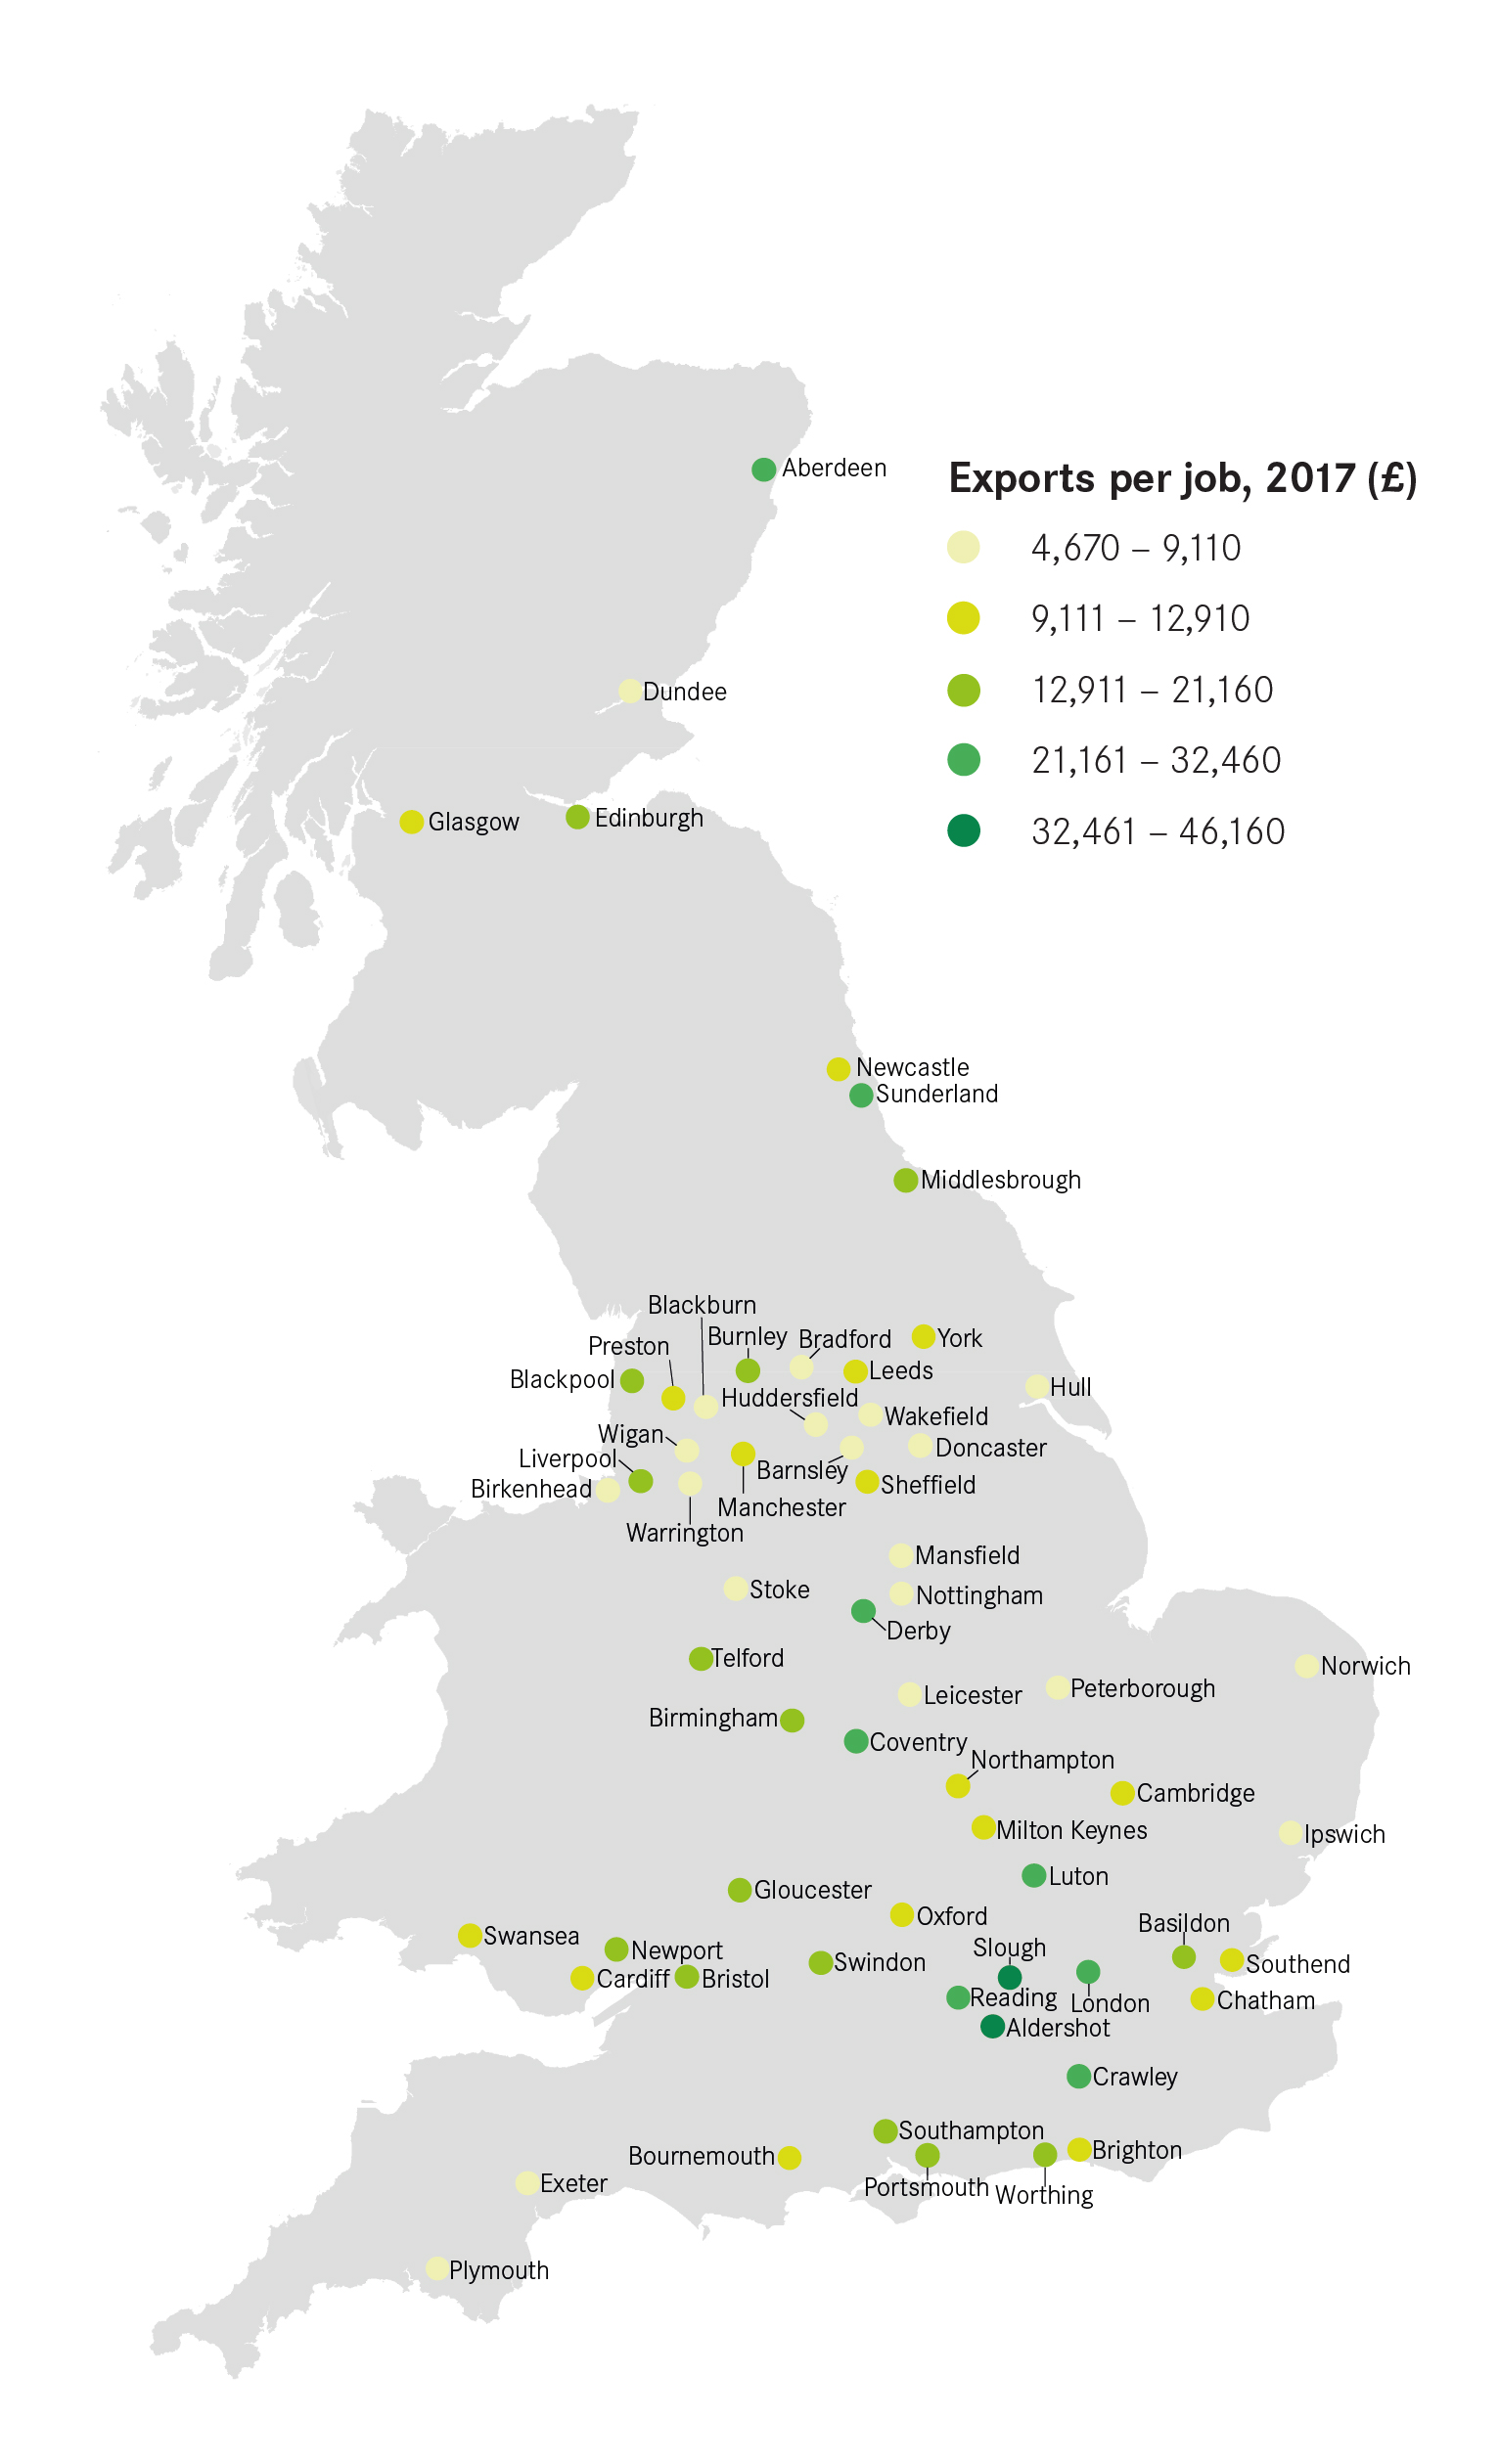
In absolute terms, London was the largest contributor, responsible for 31 per cent of all of the nation’s exports to other countries. Yet the picture looks somewhat different when accounting for city size. As Figure 1 shows, Derby exported the largest amount of goods and services on a per job basis of any British city, followed by Sunderland. However, these two cities are outliers – of the next eight cities on this measure, six are located in the Greater South East.1
Wigan, meanwhile, exported the least on this measure. On a per job basis, Derby exported 10 times as much as Wigan did in 2017. Strikingly, with the exception of Ipswich, none of the bottom ten cities measured by exports per job are located in the Greater South East.
Figure 1: Total value of exports by city
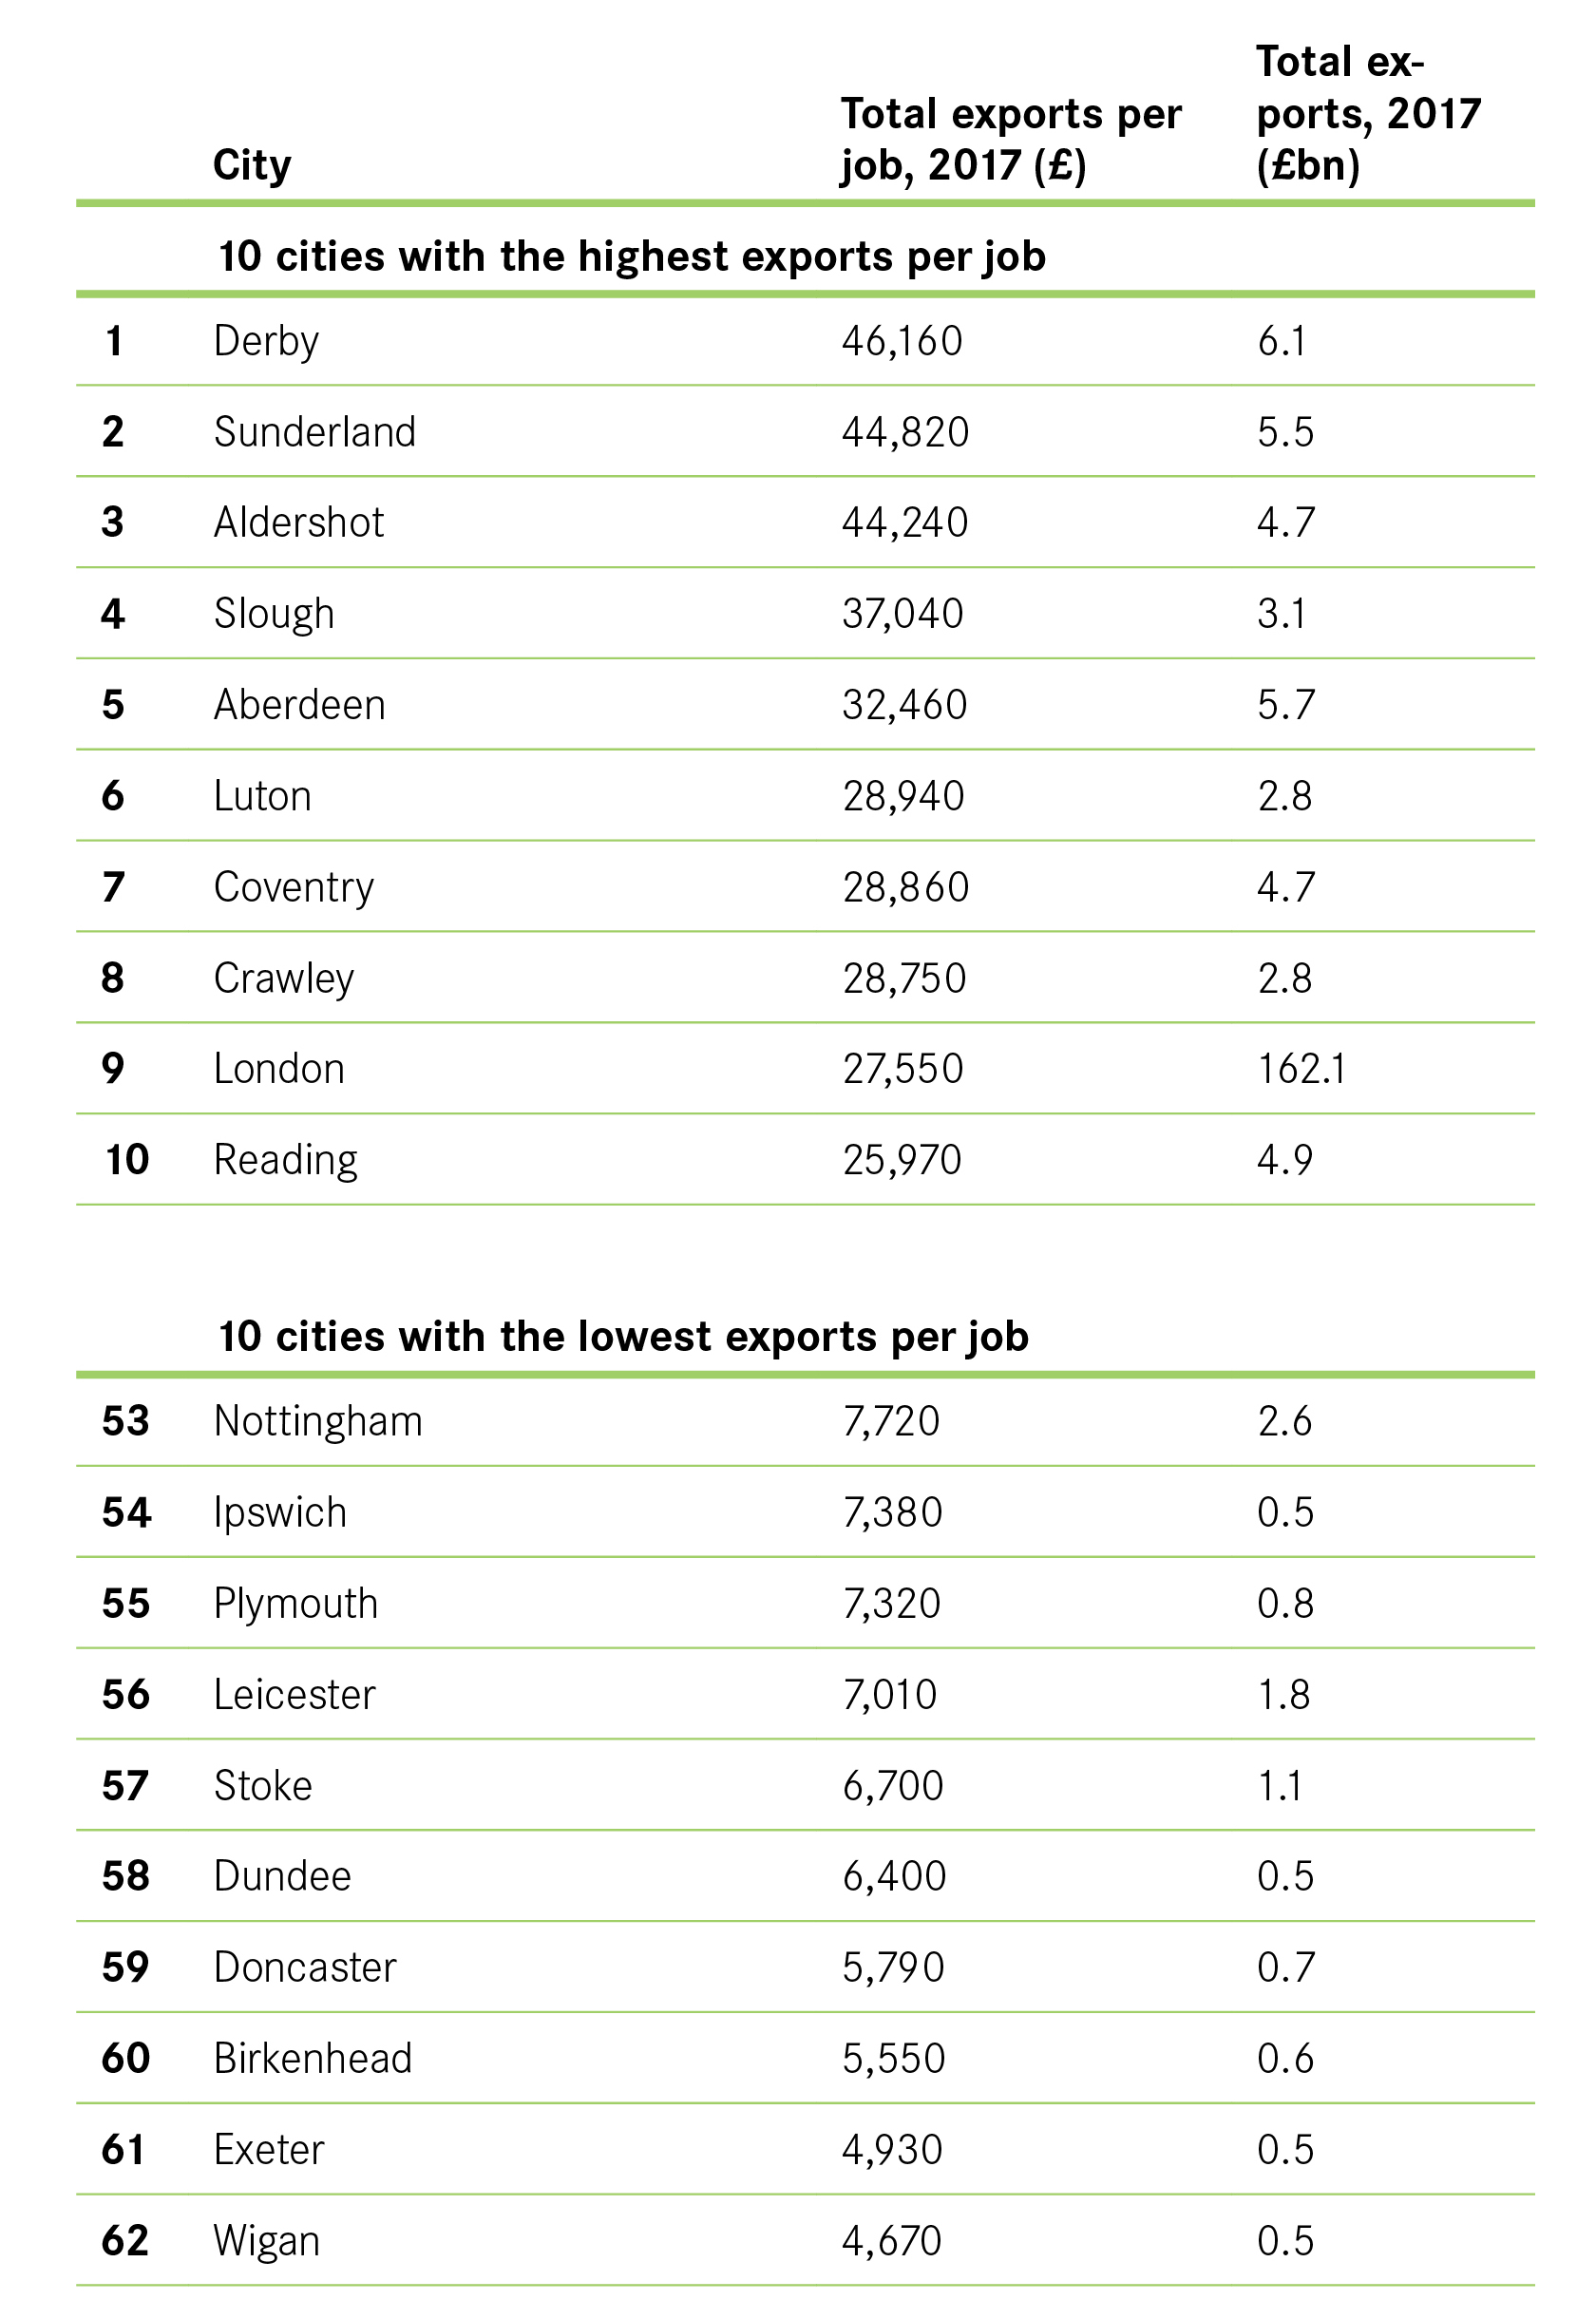
Figure 2: Exports per job
Services exports play a larger role in southern cities
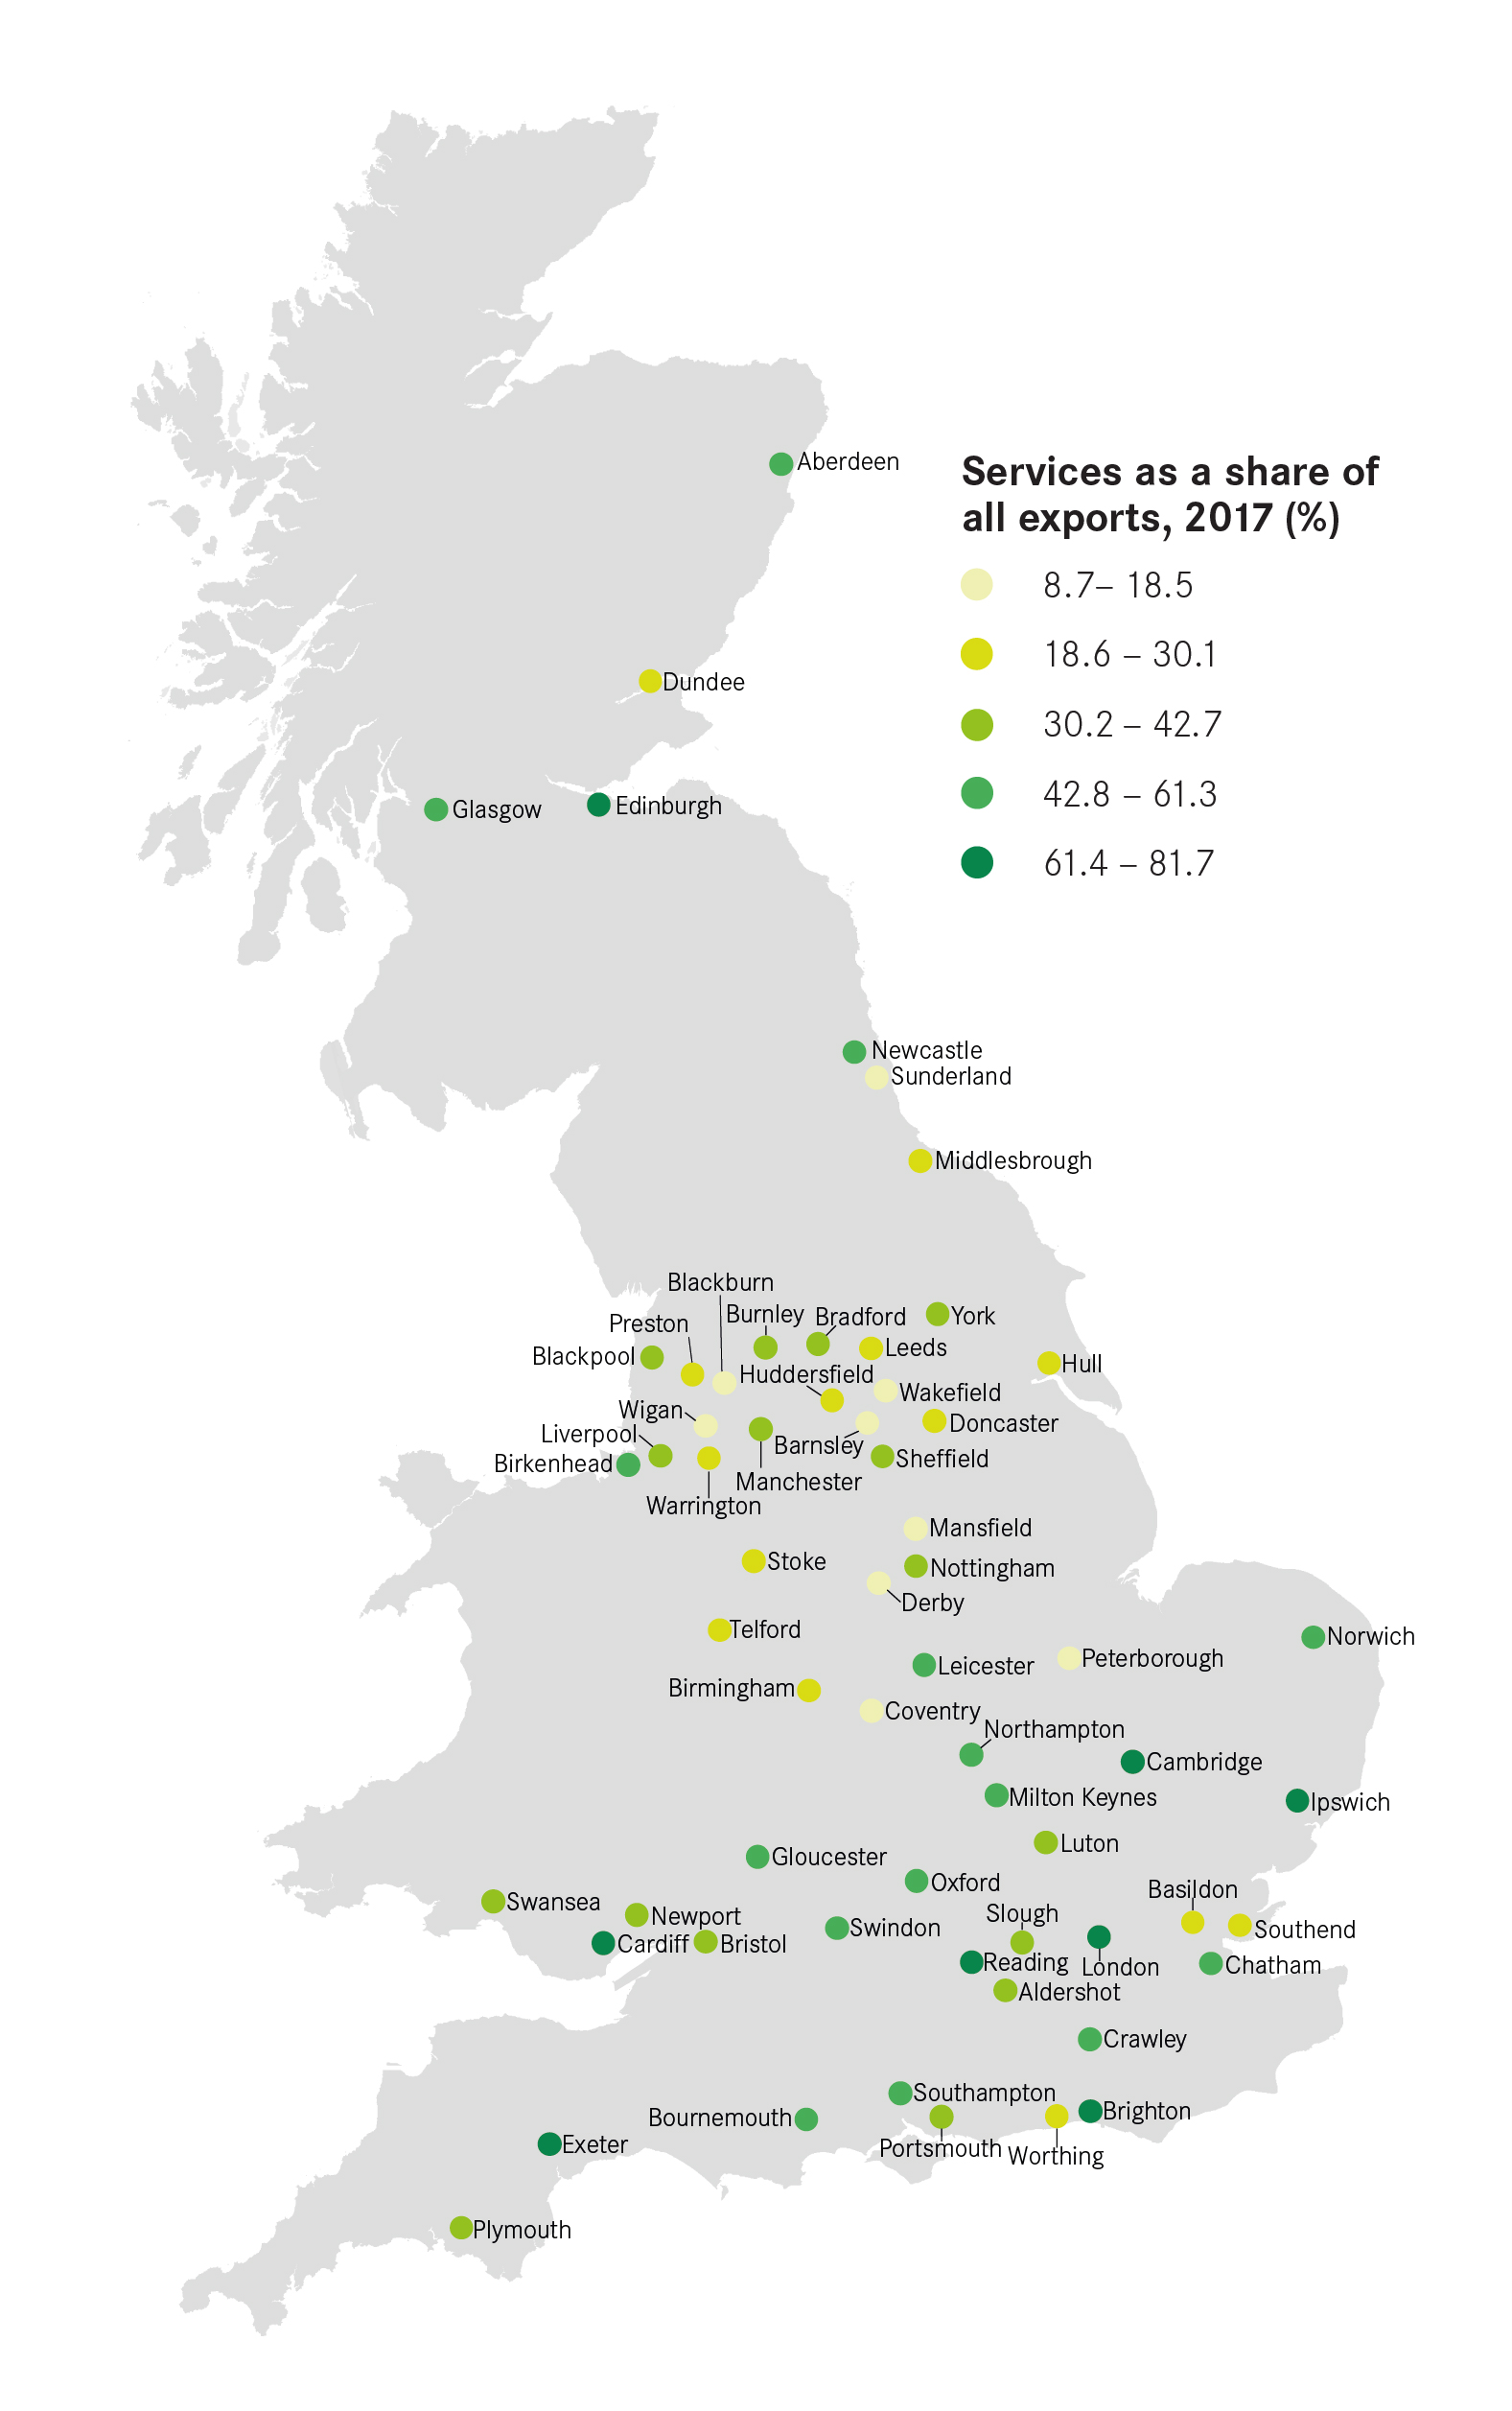
The contribution of goods and services to total exports varied across cities. Goods exports tended to dominate in cities in the North and Midlands. This was greatest in Derby and Sunderland, where around 90 per cent of exports from these two cities were goods. Meanwhile, southern cities tended to have a much greater reliance on services (see Figure 4). The main exception was Edinburgh – the city most reliant on services exports – where 82 per cent of exports were services. Figure 3 looks at the top services-exporting cities.
Box 1: Top services-exporting cities
Services exports per job (i.e. the total amount of services sold abroad relative to all jobs in a city) tended to be much higher in southern cities than elsewhere in Britain. At £20,700 for every job in the city, London had the highest output. Only three cities outside the South appear in the top 10 (see Figure 4). Wakefield had the lowest services output per job, with eight of the bottom 10 cities being in the North or Midlands.
Figure 3: Services exports per job
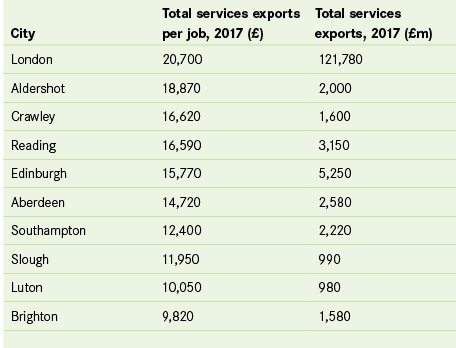
Figure 4: Services as a share of all exports
In some cities single industries account for the majority of exports
For most cities, their exports are generated by a range of industries. In total 28 cities had less than one-fifth of their exports concentrated in one industry. Wigan was the city that had the most diversified export base, with its top exporting industry accounting for just 8 per cent of exports.
Figure 5: The largest single sector contributor to total exports

But as Figure 5 shows, a handful of cities are heavily reliant on one industry for their exports, which leaves their export base particularly vulnerable to changes in either demand for that product or a change in any trade agreements. Derby leads this list. Its impressive export performance was driven by power generating equipment, which accounted for 74 per cent of all of the city’s exports. It is closely followed by Sunderland, with 67 per cent of its exports in road vehicles. Without auto manufacturing, Sunderland would have had the 23rd highest exports per job of all cities, rather than the second highest.
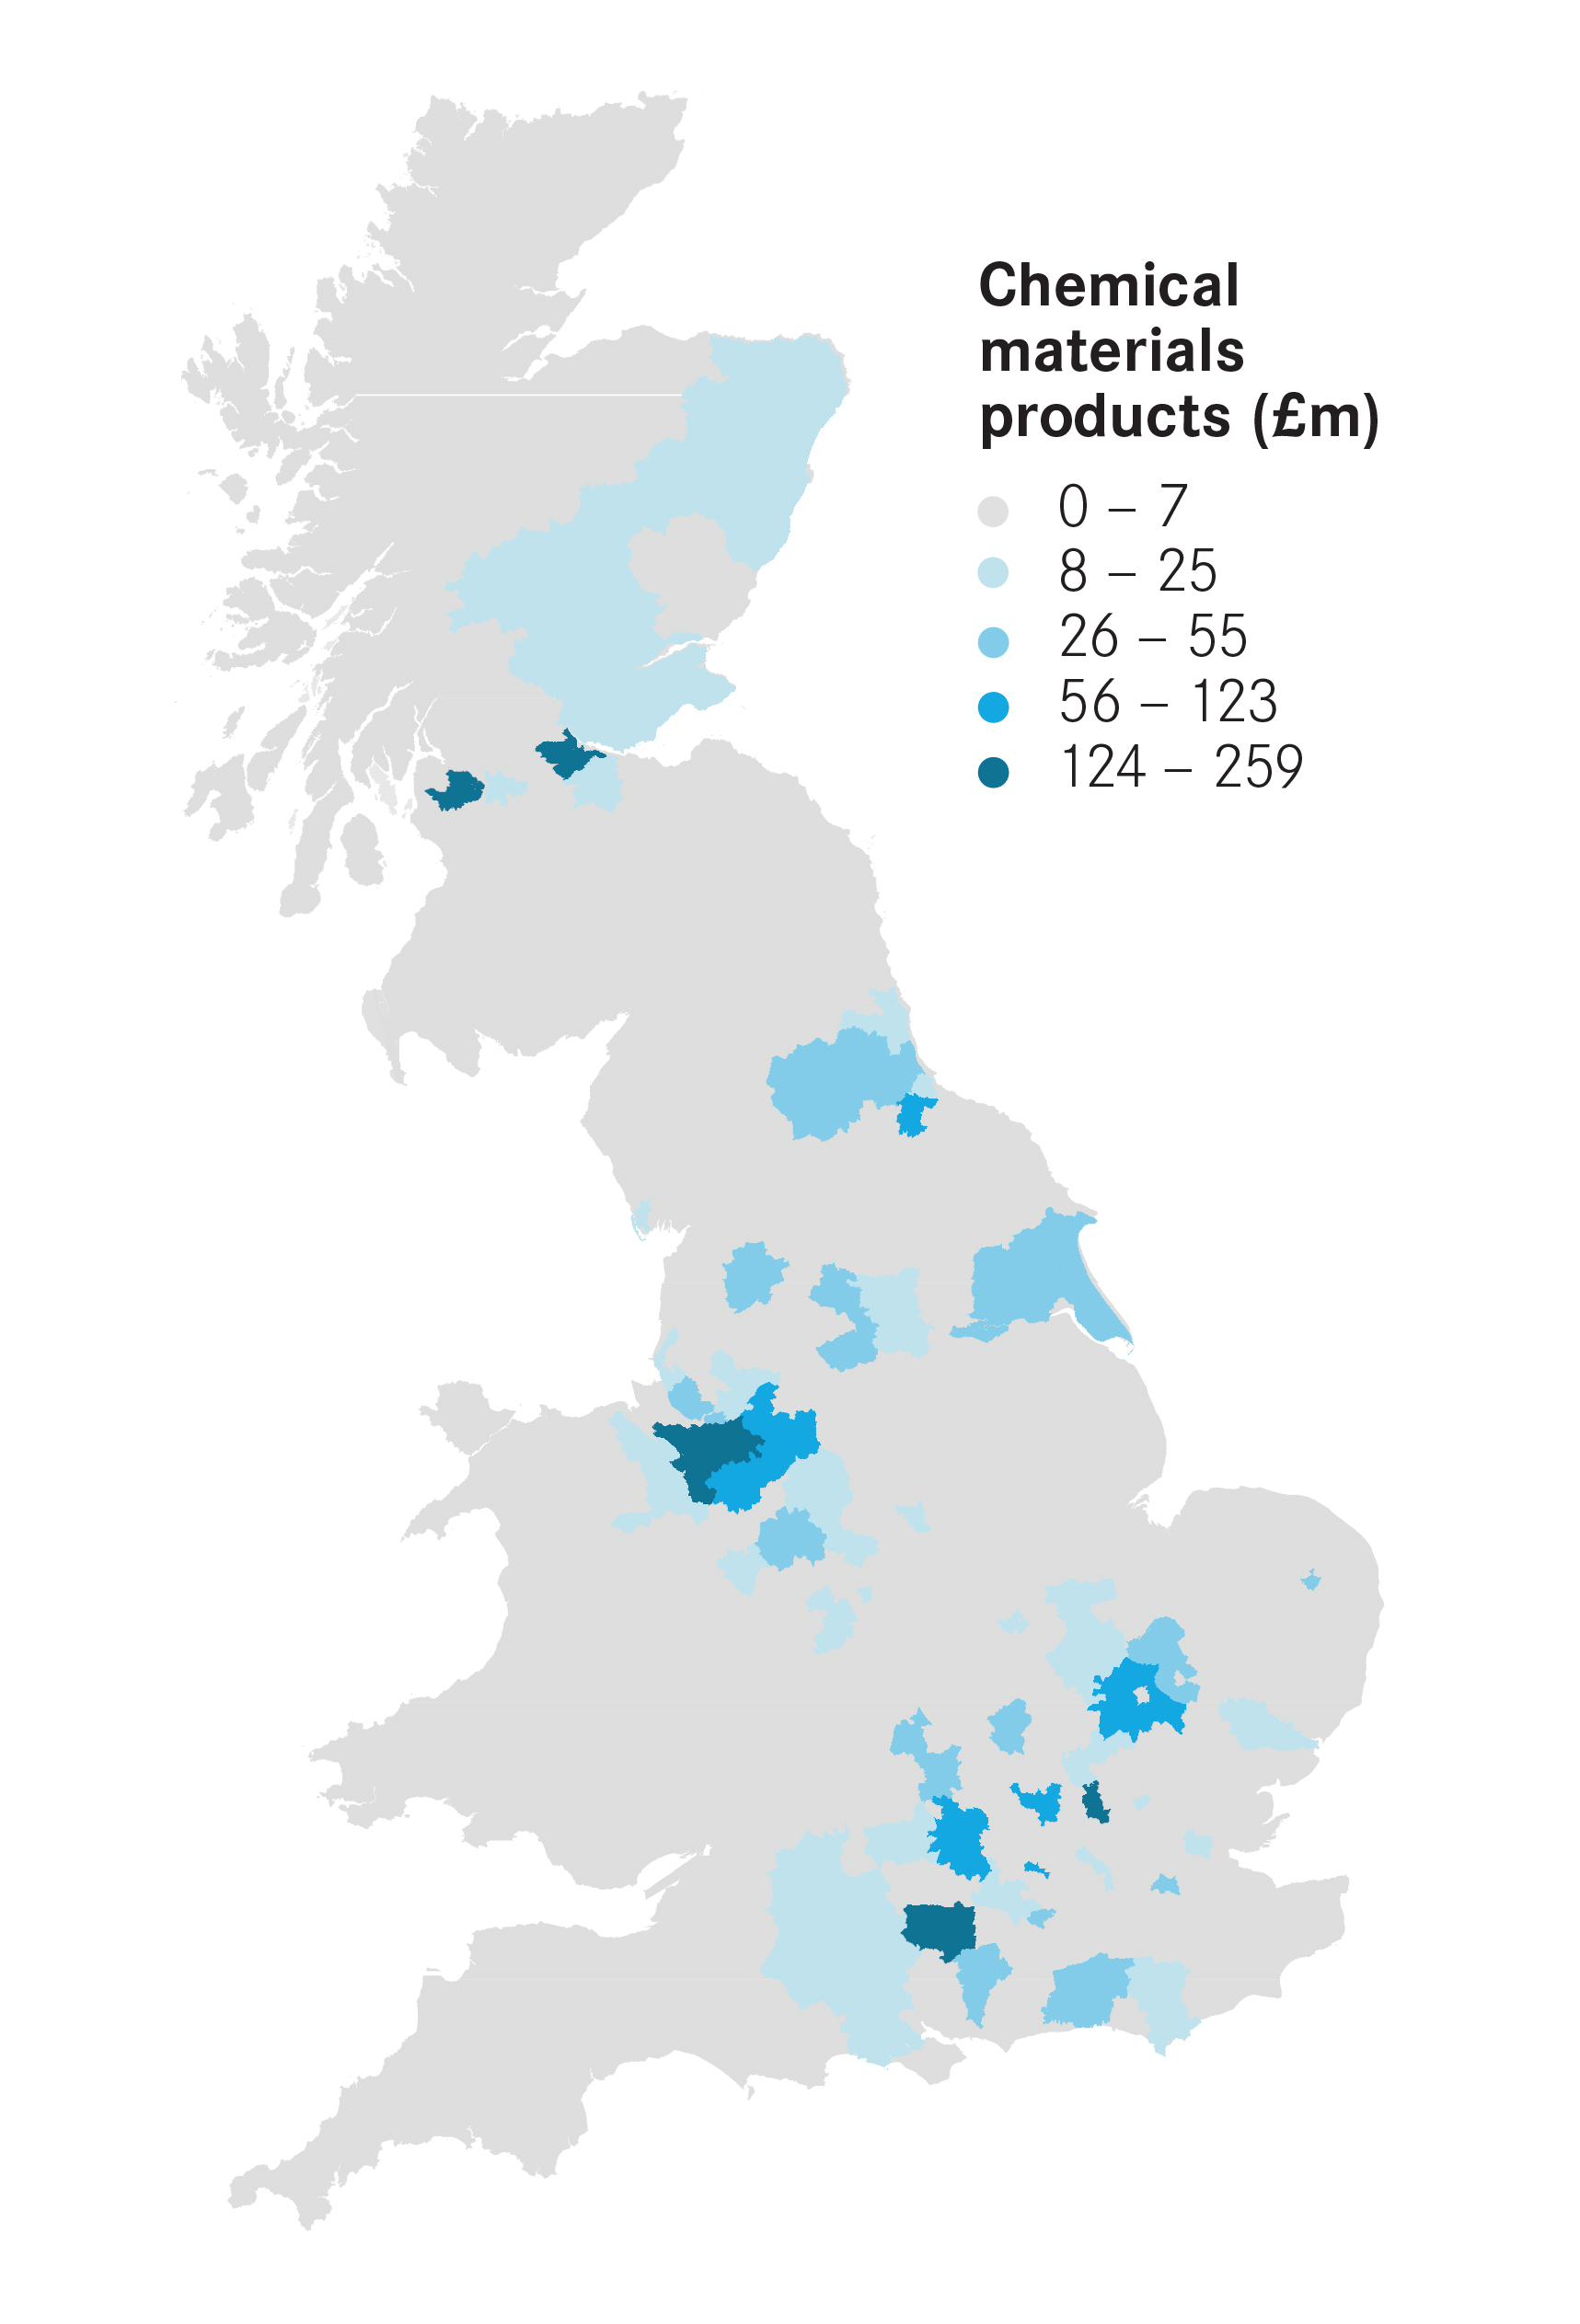
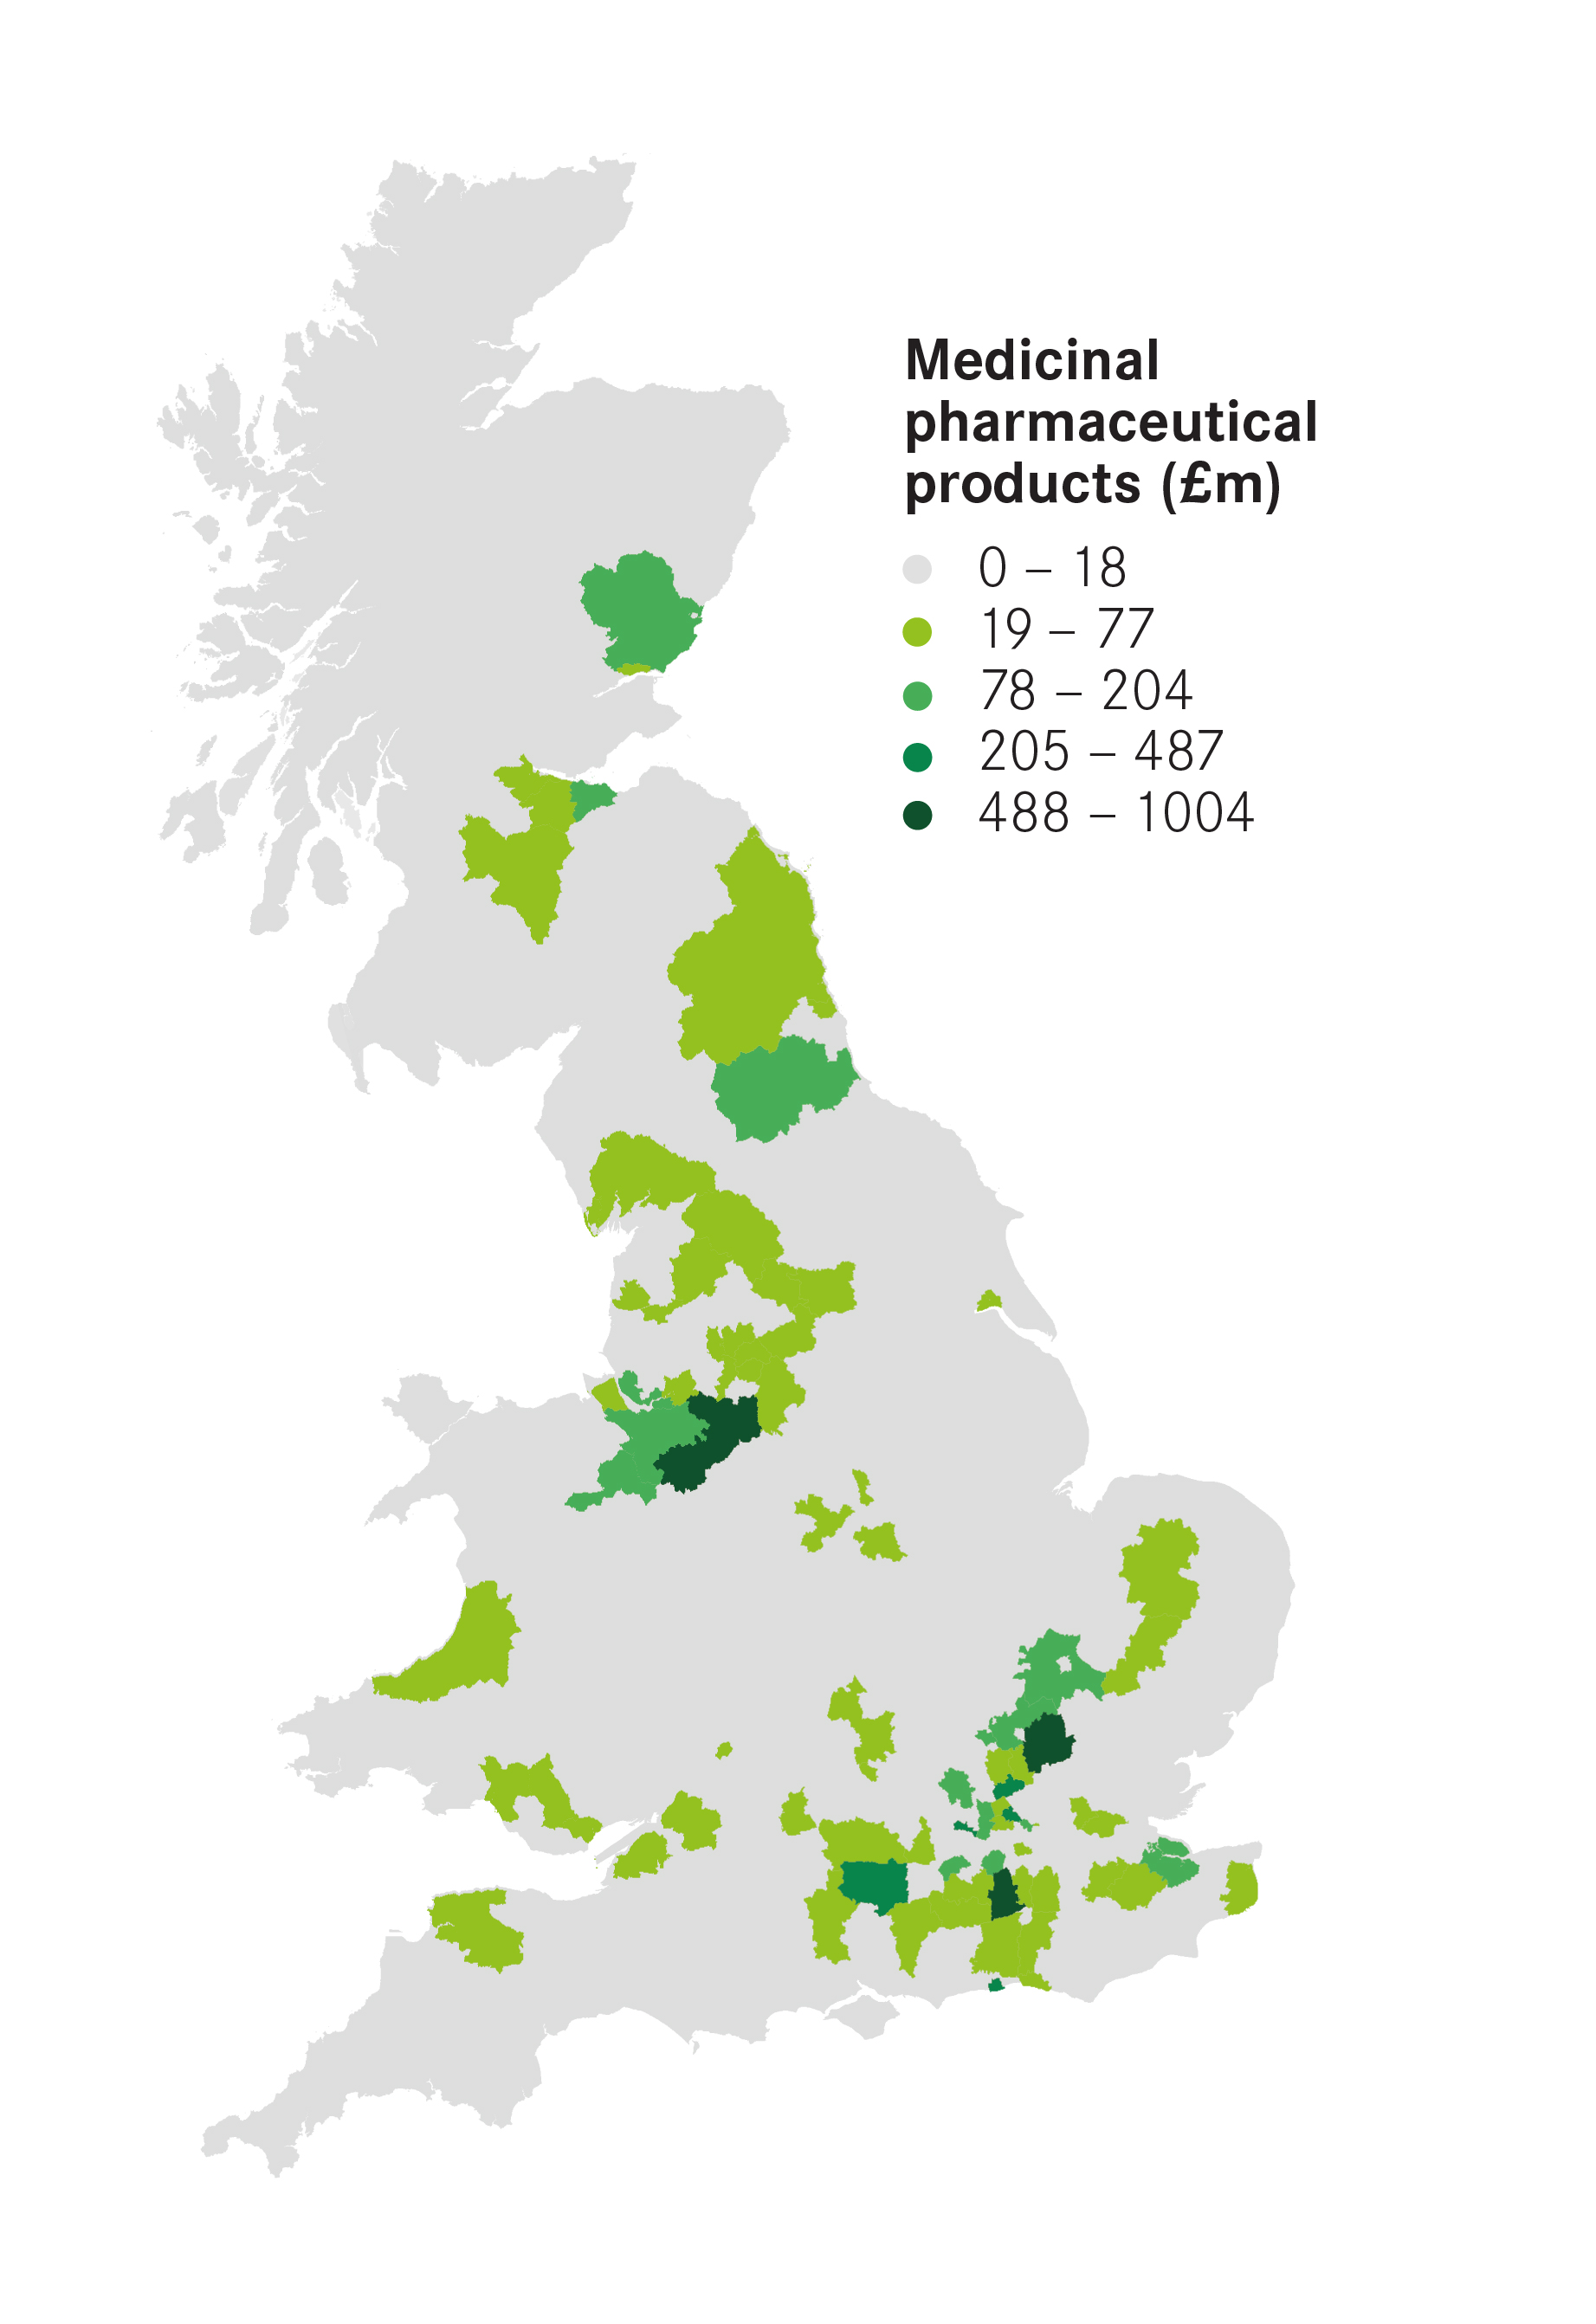
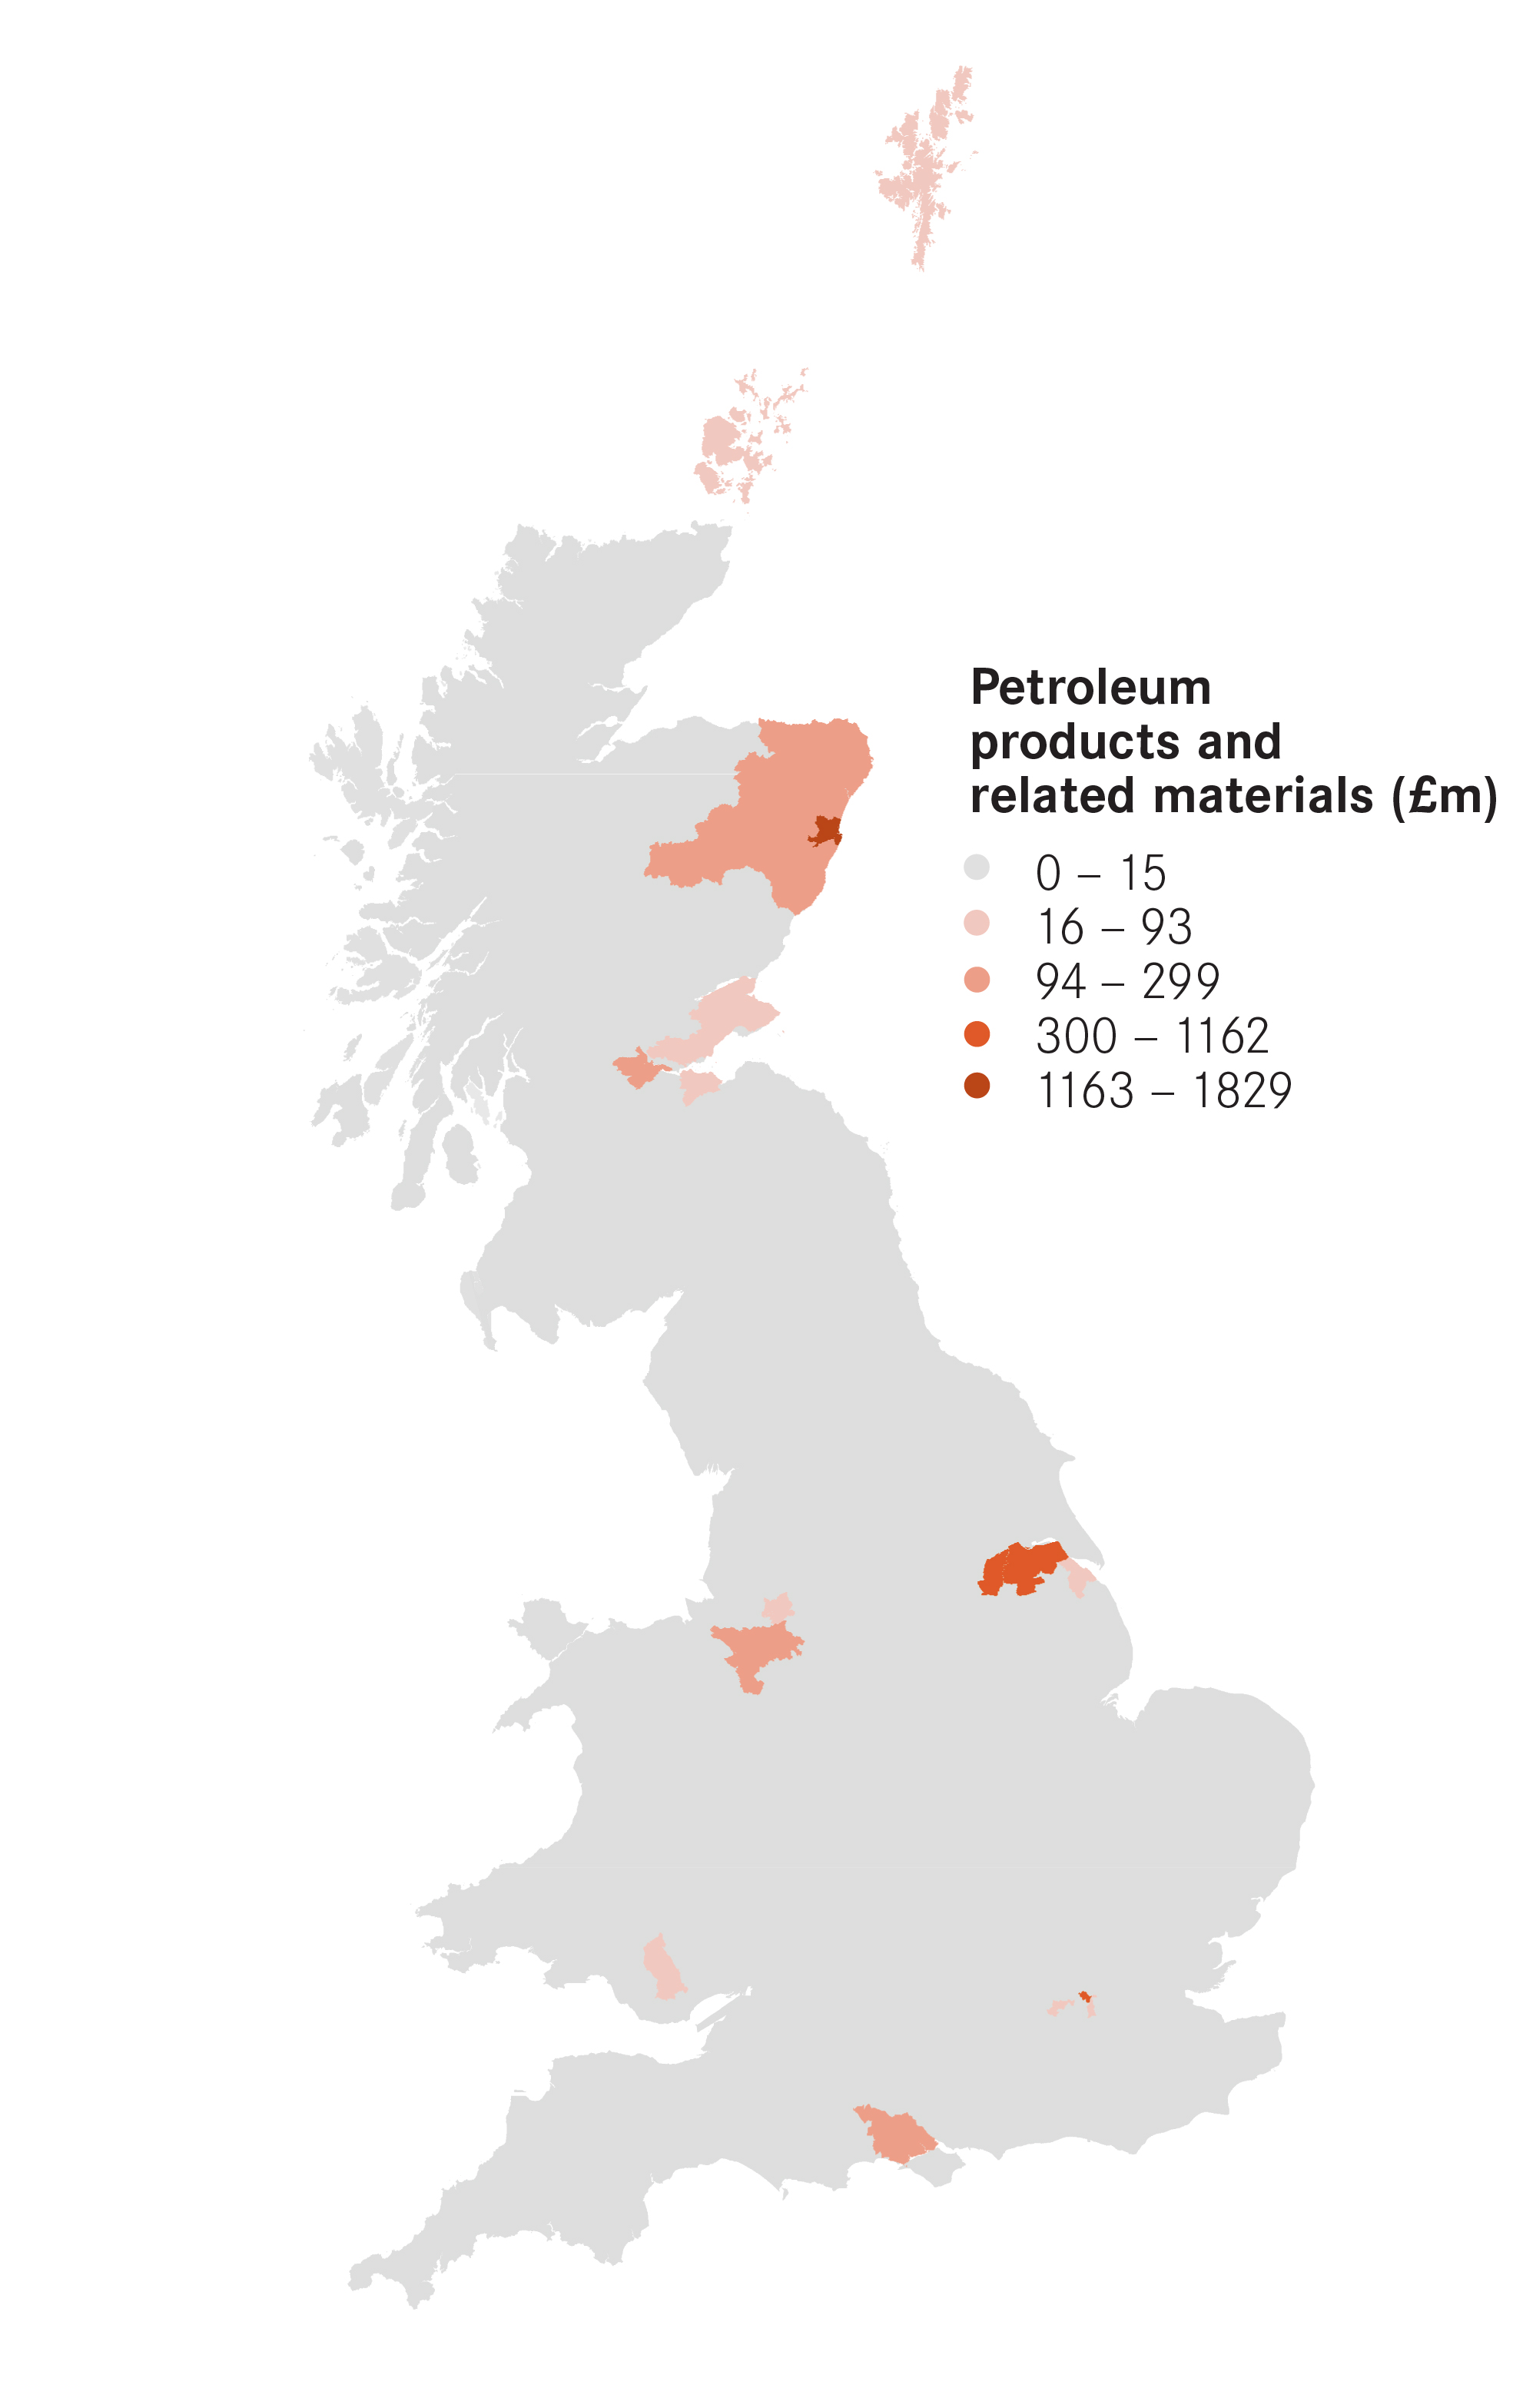
The dominance of some industries in particular cities reflects their concentration in particular places. Figure 6 shows the geography of chemicals, petroleum, pharmaceuticals and road vehicles exports. As can be seen, they were produced in a very small number of places across Britain.
Figure 6: The location of exports from selected industries

The EU is the largest market for almost all cities
Of course, knowing where these exports are sold to is also vital, particularly as the Britain’s trading relationship with the EU changes, and it looks to grow relationships with emerging markets such as China and India.
Figure 7: Selected destinations of exports from British cities
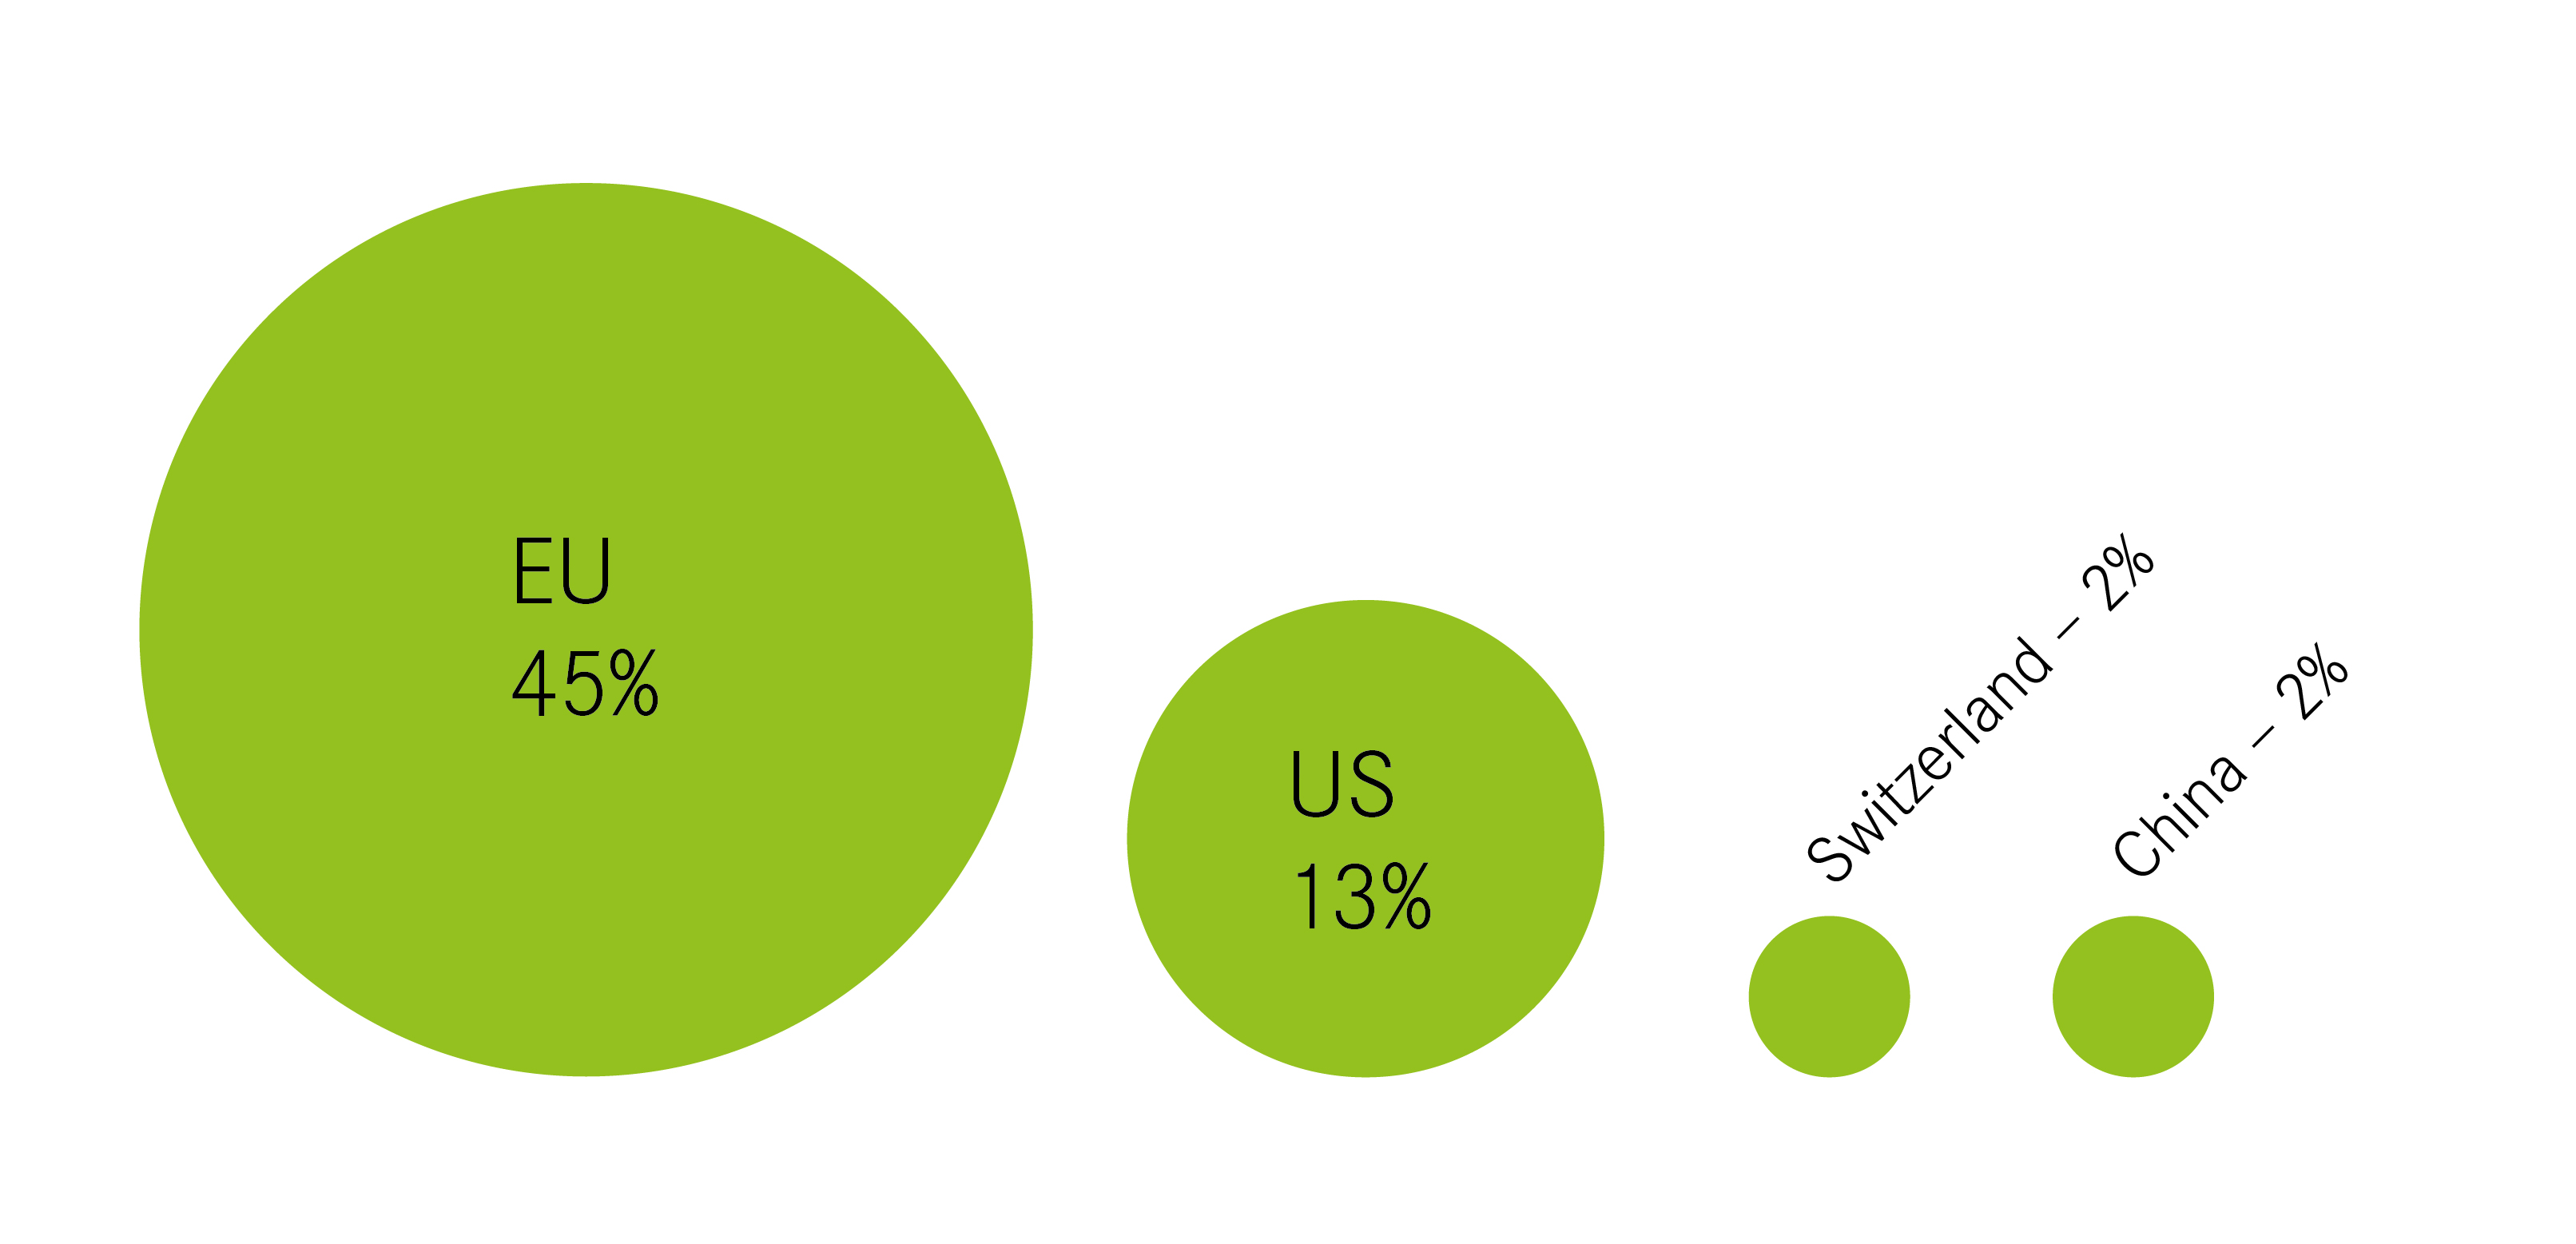
The EU is by far the biggest destination for exports from British cities. EU countries accounted for 45 per cent of Britain’s urban exports – more than three times the share of the USA. The third- and fourth-largest export markets for British cities were Switzerland and China respectively – though these accounted for only around 2 per cent each of British cities’ exports.
The importance of the EU as the primary market for exports holds across most cities. In 19 of Britain’s 62 cities, more than half of exports headed to the EU (see Figure 8). The EU was the largest export market for every city in Britain.
Figure 8: Share of exports to the EU

Telford’s exports were the most dependent on the EU, with 70 per cent of all of its exports going to EU countries. It was followed by York and Wakefield.
Aberdeen, on the other hand, was the least dependent, with just 30 per cent of its exports going to EU countries. China was instead a much more important source of custom for Aberdeen than in other cities. Exports to China accounted for 17 per cent of all of the city’s exports, the highest of any city. A key driver of this was the city’s strength in petroleum products. Meanwhile, Coventry was the city second-most reliant on China, with 13 per cent of all of its exports heading there (predominantly road vehicles).
Figure 9: Dependence on foreign markets: selected destinations

The US bought the largest share of Derby’s exports, with almost a quarter of the city’s goods and services heading across the Atlantic. Derby was closely followed by Gloucester on this measure.
Derby is also the city that exports the most to the Commonwealth countries.2 Some 12 per cent of the city’s exports went to Commonwealth countries, with more than half of this falling into the category of “other transport equipment”.