
02The nature of migration within England and Wales
Many millions of people have moved between regions within England and Wales in recent years. Between 2009 and 2015, 8 million people moved from one part of England and Wales to another, with over 1 million people choosing to make a significant geographic move each year.5
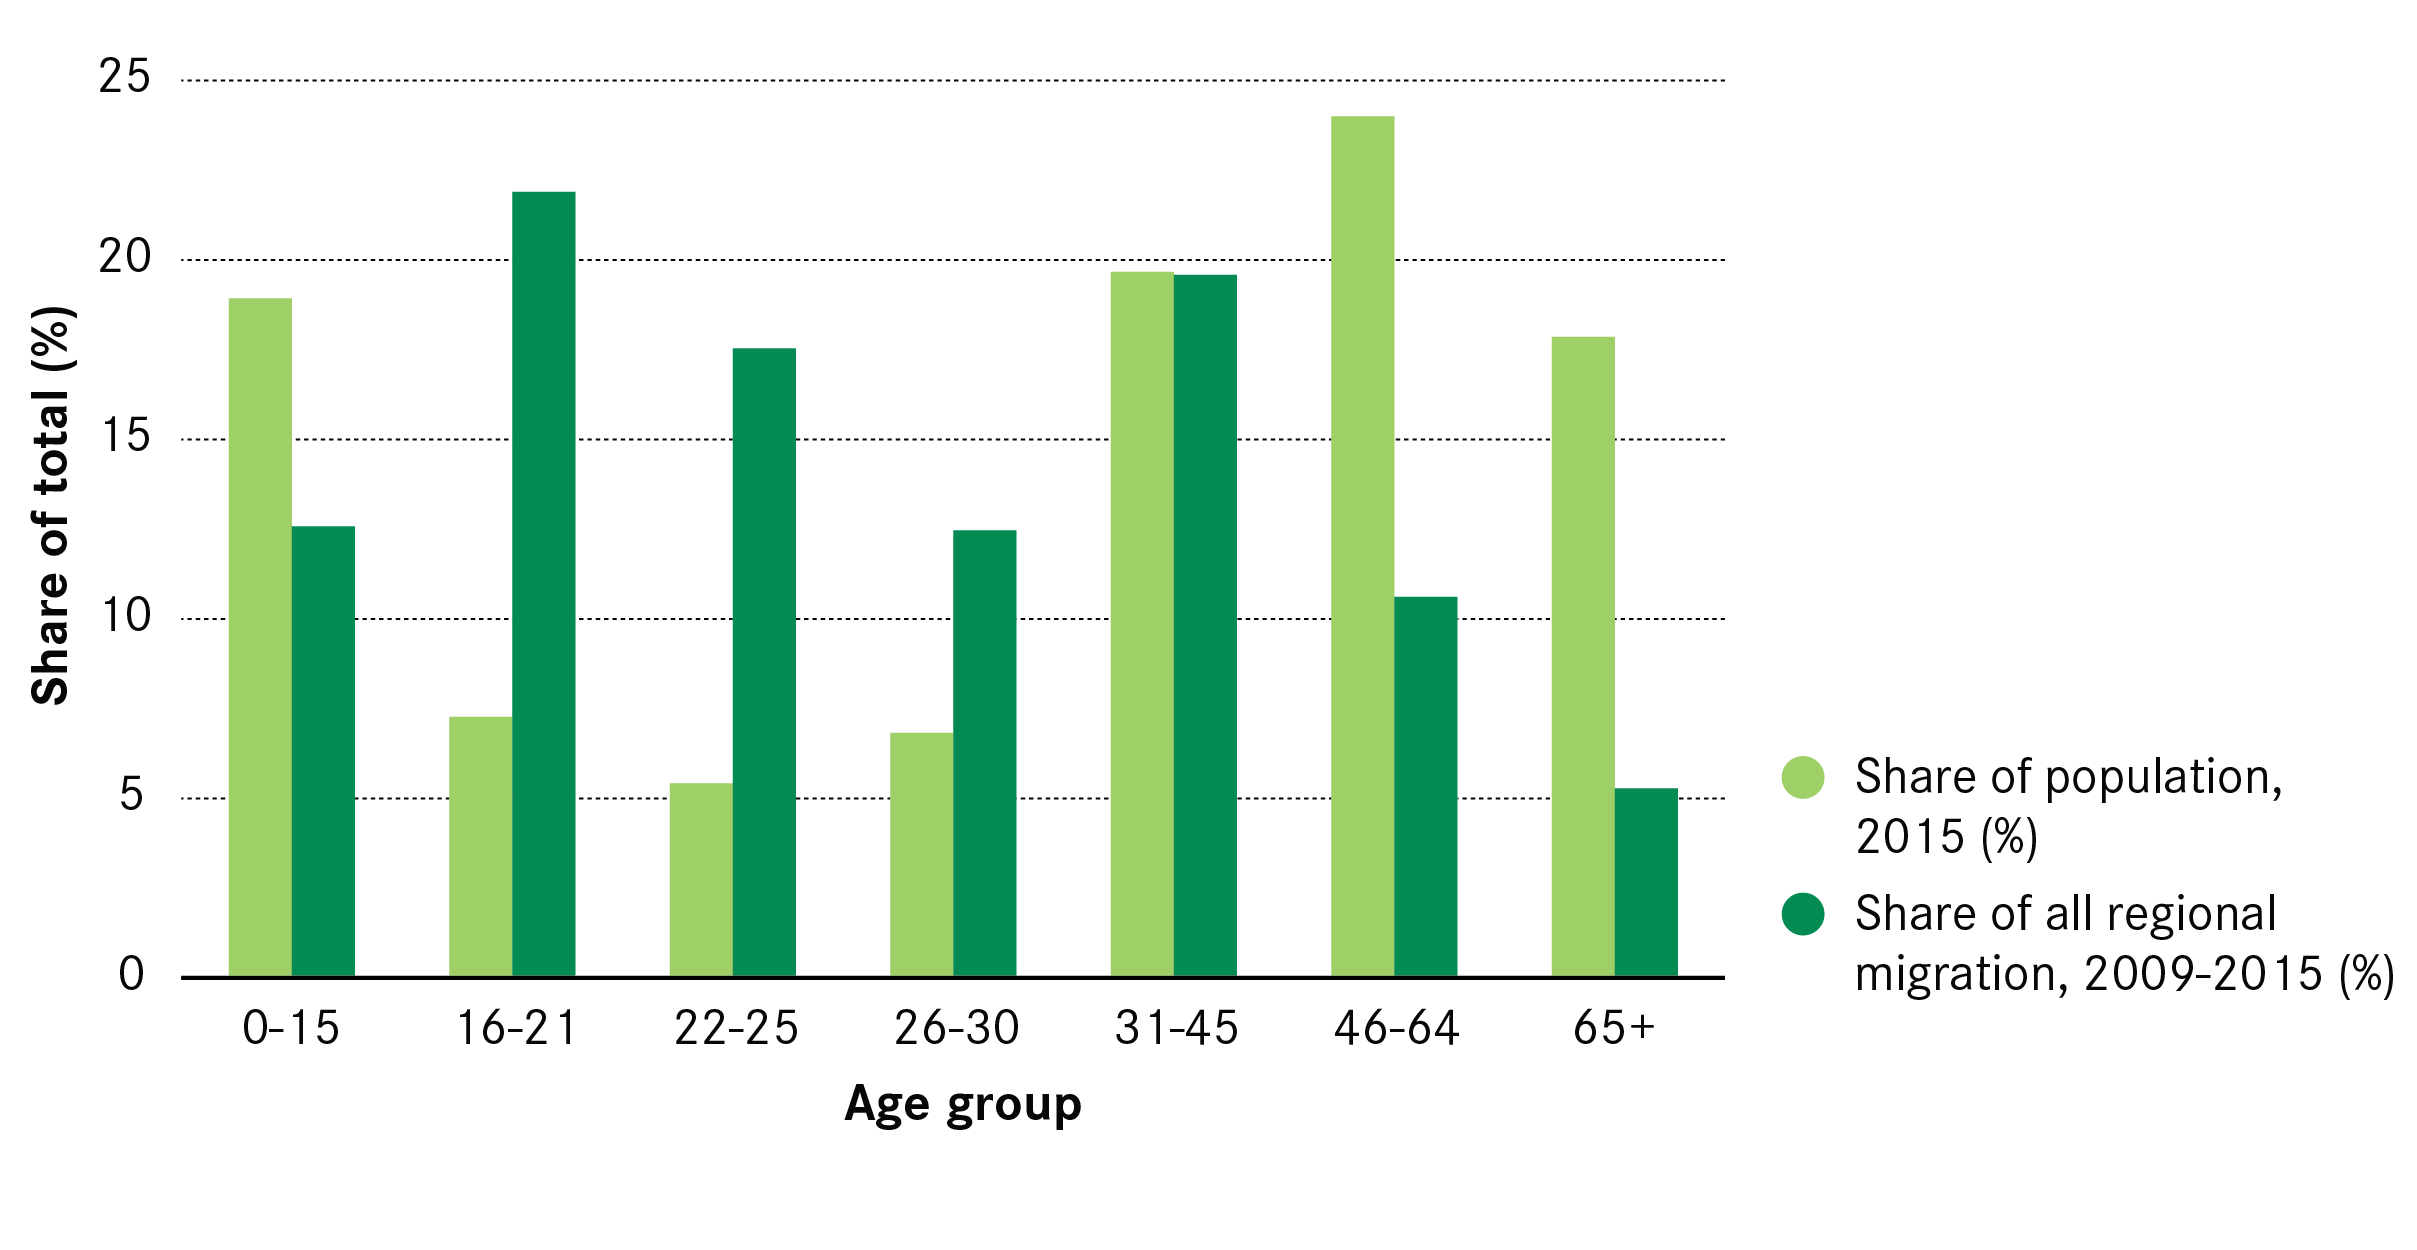
These movers tended to be much younger than the population overall. As Figure 1 shows, over half (52 per cent) of these movements were made by people aged 16 to 30, despite them only accounting for 20 per cent of the English and Welsh population in 2015. Of this, 16 to 21 year olds made up the largest share of migration, accounting for 22 per cent of the total, (compared to just 7 per cent of the total population). Meanwhile those aged 46 and over made up much smaller shares of movers than their corresponding share of the population.
Figure 1: Migration by age group, 2009-2015
Migrants tend to be more highly skilled than the population overall. While standard ONS data on migration does not give information on the qualifications of migrants, the 2011 Census does allow us to look at this data for movers between 2010 and 2011.
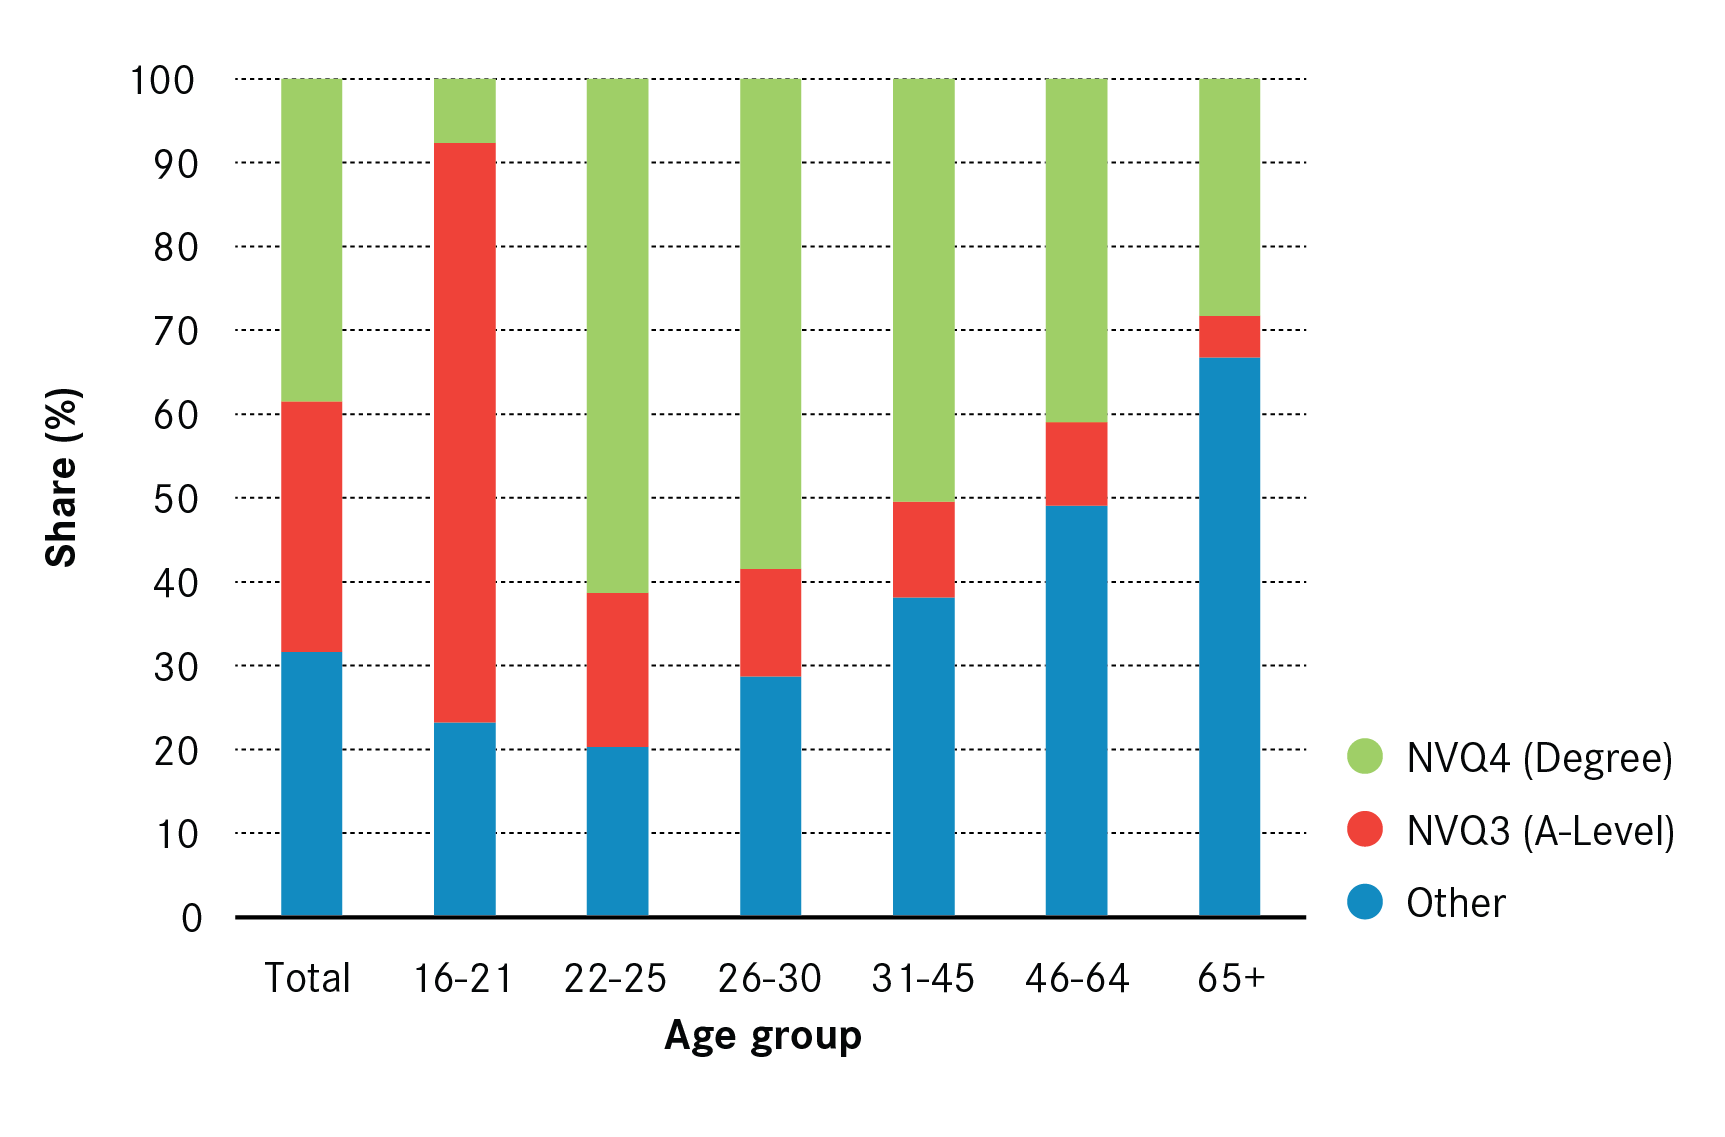
In 2011, 27 per cent of people over 16 had a degree. But for those who moved, this share was 38 per cent. As Figure 2 shows, this was even higher for younger migrants – for those aged between 22 and 30, 57 per cent had a degree. Meanwhile 30 per cent of movers had A-level or equivalent qualifications, relative to 12 per cent of the population overall. This is especially apparent for the 16 to 21 age group, many of whom are likely to have been moving to go to university.
Figure 2: Qualifications of movers by age, 2010-2011
Where these movers go tends to depend on the highest qualification they achieve. Figure 3 groups cities into four categories – London, large cities, medium-sized cities and small cities.6 It shows that overall, London loses population to the rest of England and Wales, while as a group large and medium cites gain population overall.
Figure 3: Destination of movers by qualification for city groups, 2010-2011
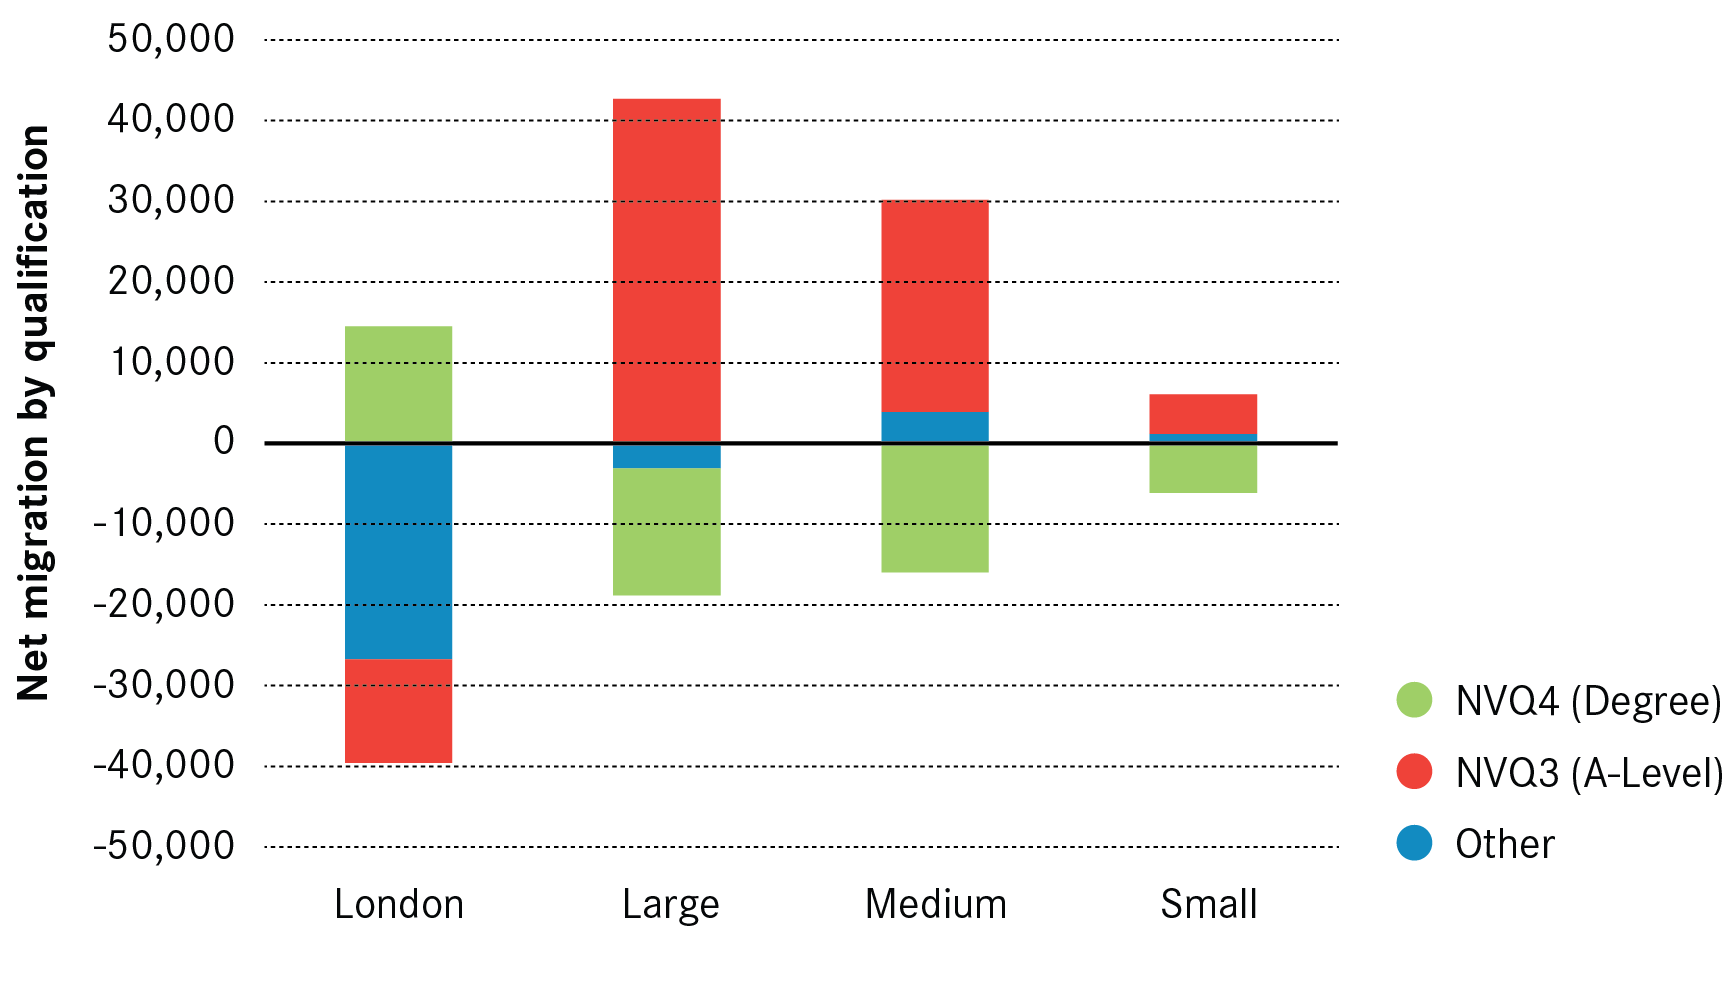
But looking at qualifications gives an important nuance to the story. While London loses population overall, it experiences a net gain of people with a degree, while the majority of its net population loss is made up of people whose highest qualification is five good GCSEs or equivalent.
All other city groups see a net loss of degree holders. Instead their overall net inflows of movers are driven by those that hold A-levels or equivalent – many of whom are moving for university (investigated in the next section). Excluding London, just 14 cities had a net inflow of degree holders. And of these 14, eight were located in the Greater South East (see Figure 4).
Figure 4: Net inflow by qualification for individual cities, 2010-2011

Migration patterns also vary with age. Figure 5 shows three key changes in the flow of movers according to their stage of life:
- Large, medium and small cities saw a net inflow of people aged 16 to 21, with this being clearest for large cities. The vast majority of these migrants were educated to A-level or equivalent, once again pointing to an inflow of university students. London, on the other hand, saw a net outflow.
- This trend reversed for those aged between 22 and 30. Degree-educated movers led the charge, with London seeing a large net inflow and other cities seeing a net outflow.
- For movers aged 31 to 45 the position changed again, with all cities seeing a net outflow. This again was led by degree holders. But while they quit the city, these people did not move far – for the vast majority of cities, over 50 per cent remained within the same region.
Figure 5: Net inflow by age and qualification for city groups, 2010-2011

Previous Centre for Cities research suggests these moves are related to lifestyle choices. Young students and professionals tend to live in cities to be close to restaurants, leisure and cultural facilities, to public transport, and to their workplace. People living in suburbs tend to be over 30 with children and live there because of the cost, size and type of housing, to be close to good schools, and because of the safety and security of the neighbourhood. Those living in rural areas tend to be over 55 and live there to be close to countryside and green spaces.7
Summary
The findings in this section highlight three important characteristics that define migration within England and Wales:
- Internal migration in England and Wales is relatively large. Over one million people a year move from one region to another.
- Those moving tend to be young and higher skilled. A significant share of migration is accounted for by those aged between 16 and 30 and those moving tend to have A-Levels and degrees.
- Older degree holders move out of cities but not out of the region. This means that they still live within a commutable distance of the city they leave.
Given the higher skilled nature of migration, and the important role that universities play as catalysts for this migration, the next section looks in more detail at the migration of students and new graduates.
It uses the Higher Education Statistics Authority (HESA) survey of its graduates to find out where they are working six months after they leave university and combines this data on the destinations of graduates for 2013/14 and 2014/15 with data on all students at university in 2014/15. Unlike the Census and ONS internal migration data above, this data covers the whole of the UK.