
034. The nature of the new graduate workforce
The majority of Norwich’s graduate workforce studied in Norwich
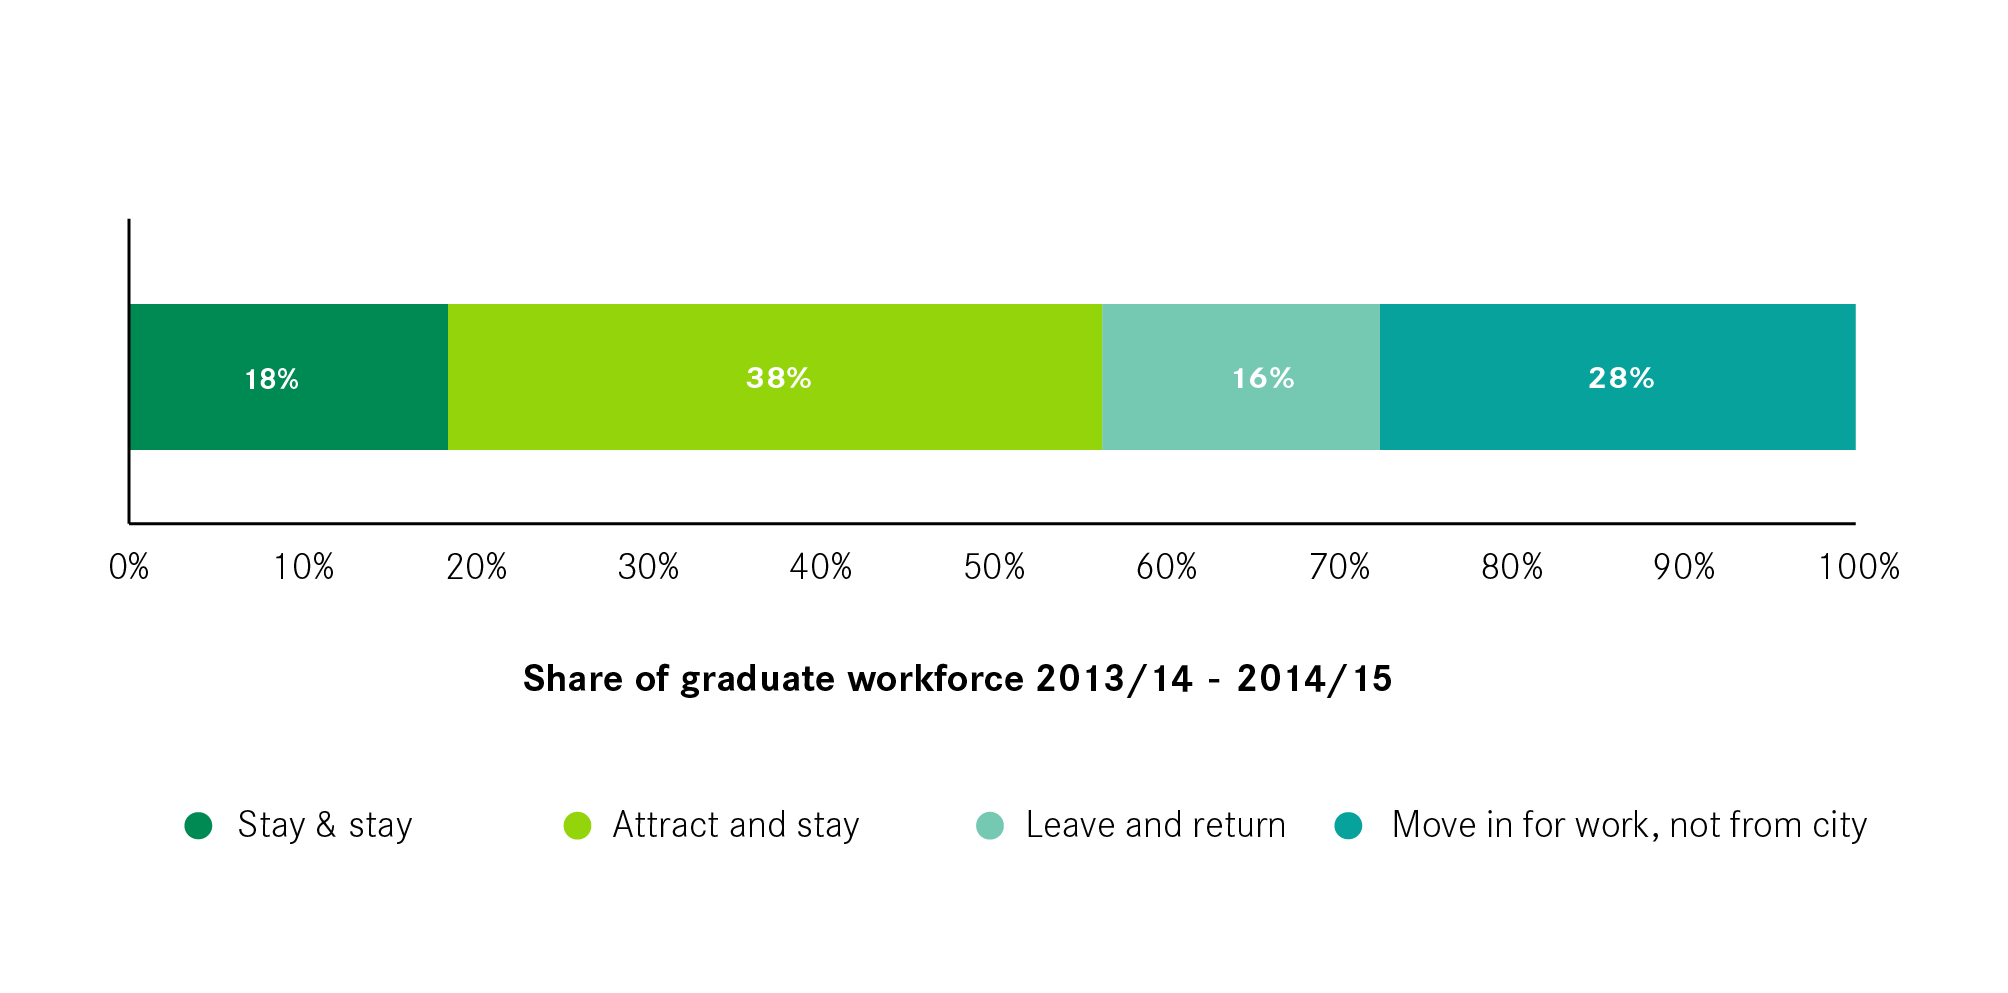
Figure 18 brings together all graduates who decided to work in Norwich after leaving university to provide an overview of the nature of the graduate workforce in the city. It shows that 18 per cent of all workers were home-grown: growing up, studying and subsequently working in Norwich. Meanwhile 38 percent of workers had come to the city to study and stayed on for work.
There is a caveat to make here. While those attracted in to work made up a large share of the overall new graduate workforce (the 3rd highest of all cities), this is in part a result of the small contributions that the other categories of new graduates made to the Norwich new graduate workforce. To put this in perspective, of all the students that moved to the city to study, only a fifth remained to work after graduation (the 15th highest among UK cities).
Figure 18: The components of the new graduate workforce, 2013/14 -2014/15
In terms of the class of degree achieved, the composition of Norwich’s graduate workforce is somewhat different from the UK as a whole. Only 7 per cent of graduates working in Norwich had a first or upper second class degree from a Russell Group University; for the UK as a whole the figure is 16 per cent. Meanwhile the city had a considerably higher share of non-Russell Group graduates with a first or upper second class degree.
Figure 19: Share of working new graduates by class of degree, 2013/14-2014/15

Norwich has the lowest average graduate salary in the UK
Graduates working in Norwich earned on average £19,740 a year, the lowest among UK cities, and considerably behind Leeds on £20,700 — the second lowest city in terms of graduate wages. The average graduate salary in the UK was £23,100, and highest in Aberdeen at £26,900. That said, analysis of UK graduates finds that wages were not the main reasons why graduates choose their employment location. Other factors such as the type of jobs available in that city and the opportunities for career progression were more important.2
Figure 20: Mean graduate wages of each UK city, 2013/14 – 2014/15
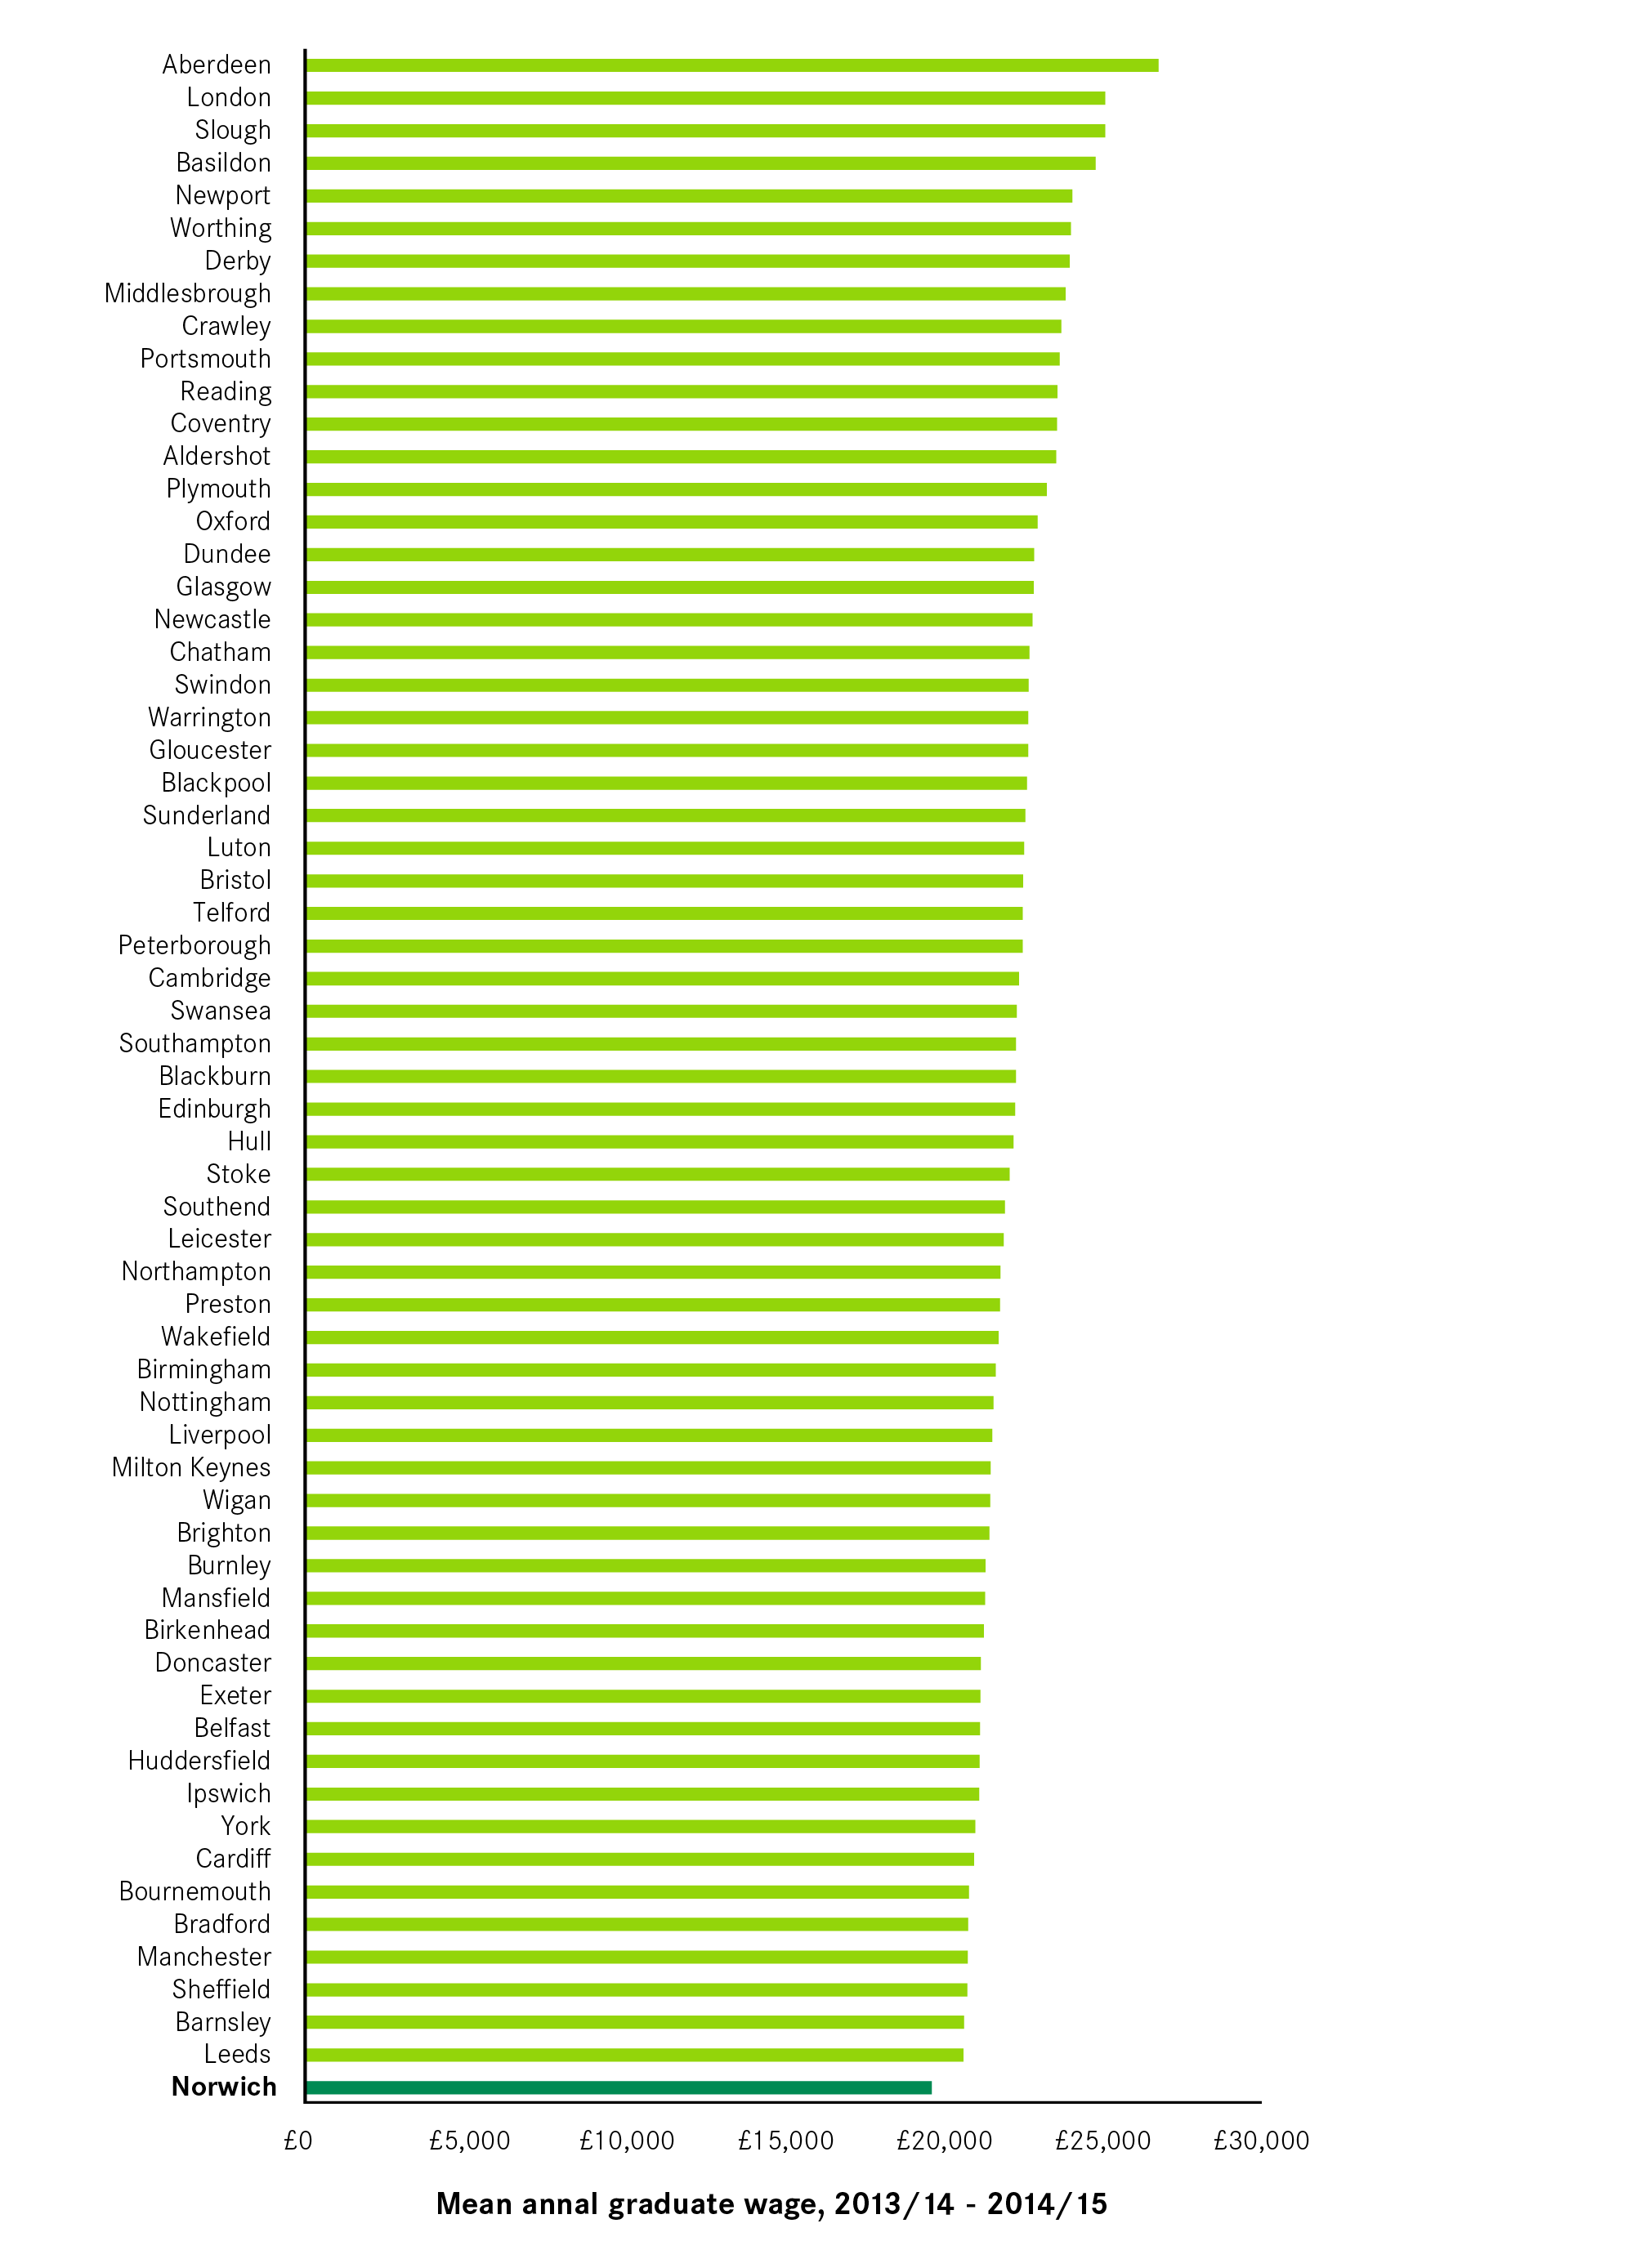
Figure 21 shows the average salary for graduates from the two universities. NUA graduates had lower salaries than those from the UEA, especially if they remain in Norwich. Graduates from both universities on average earned more if they moved away from Norwich.
Figure 21: Mean graduate wages by institution and location of employment, 2013/14 – 2014/15
| University | Average salary of graduate (£) | Average salary of graduates employed in Norwich (£) | Average salary of graduates employed elsewhere (£) |
|---|---|---|---|
| University of East Anglia | £21,360 | £20,330 | £21,630 |
| Norwich University of the Arts | £15,810 | £14,290 | £16,600 |
The share of new graduates in KIBS jobs is the same as the national average
But while wages can play a role in the graduates’ decision of where to work, research shows that it is the job opportunities and career progression that matter the most. Cities that gained the largest number of graduates were the ones with a high share of knowledge intensive business services (KIBS) jobs and a low share of jobs in publicly-funded services.
When looking at the industry breakdown of the graduate workforce, Norwich is performing at around the national average. Figure 22 shows that 15 per cent of new graduates in Norwich were employed in knowledge intensive businesses. This was the 16th highest among UK cities. At 44 per cent, the publicly-funded services sector was the most popular employer of new graduates. But this was lower than the UK average and the 11th lowest among UK cities. The other private services sector employed 35 per cent of the new graduates in Norwich – the second highest among UK cities.
Figure 22: Share of graduates in Norwich working in each sector, 2013/14 – 2014/15

Looking at a finer industrial breakdown shows that in publicly-funded services, 22 per cent of all new graduates worked in education and 13 per cent in health. In other private services, 8 per cent of all new graduates worked in retail, the 10th highest among UK cities. In the KIBS sector, insurance accounted for 4 per cent of all new graduate jobs.
Norwich has the lowest proportion of new graduates working in high-skilled jobs of all cities
While the industries that graduates in Norwich worked in looked very similar to the national average, the types of jobs they worked in varied. Figure 23 shows that 68 per cent of new graduates in Norwich were employed in high-skilled occupations — the lowest share of graduates in high-skilled occupations among UK cities. Swindon, with 82 per cent, had the highest share of graduates in this type of occupation. Meanwhile, Norwich’s share of new graduates in low-skilled jobs (17 per cent) was higher than the UK average, and the 3rd highest among UK cities. Oxford, with 6 per cent, had the lowest proportion of new graduates in low-skilled jobs. This partly explains the low wages above.
Figure 23: Share of graduates by occupation types, 2013/14 – 2014/15

Breaking the type of occupation by sector shows that even in the KIBS sector, typically providing well paid-jobs, the share of new graduates working in high skill jobs — 76 per cent — was lower than the national average of 88 per cent. Publicly-funded-services and other private services sectors also had a lower share of high-skilled jobs than the UK average.
Research in the Great British Brain Drain showed that those cities that had the largest graduate gains were the ones that tended to offer the highest share of KIBS jobs. While Norwich has a share of graduates working in this industry equal to the national average, the lower number of jobs on offer in both this type of activity and in other sectors is likely to affect the city’s ability to attract and retain graduates.