
023. A more detailed look at the movement of students and graduates
The data above suggests that universities play a role in the movements of people to and from Norwich. This section explores the specific migration patterns of student and graduates into and out of the city using two data sets from the Higher Education Statistics Authority (HESA). The first looks at admissions (for all students at university in 2014/15 including international students), and the second is based on a survey of graduates six months after finishing university (for leavers in 2013/14 and 2014/15 but only includes domestic students). Unlike the ONS data used above, it covers the whole of the UK.
Box 1: Higher education institutions in Norwich
This analysis covers the two university campuses in Norwich: University of East Anglia (UEA) and Norwich University of the Arts (NUA). In the academic year 2014/15 there were 18,140 students enrolled at these universities, 90 per cent of which were at UEA and 10 per cent at NUA.
Movements of students to university
More than a third of students in Norwich are from the rest of the East of England
Norwich’s universities mainly attract students from their own region. In 2014, 11 per cent of students attending university in Norwich were from Norwich itself, while 35 per cent were from the wider East of England. At 23 per cent, international students represented the next largest group, while 9 per cent and 8 per cent came from the South East and London respectively. On a city basis, London accounted for the largest share of students arriving in Norwich to study.
Figure 8: Origins of Norwich’s university students, 2014/15

Looking at the origins of students by institution, as shown in Figure 9 and Figure 10, while both universities were strongly rooted in East Anglia, the pull of each university differed. UEA had a student body that was more international, with 25 per cent of students coming from abroad, while the figure was 5 per cent of students at NUA. This difference was made up almost entirely from the proportion of students from the Greater South East (which includes the East of England, the South East and London), as 53 per cent of the UEA’s student body came from the region compared to 72 per cent for NUA.
Figure 9: Origins of students at the University of East Anglia, 2014/15

Figure 10: Origin of students at Norwich University of the Arts, 2014/15

Over a third of all students who grew up in Norwich stayed for university
Of all the young people in Norwich who decided to go to university in the UK, 36 per cent decided to stay and attend university in Norwich. As for those who moved away, the largest share did not go very far: the majority of them moved to the rest of the East or London. If we look at the cities they moved to, 14 per cent of these movers went to study in London and 7 per cent moved to Cambridge (Figure 12). Sheffield and Nottingham were also popular destinations, attracting 5 per cent each.
Figure 11: Destination regions of those moving away from Norwich for university, 2014/15
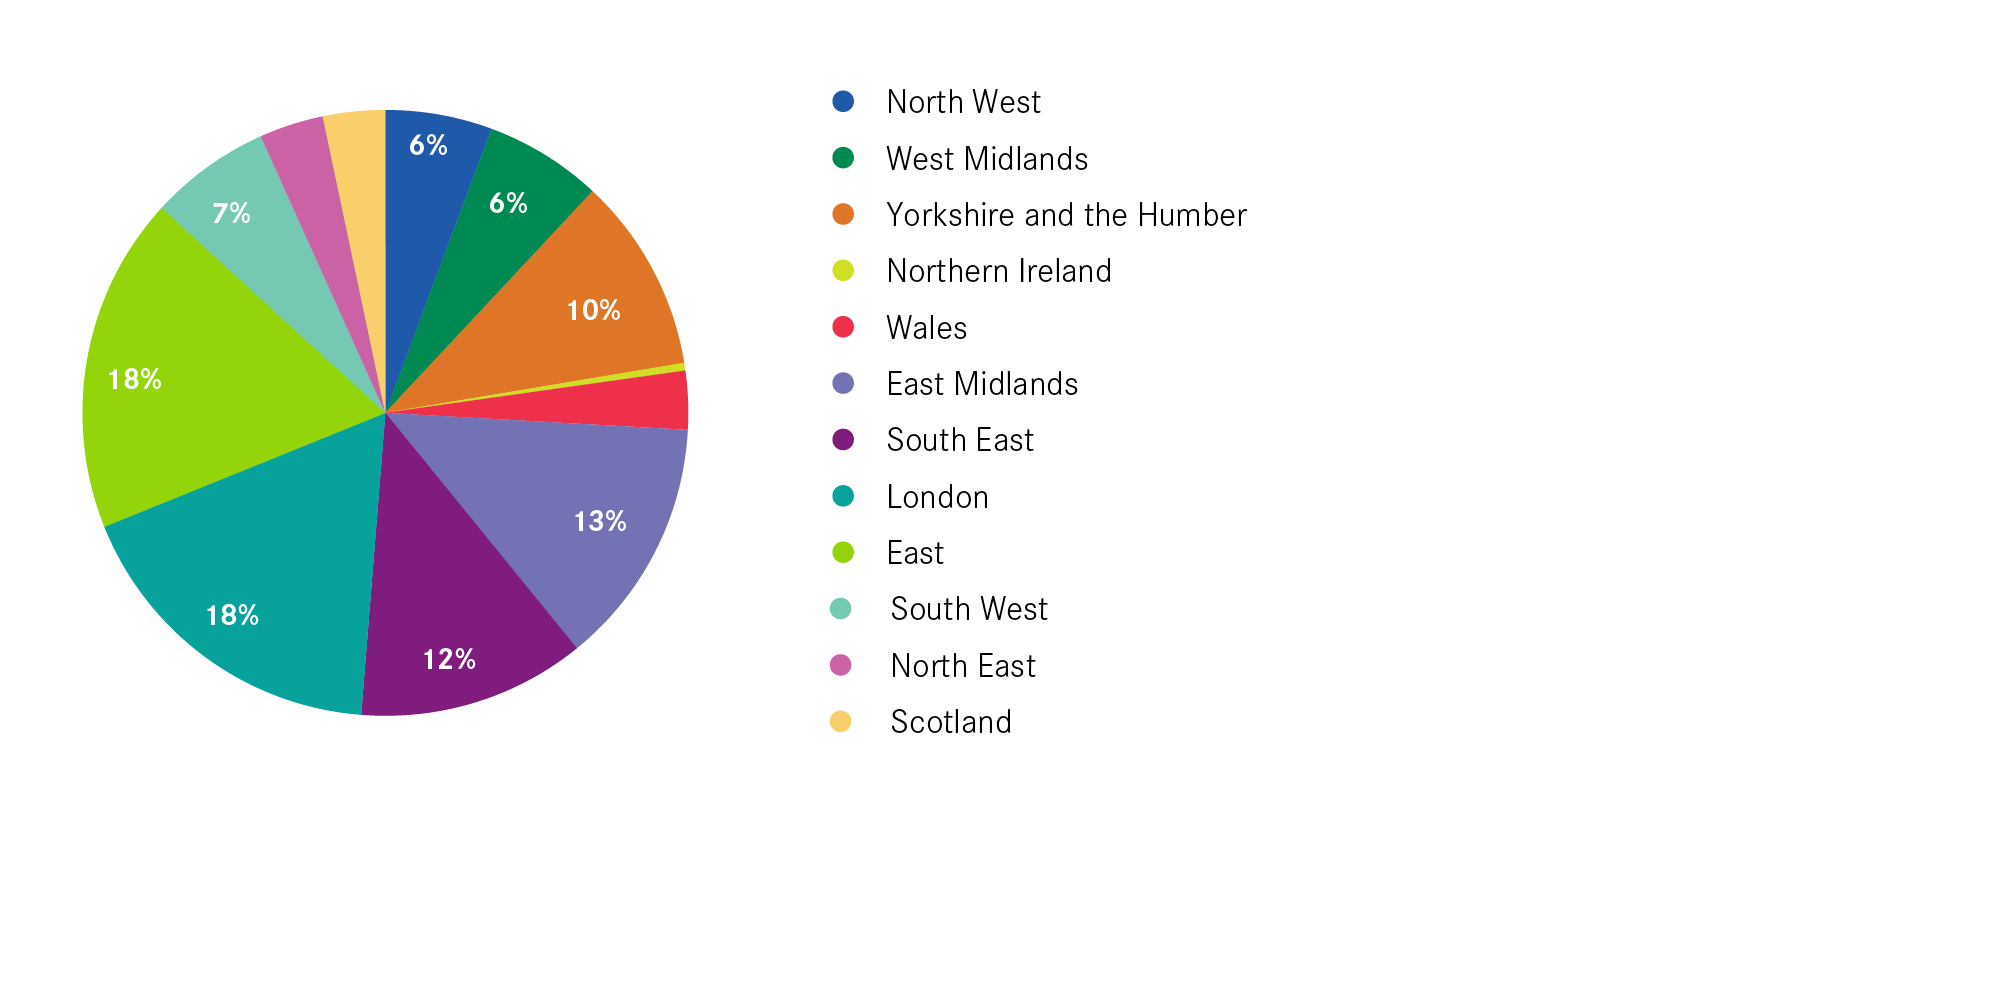
Figure 12: Destination cities of Norwich students moving away for university, 2014/15

Movements of new graduates post-university
A quarter of all Norwich students stayed in Norwich
As a city, Norwich retained 25 per cent of its new graduates in the 2014/15 period, the 22nd highest among the 43 cities with a university campus (see Figure 13). The cities with the highest rates were London and Manchester, keeping 77 and 51 per cent of their graduates, respectively.
Figure 13: Retention rates of each UK city, 2013/14 – 2014/15

However, there are some differences in the retention rates of the two universities. At 36 per cent, the proportion of graduates staying in Norwich after finishing their studies was higher for the NUA than for the UEA — 22 per cent. This is not surprising given the wider pull of the UEA — those universities that have a greater share of students from outside of their home region tend to have lower retention rates.
Figure 14: Percentage of graduates retained in Norwich post-graduation, 2013/14 – 2014/15
| Institution | Retention Rate |
|---|---|
| University of East Anglia | 22% |
| Norwich University of the Arts | 36% |
The city has had limited success at attracting new graduates from elsewhere
Another group of graduates in Norwich are those who are attracted to the city after they finish university to work. While graduate retention figures tend to receive significant attention, the ability of a city to attract new graduates is also important for developing the skills base of the workforce.
Of all the new graduates working in Norwich, 44 per cent studied elsewhere. This cohort can be split into two groups: those that grew up in Norwich, moved away to study and then returned for work, and those that moved in for work but had not lived in the city previously.
Looking firstly at the returners, those students who moved away to Norwich to study, 34 per cent returned for work. This is less than the average for medium sized cities like Norwich, which is 39 per cent.
Turning to those who moved in for work, the number of new graduates attracted in for work that had no previous connection to the city was equivalent to 28 per cent of the graduate workforce. This is the 11th lowest among UK cities.
London was the most popular destination for those who left Norwich on graduation
Within six months of completing university, London was the most common employment destination for those Norwich graduates who left the city — 24 per cent of Norwich’s graduates who moved were working in the capital. This is the case for many UK cities, particularly in the Greater South East. The next popular cities were Ipswich and Cambridge with 3 per cent each (see Figure 15).
Figure 15: Destinations of Norwich graduates who move to other cities for work, 2013/14 – 2014/15

Norwich gained graduates overall
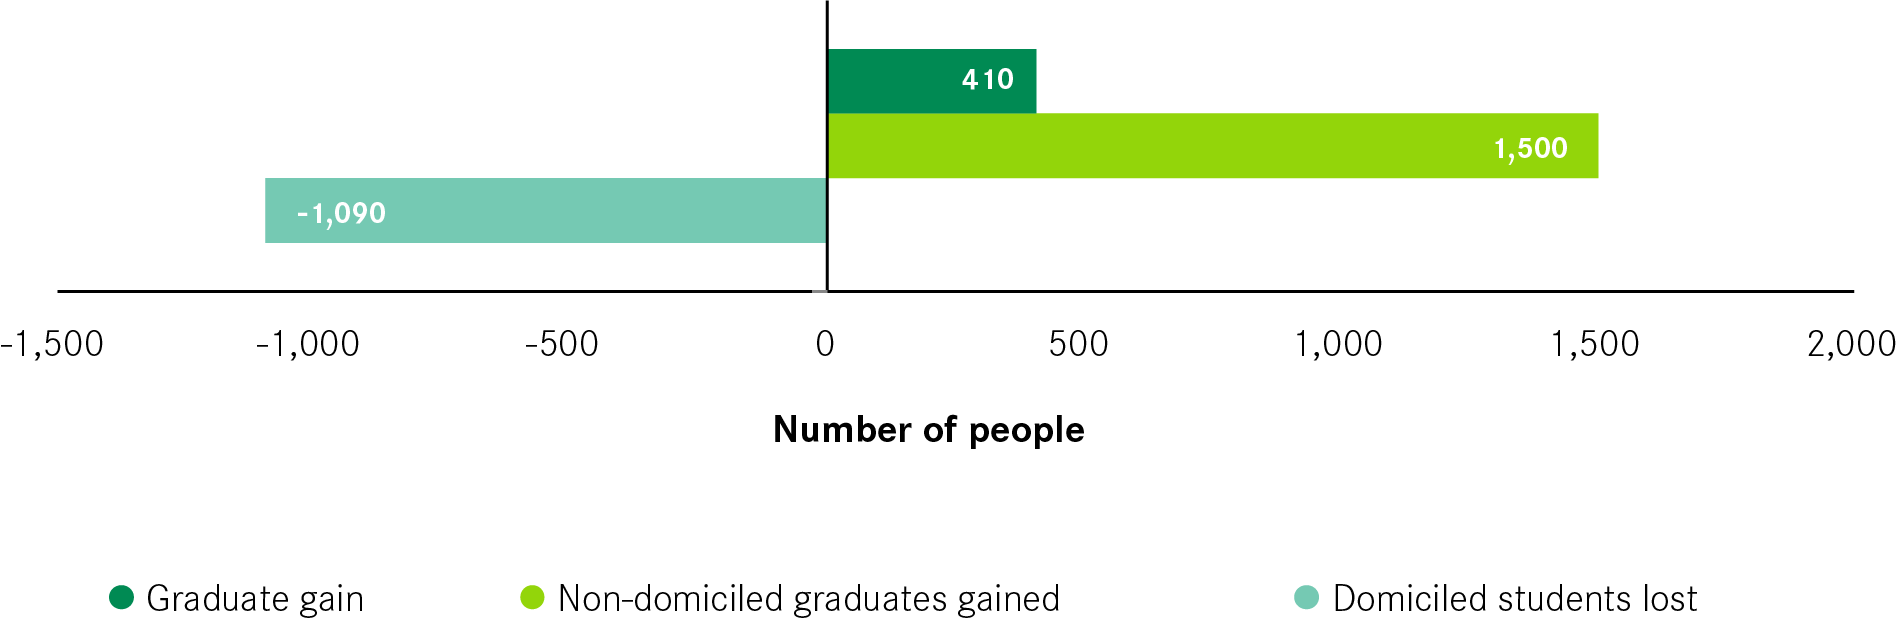
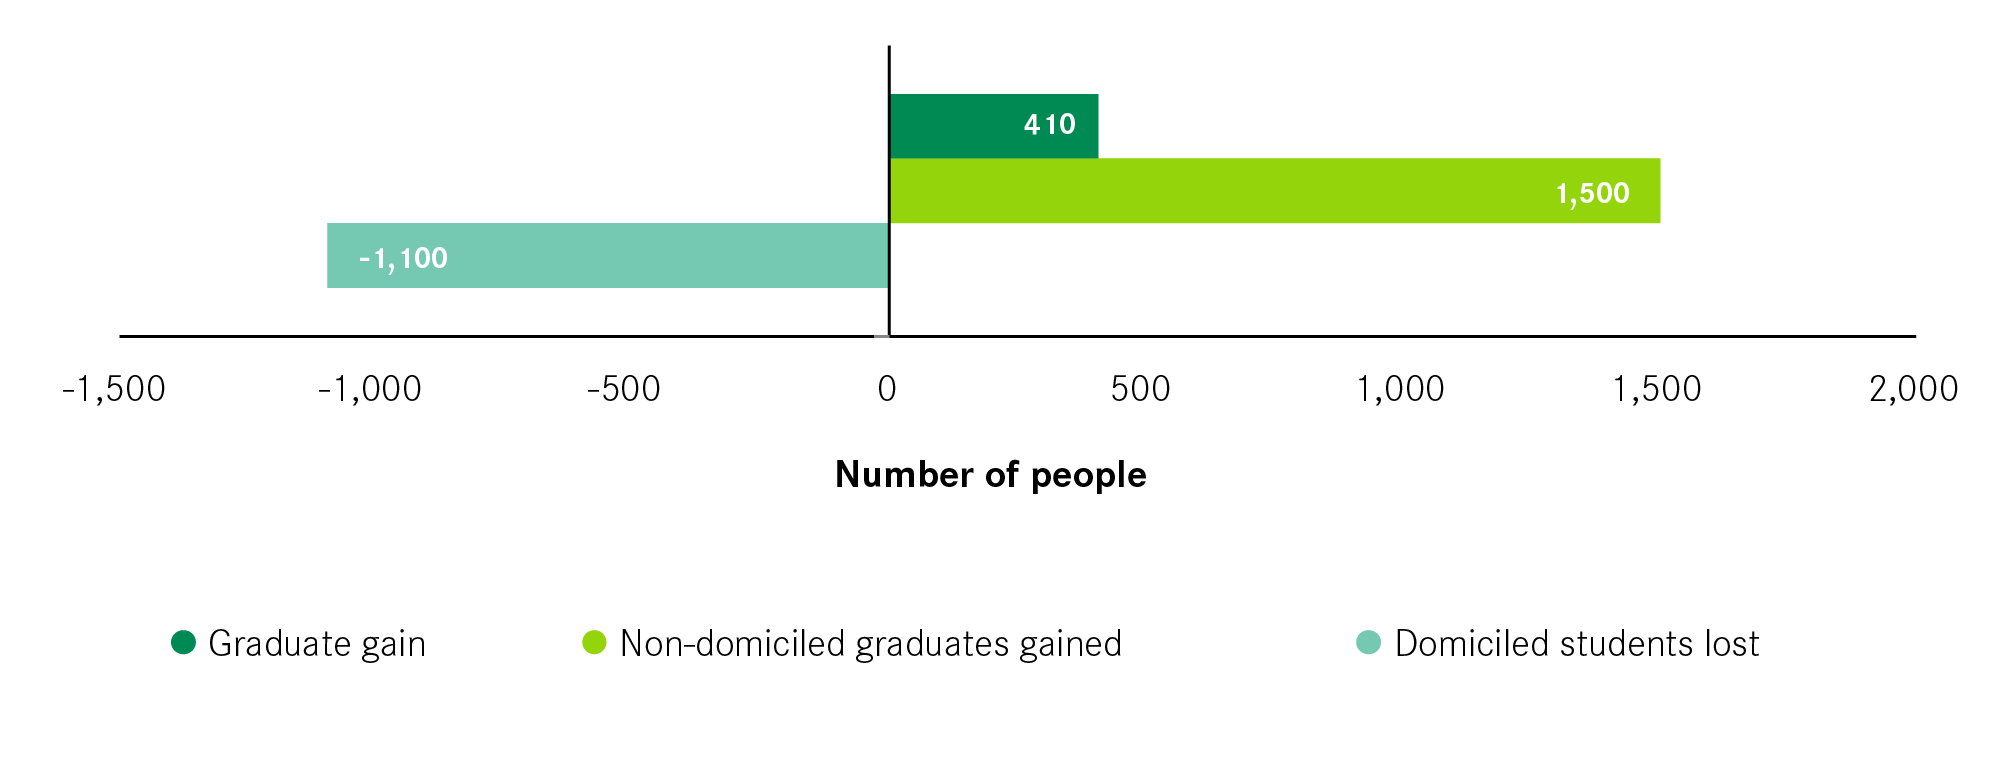
Combining data on student and new graduate moves shows that overall Norwich experienced a graduate gain. Between 2013 and 2015, 1,090 graduates who responded to the survey had left Norwich to go to university elsewhere, whilst 1,500 respondents, who did not grow up in Norwich, were employed in the city after graduation. Figure 16 shows the size of this graduate gain. In absolute terms, the city gained 410 graduates; this places Norwich as the 28th highest gainer of graduates when compared with other UK cities. London gained 42,000 of the graduates who responded and Manchester gained 4,700.
Figure 16: Comparing students lost and graduates gained in Norwich, 2013/14 -2014/15
This small graduate gain does not appear to match the earlier finding about the net outflow of young graduates from Norwich. This is because there is one final cohort of students: the bouncers. These students move into Norwich to study but leave straight after graduation. Of all the students who moved to Norwich to study, 80 per cent bounced — the 30th highest rate among UK cities with a university campus.
This cohort causes a lot of noise in the data. By excluding them and comparing the number of (would be) graduates in Norwich before university with the number of graduates in the city after graduation, the graduate gain figure can be calculated. As Figure 17 shows, the graduate gain was much lower than the number of bouncers, and this results in the outflow of young graduates shown earlier.
Figure 17: Bouncers and graduate gain, 2013/14 – 2014/15
Summary
- Norwich’s universities have a strong regional pull, mainly attracting new students from the rest of the East of England. However there are differences between the two universities. The University of East Anglia had a larger share of international students than the Norwich University of Art.
- More than a third of all young people in Norwich that decided to go to university stayed in the city. Of those who moved, the majority went to study in the rest of the East of England or London.
- Norwich retained a quarter of its new graduates but the retention rate was higher for the Norwich University of the Art than for the University of East Anglia.
- London was the most common employment destination for Norwich’s graduates, followed by Ipswich and Cambridge.
- Overall, as a result of these movements, Norwich experienced a small graduate gain.