
02The nature of overall migration between Newcastle and the rest of England and Wales
This section combines data on all migration within England and Wales from the ONS and the 2011 Census to look at migration to and from Newcastle by age and qualification. 2
Most migration is between Newcastle and the rest of the North East
Between 2009 and 2015 163,610 people moved into Newcastle and 165,790 people moved out, leading to an overall net outflow of 2,180 people from the city. In comparison to other UK cities, this was one of the smallest net movements. During the period Bournemouth experienced the largest net inflow of 15,100 people and London the largest net outflow of 340,310 people.
Of all inward migration into the city, 38 per cent was from elsewhere in the North East region. Another 17 per cent was from Yorkshire and the Humber. A similar pattern occurred for outwards migration from the city: 39 per cent was to the North East and 15 per cent was to Yorkshire. There were also large movements of people between Newcastle and the North West.
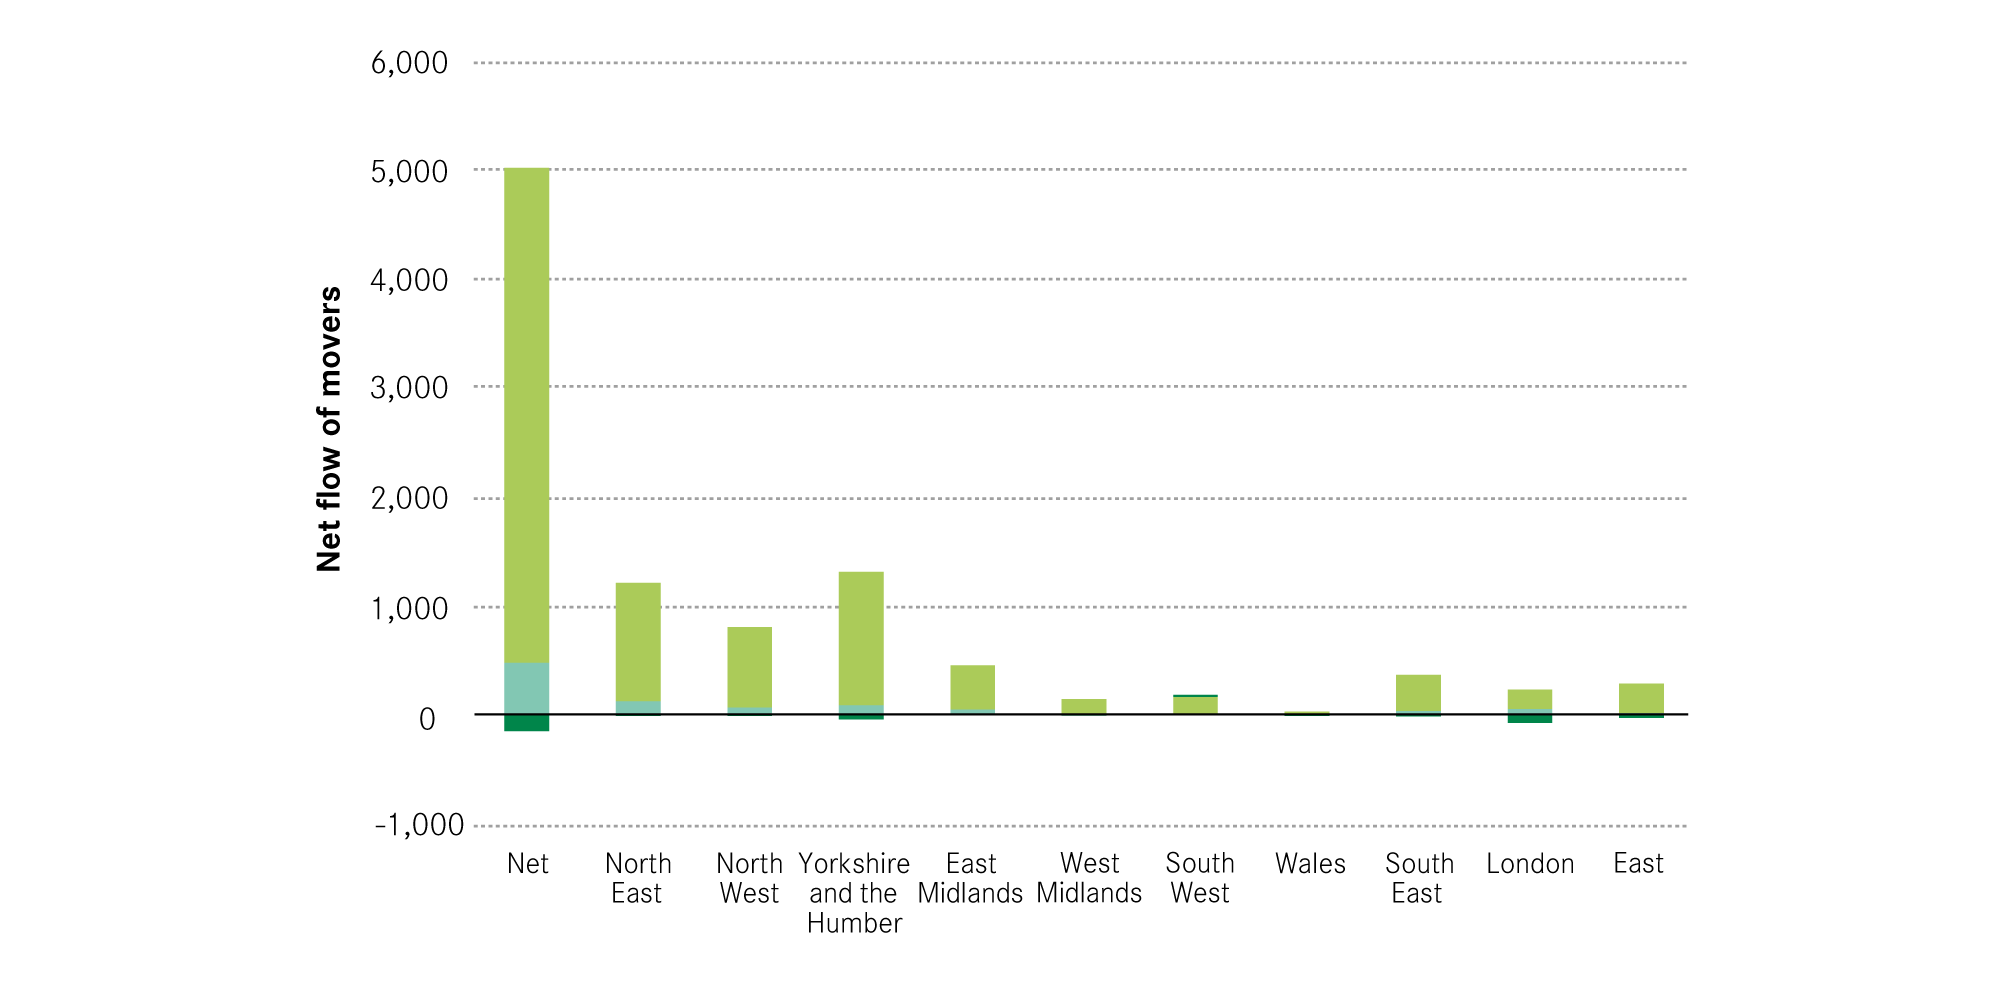
However, when inward and outward migration is combined the most prominent net flow was to London, as shown in Figure 1. The flows to and from the rest of the North East were similar in size and therefore led to only small net inflows and outflows. In contrast there was a much larger outflow to the capital, than inflow, causing a net outflow of 7,200 people. Over the period there were net inflows to the city from the neighbouring regions of the North West and Yorkshire.
Figure 1: Net regional migration into Newcastle, 2009-2015

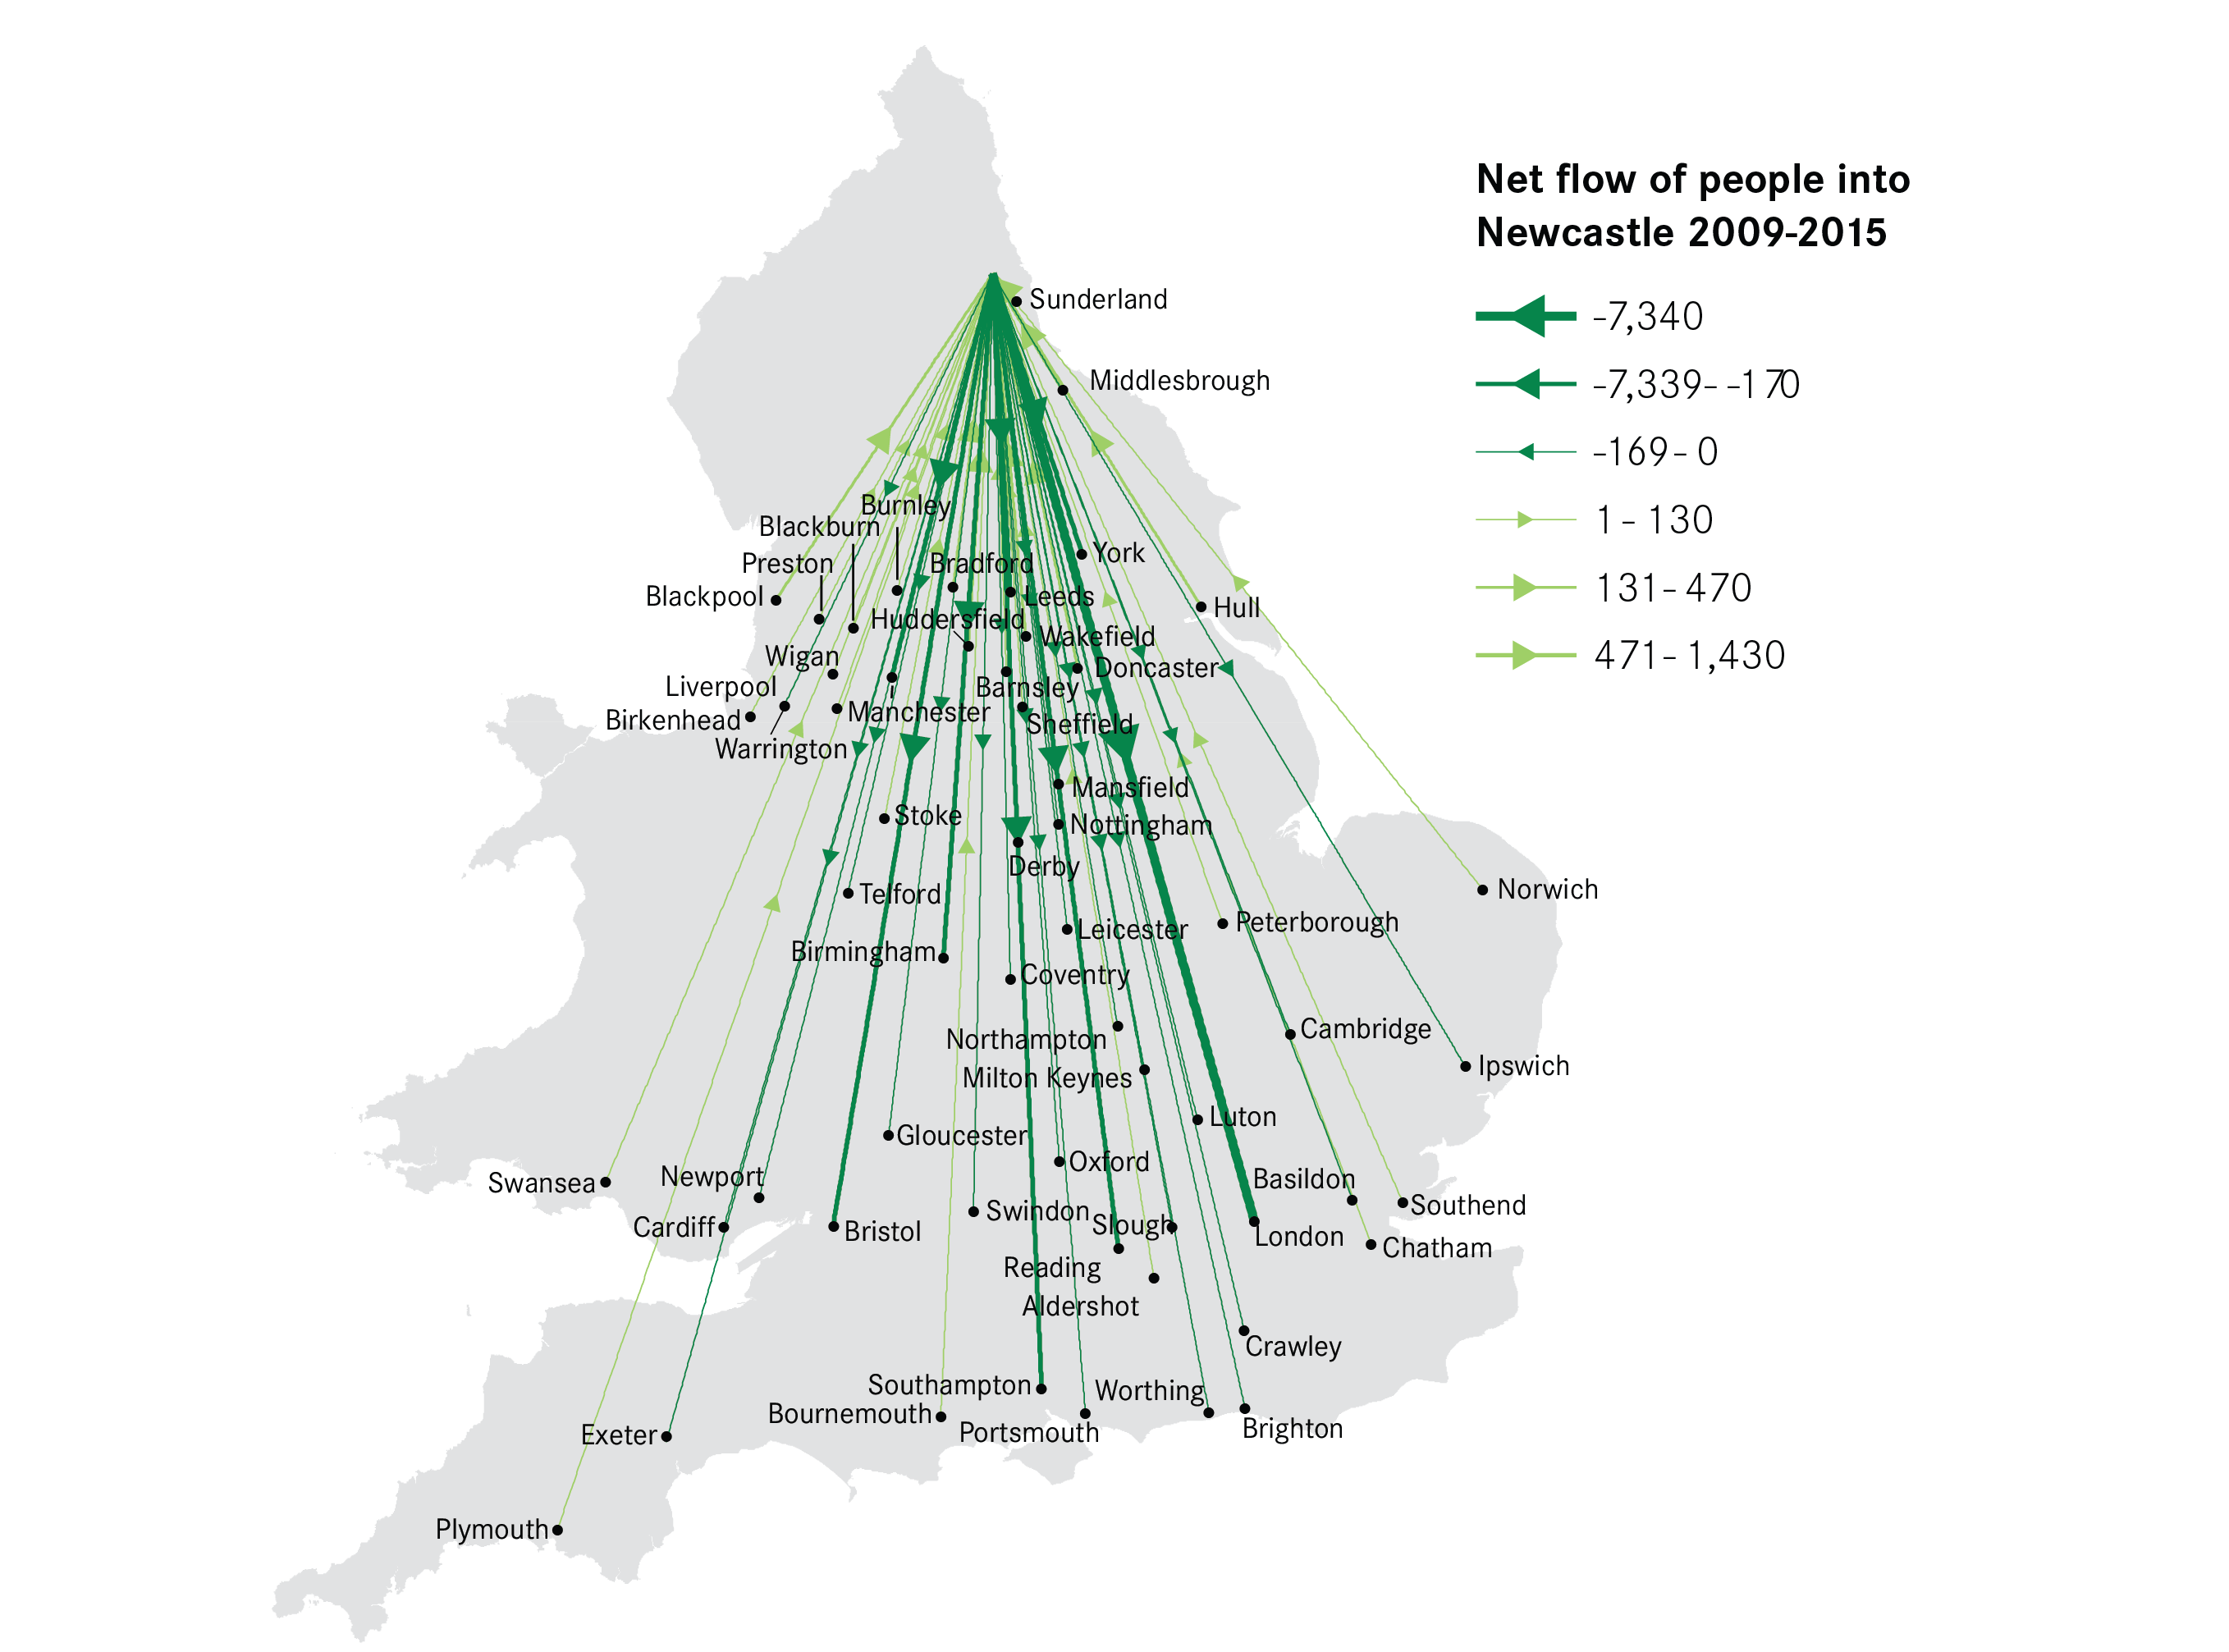
Looking specifically at movements between cities, the largest net inflows to Newcastle were from the neighbouring cities of Middlesbrough and Sunderland. There were also considerable net inflows from Bradford and Huddersfield. The city lost most people to London, with a net outflow of 7,340 people to the capital taking place between 2009 and 2015.
Figure 2: Net flow of people from UK cities into Newcastle, 2009-2015
Newcastle’s migration patterns are driven by the movements of young people
Migration varied a lot by age and younger age groups accounted for a much larger share of migration than older age groups. Those aged 16 to 21 contributed 35 per cent of inward migration to Newcastle, despite only accounting for 16 per cent of the city’s population, as shown in Figure 3. Outward migration was driven by a slightly older cohort, with 22 to 25 year olds accounting for 25 per cent of outward migration but only 8 per cent of population. Migration of older age groups was much lower, and those aged over 46 were much less likely to move to or away from the city.
Figure 3: Contribution of each age group to migration and to the city’s population, 2009-2015

This means that overall there was a net inflow of 16 to 21 year olds, followed by a net outflow of 22 to 25 year olds, as shown in Figure 4. For all other age groups there was a small net outflow from the city, hence the overall small net outflow of 2,180 people.
Figure 4: Net inflow of people to Newcastle by age, 2009-2015

Newcastle loses graduates to most regions of England and Wales
While ONS migration data does not provide information on the qualifications of migrants, the 2011 Census does for those who moved between 2010 and 2011. When the data is split into three age groups: 16 to 21, 22 to 30 and 31 to 45 year olds, three distinct trends emerge.
There was a net inflow to Newcastle from every region of those aged 16 to 21 with A-Level qualifications leading to a net inflow of the whole age group into the city, as shown in Figure 5. The largest net inflows were from Yorkshire and the North East, with 1,220 and 1,090 moving into Newcastle respectively. These patterns were similar for those with lower qualifications, with a net inflow occurring from all regions; the largest being from Yorkshire and the North East.
Figure 5: Net flows of 16 to 21 year olds by region and qualification, 2010-2011
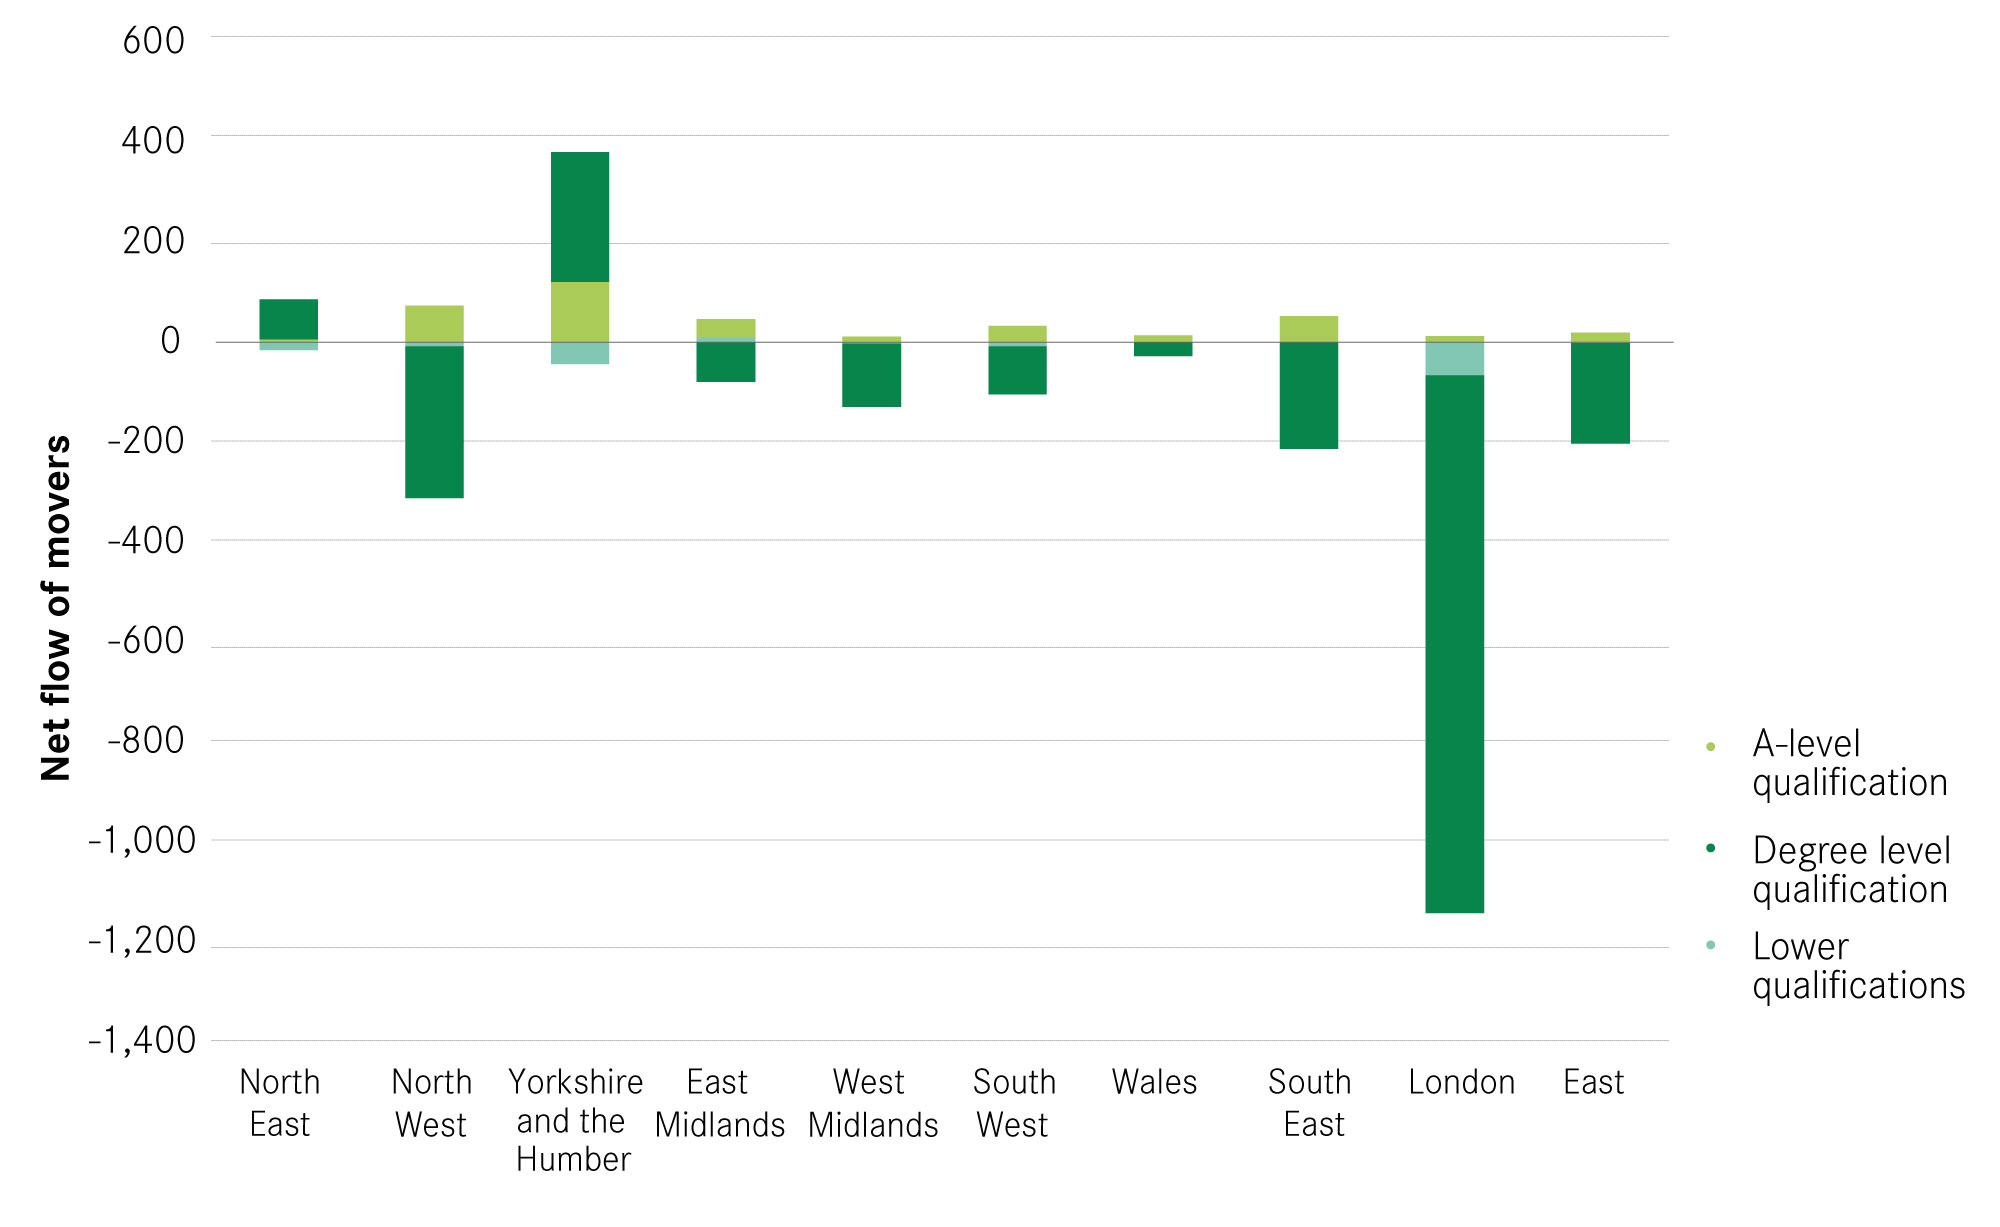
In older age groups movements were dominated by graduates. Looking specifically at 22 to 30 year olds, Newcastle attracted in graduates from the North East region but lost them to all other regions, as shown in Figure 6, leading to a net outflow of young graduates from the city overall. The largest net outflow was to London, equal to 650 graduates over the period 2010 to 2011.3 Other strong net outflows were to Yorkshire and the North West. In contrast, there was an overall net inflow to Newcastle of 22 to 30 year olds with A-Level qualifications.
Figure 6: Net flows of 22 to 30 year olds by region and qualification, 2010-2011
This pattern was reversed for 31 to 45 year olds: there was a large net outflow from Newcastle to the rest of the North East region for all qualification levels. There were only small net movements between the city and other regions, such as a net outflow to the North West and a small net inflow from the East. Overall therefore there was a net outflow from the city of this age group, for all qualification levels, and the net outflow of graduates seen for 22 to 30 year olds continued for 31 to 45 year olds.4
Figure 7: Net flows of 31 to 45 year olds by region and qualification, 2010-2011

Looking again at the wider migration data for 2009 to 2015 from the ONS, this allows us to view the movements of 31 to 45 year olds between local authorities and shows that many of those leaving Newcastle did not move far. The largest net outflow from the city was to Northumberland, equal to 1,500 people, as well as a movement of 660 people to County Durham. This means that many move to neighbouring local authorities, and remain within a commutable distance to Newcastle even if they no longer live in the city.
This trend of older degree holders moving out of a city but staying within commutable distance is common to many UK cities. Previous work by Centre for Cities has shown that those aged between 35 and 54 tend to place more value on the size and type of their house, and access to local schools, leading many to prefer living outside cities.5
While Newcastle saw a net outflow of 940 people to London during this period, there was a small net inflow from the capital into the surrounding local authorities. Therefore, although the people tend to move away from the city towards the capital, some do move back to the area but go straight into local authorities such as Northumberland and Durham rather than return to the city.
Summary
- Newcastle’s migration patterns were dominated by movements between the city and the rest of the North East region.
- Overall there was a small net outflow of 2,180 people from Newcastle between 2009 and 2015.
- However, there were net inflows of 16 to 21 year olds with A-levels from all regions. Many of these were likely due to students moving into the city for university.
- There were two outflows of graduates from the city: firstly of young graduates moving to London, and secondly of older graduates moving elsewhere within the North East.