
04The nature of the new graduate workforce
This section explores the cohort of graduates who were working in Newcastle 6 months after graduating in 2014 and 2015.
More than half of Newcastle’s graduate workforce study in the city
Figure 22 brings together all the graduates who chose to work in Newcastle on graduation, providing an overview of the city’s graduate workforce. It shows that 57 per cent studied in the city: 26 per cent grew up in Newcastle, stayed for university and then again for work, and 31 per cent moved in for university and stayed afterwards. Those who left to study elsewhere but returned for work made up 19 per cent of the workforce, and the remaining 23 per cent had never lived in Newcastle before but moved in for work.
Compared with other UK cities with a university, the city had a high proportion of home-grown graduates (10th out of 48 cities), and a reasonably high proportion of graduates who came for university and stayed for work (14th). Newcastle’s number of returners ranks them in the middle of the university cities (26th), but it had quite a low proportion of graduate movers (42nd).
Figure 22: The components of the new graduate workforce, 2013/14 – 2014/15

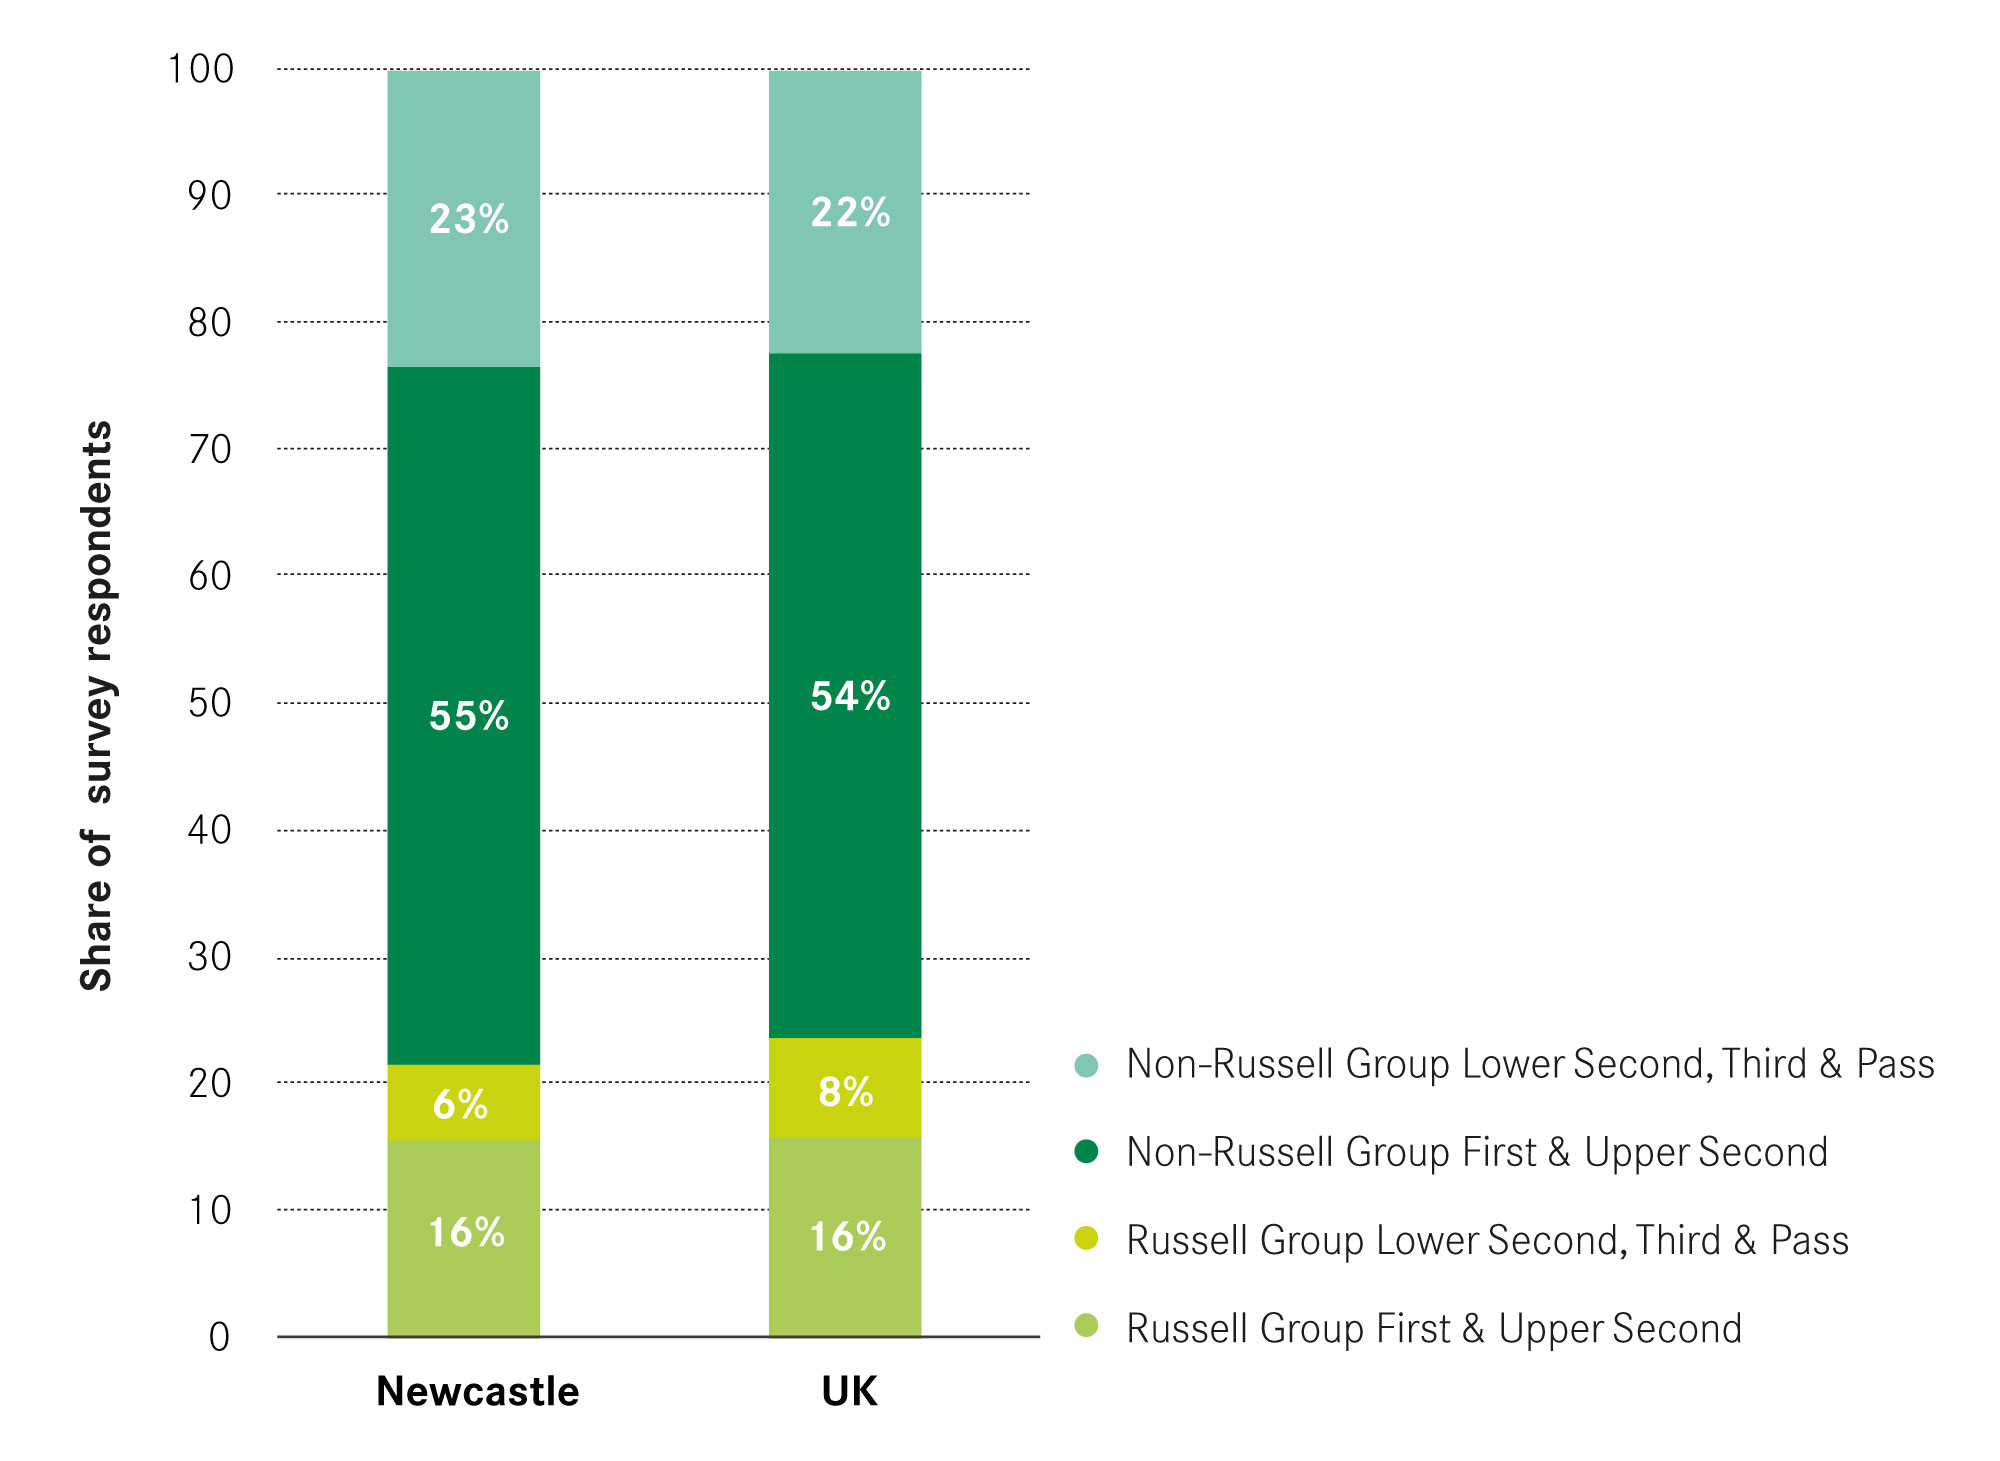
Graduates working in Newcastle are very representative of the UK’s graduate population in terms of the class of degree attained. As Figure 23 shows, 16 per cent of graduates in the city had top class degrees from Russell Group universities, an equal number to the proportion of all UK graduates with this class of degree. Other classes are also similar to the UK average: most graduates (55 per cent) were not from Russell Group universities but achieved a first or upper second class degree.
Figure 23: Share of working new graduates by class of degree, 2013/14-2014/15
New graduate wages in Newcastle are relatively high
On average a graduate working in Newcastle earned £22,920, placing it in the top third of graduate wages across all UK cities. The average wage of a Newcastle University graduate was slightly higher than a graduate of Northumbria University, £23,740 compared with £23,590. As shown in Figure 25, wages varied by location. Graduates of both of the city’s universities earned more if they moved away from Newcastle than if they stayed, though the difference was small. 7
However, analysis of UK graduates finds that wages are not the most important determinant of where to work after university. 8 Other factors such as the type of jobs available in that city and the opportunities for career progression are higher priorities.
Figure 24: Mean graduate wages of each UK city, 2013/14 – 2014/15
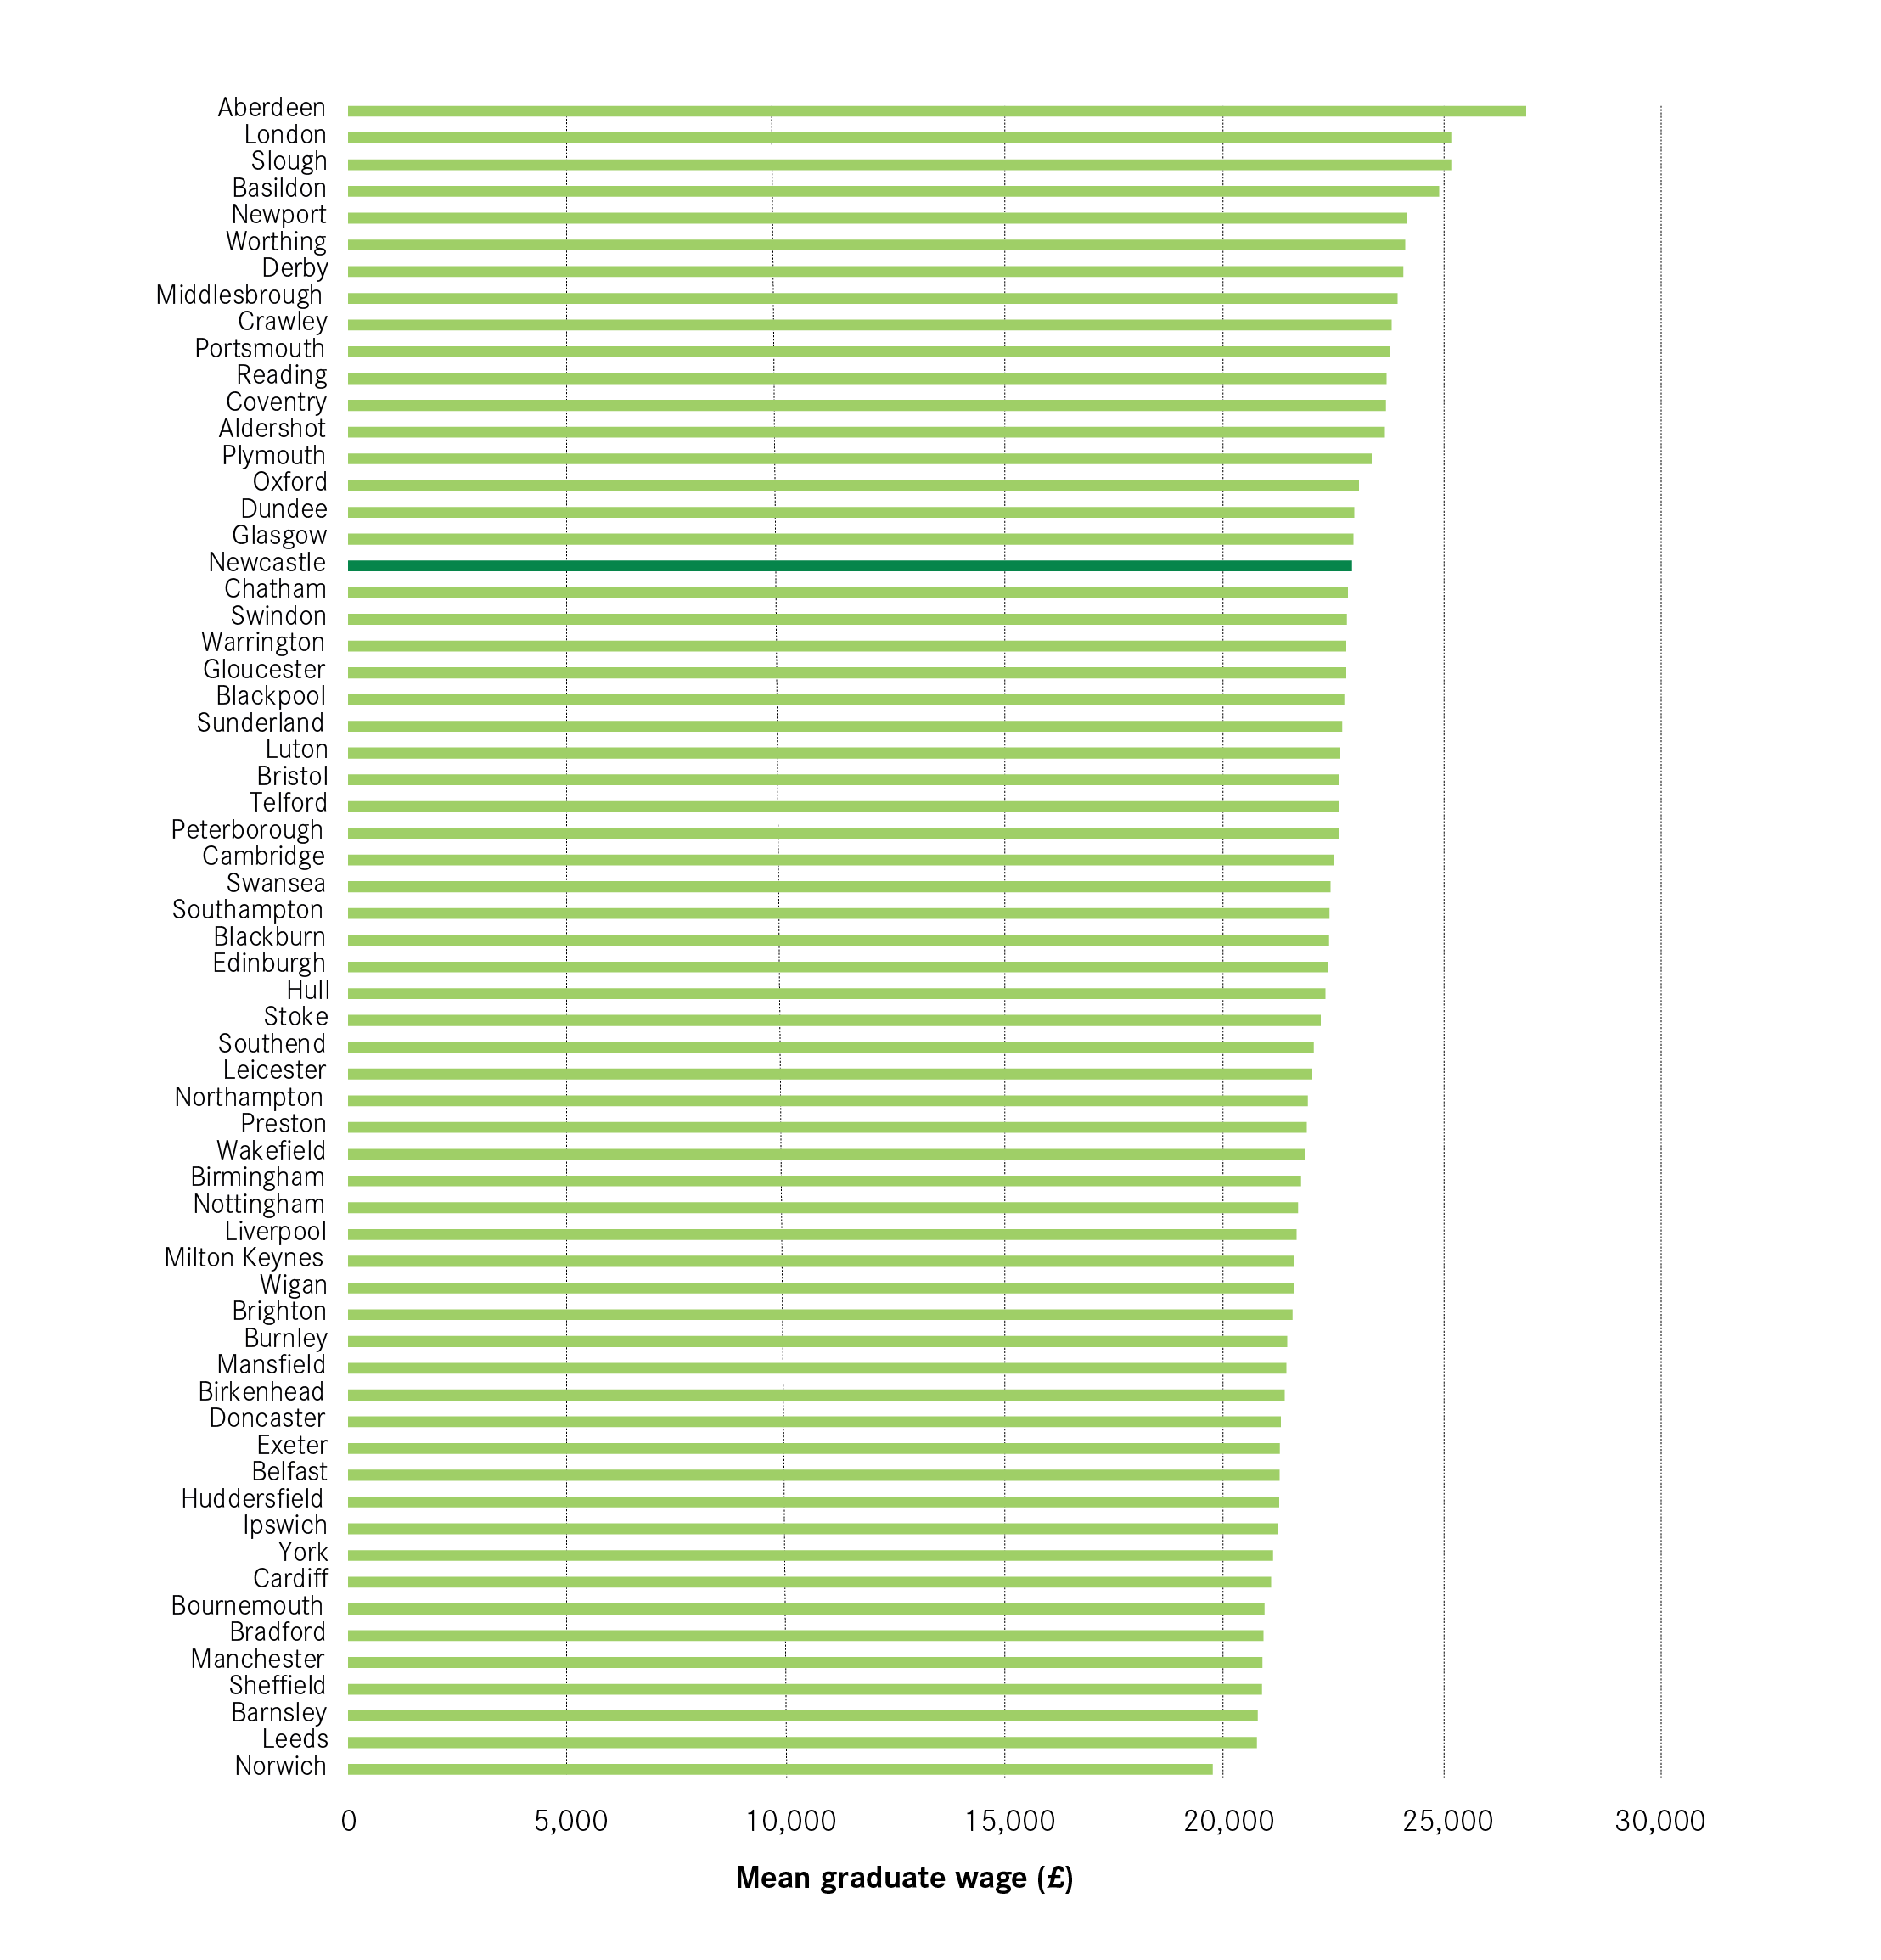
Figure 25: Mean graduate wages by institution and location of employment, 2013/14 – 2014/15

Half of the city’s graduate workforce is employed by the public sector
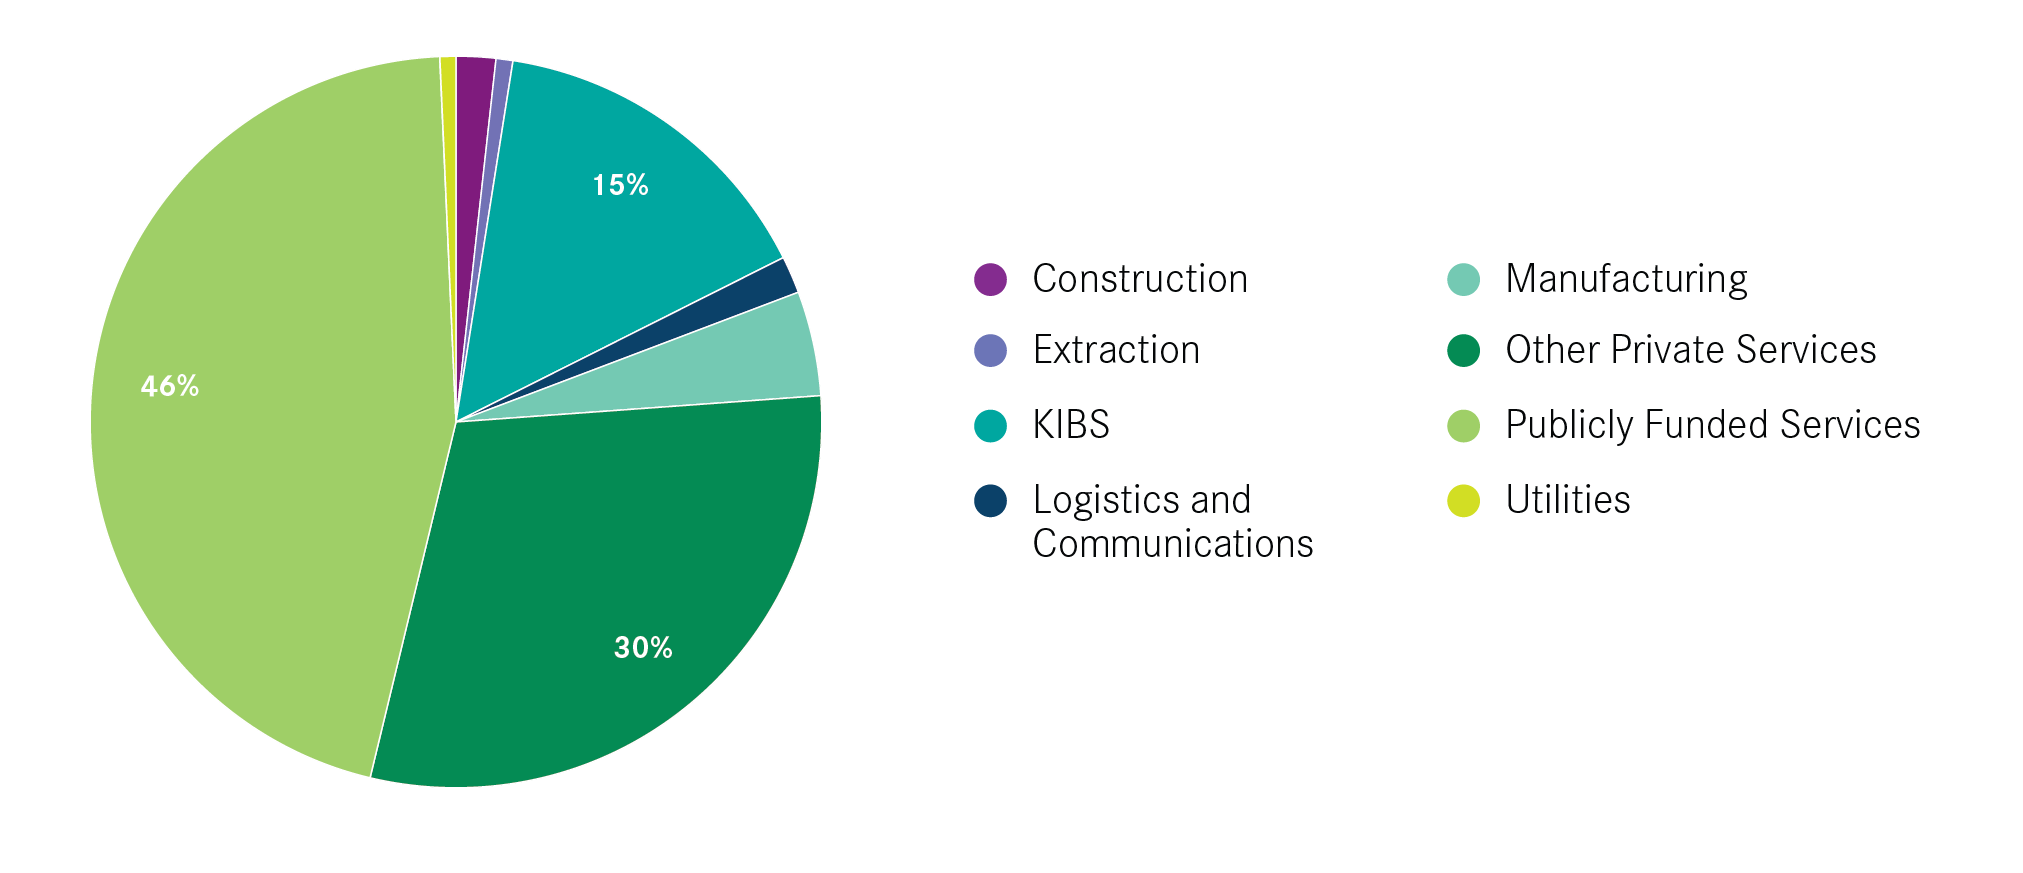
In Newcastle, half the gradates worked in the public sector, 14 per cent worked in KIBS jobs, such as law and marketing, and another 27 per cent worked in other private services. In comparison a smaller share of the UK graduate population worked in the public sector (46 per cent), and a higher share worked in KIBS (15 per cent), as shown in Figure 27.
Figure 26: Share of graduates in Newcastle working in each sector, 2013/14-2014/15
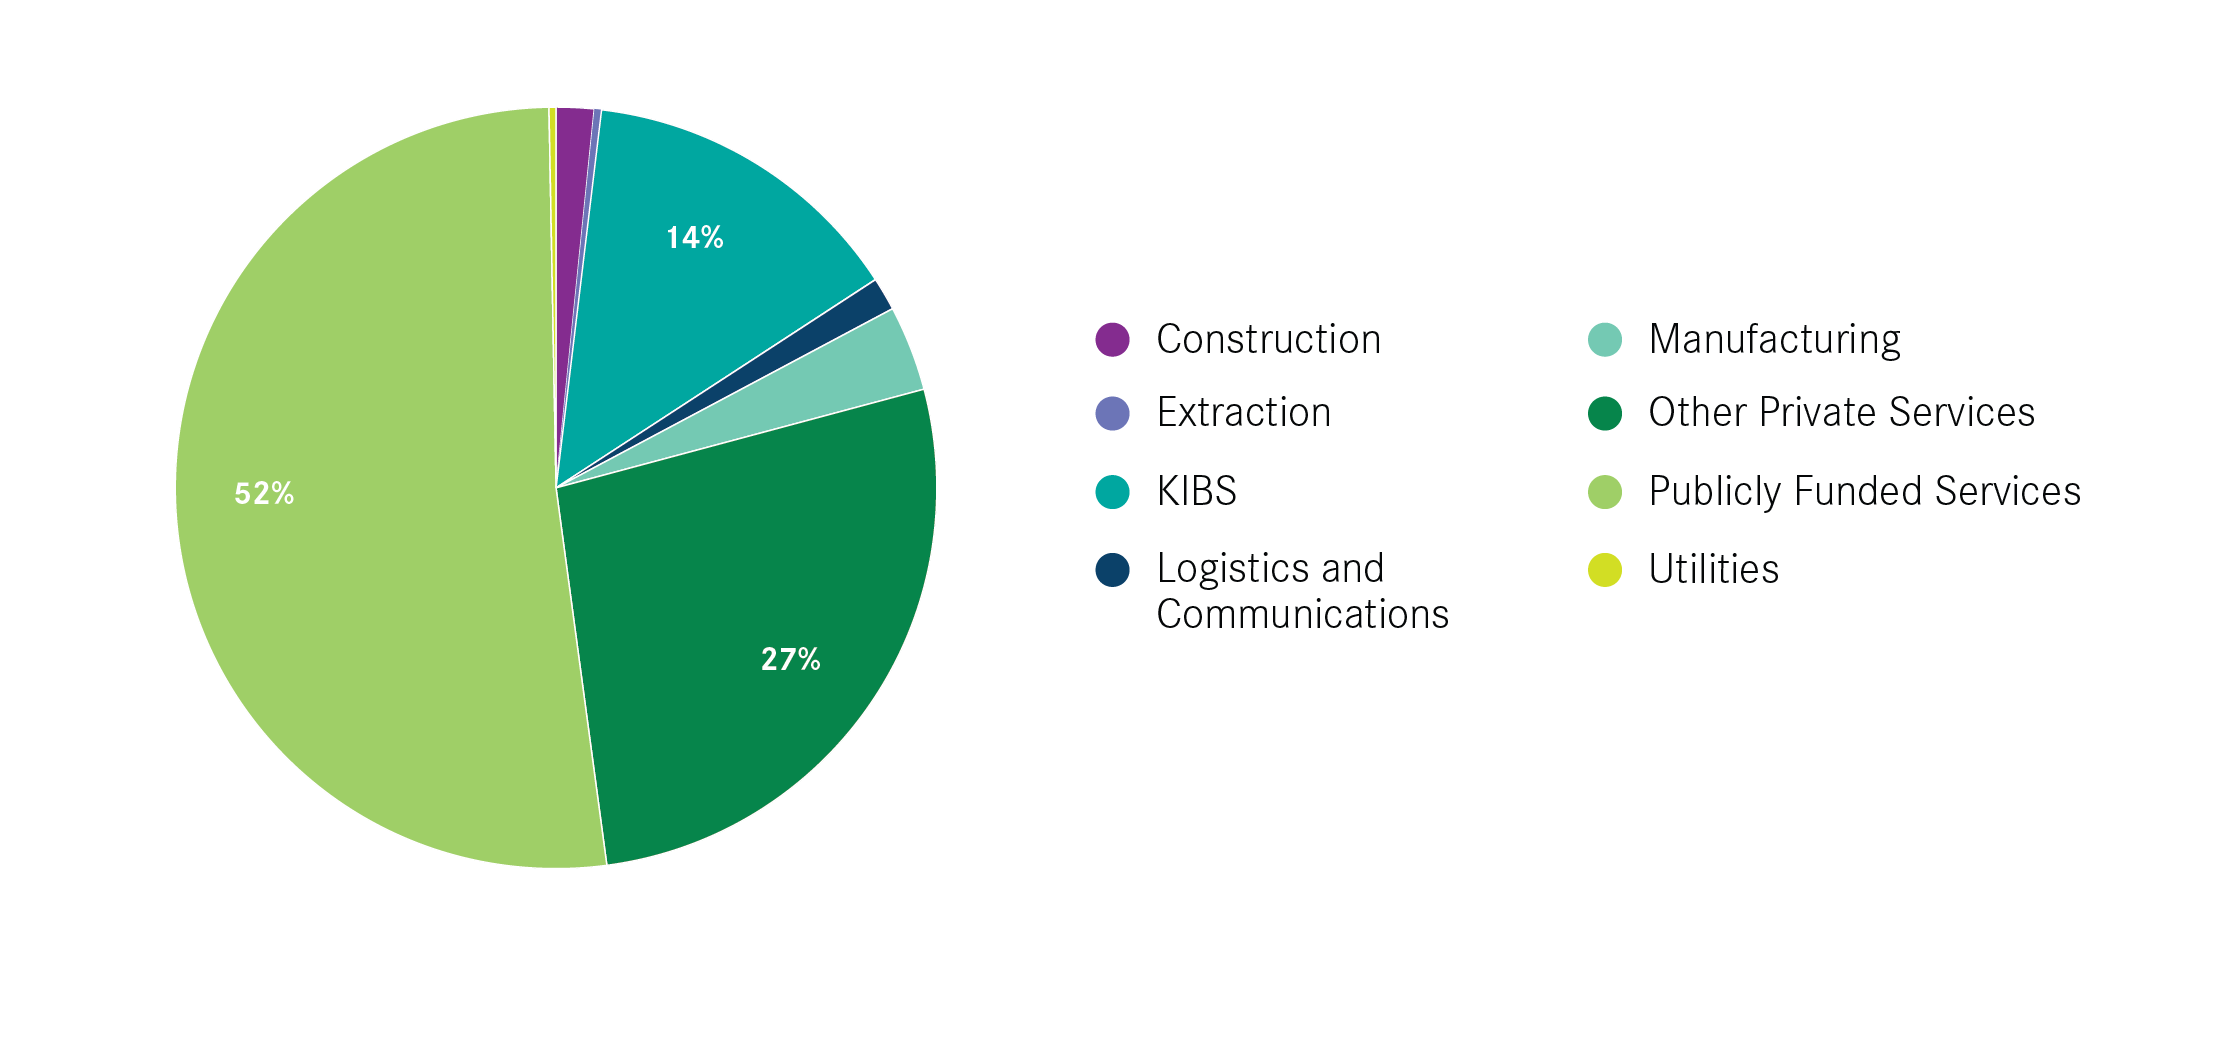
Figure 27: Share of UK graduates working in each sector, 2013/14 – 2014/15
Of those graduates who left the city to work elsewhere, 24 per cent worked in KIBS jobs. This suggests that they moved away from the city in order to find job opportunities in this sector as the share available in Newcastle was much lower.
Looking at a finer industrial breakdown, 30 per cent of graduates working in Newcastle were in the healthcare sector, 19 per cent were in education and 4 per cent in public administration. Looking at the KIBS industries, 5 per cent of graduates were employed in legal and accounting services, 3 per in computer programming and 4 per cent in head office activities or management consultancy. Finally, another significant sector was retail, which employed 4 per cent of graduates.
These jobs tended to be concentrated in the centre of the city. The NE1 postcode was home to 29 per cent of all new graduate jobs, and 36 per cent of all new graduate jobs in the private sector.
The vast majority of Newcastle’s graduate workforce was employed in high-skilled jobs six months after graduation, which are jobs traditionally considered to be of a graduate level. However, 14 per cent were in low-skilled occupations, as shown in Figure 28. This in part reflects the time it takes graduates to find their first graduate job but could also suggest some underemployment of graduates. However, this distribution of occupations was similar to the UK graduate workforce as a whole, in which 76 per cent were in high-skilled, and 11 per cent were in low-skilled employment. Therefore if there is graduate underemployment occurring it is no worse than the UK average.
Figure 28: Occupation levels of graduates working in Newcastle, 2013/14 – 2014/15

Box 2: Outcomes of the graduates from Newcastle’s universities
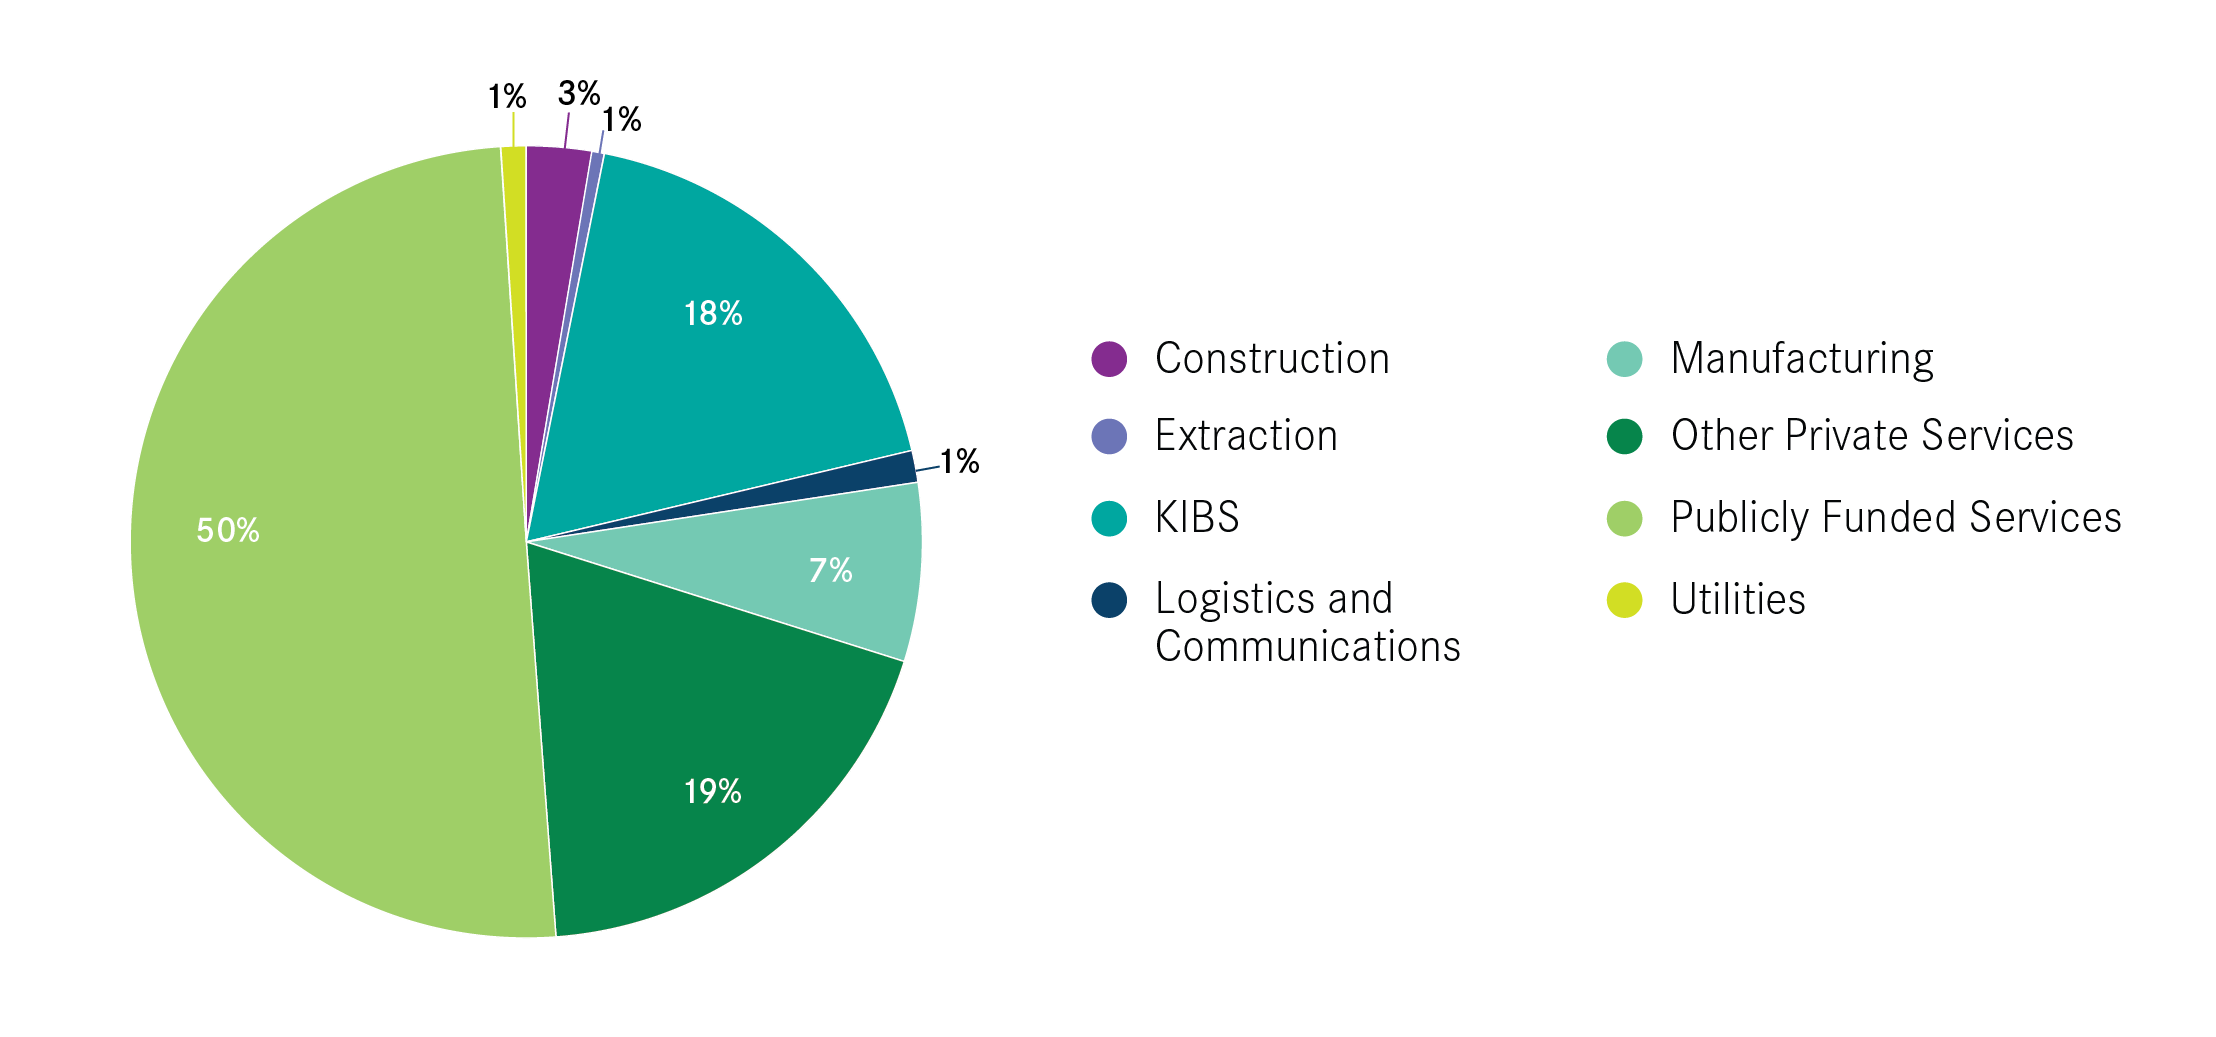
Figures 29 and 30 show the sectors employing graduates of Newcastle’s two universities, regardless of where they choose to work. Newcastle University graduates were much more likely to work in KIBS jobs (27 per cent) and less likely to work in the public sector (41 per cent). In comparison, half of Northumbria graduates moved into the public sector, 18 per cent work in KIBS and 19 in other private services.
Given that graduates choose where to work based on the jobs on offer, this suggests that those graduates who leave Newcastle may be leaving to find greater opportunities in the KIBS and the broader private sector. It may also partly explain the higher retention rate of Northumbria graduates, as the sectors they worked in were more aligned to the jobs on offer in the city.
Therefore, as the city looks to attract in more graduates the priority should be increasing the number of job opportunities in the KIBS and other private services sectors.
Figure 29: Share of Newcastle University graduates working in each sector, 2013/14 – 2014/15
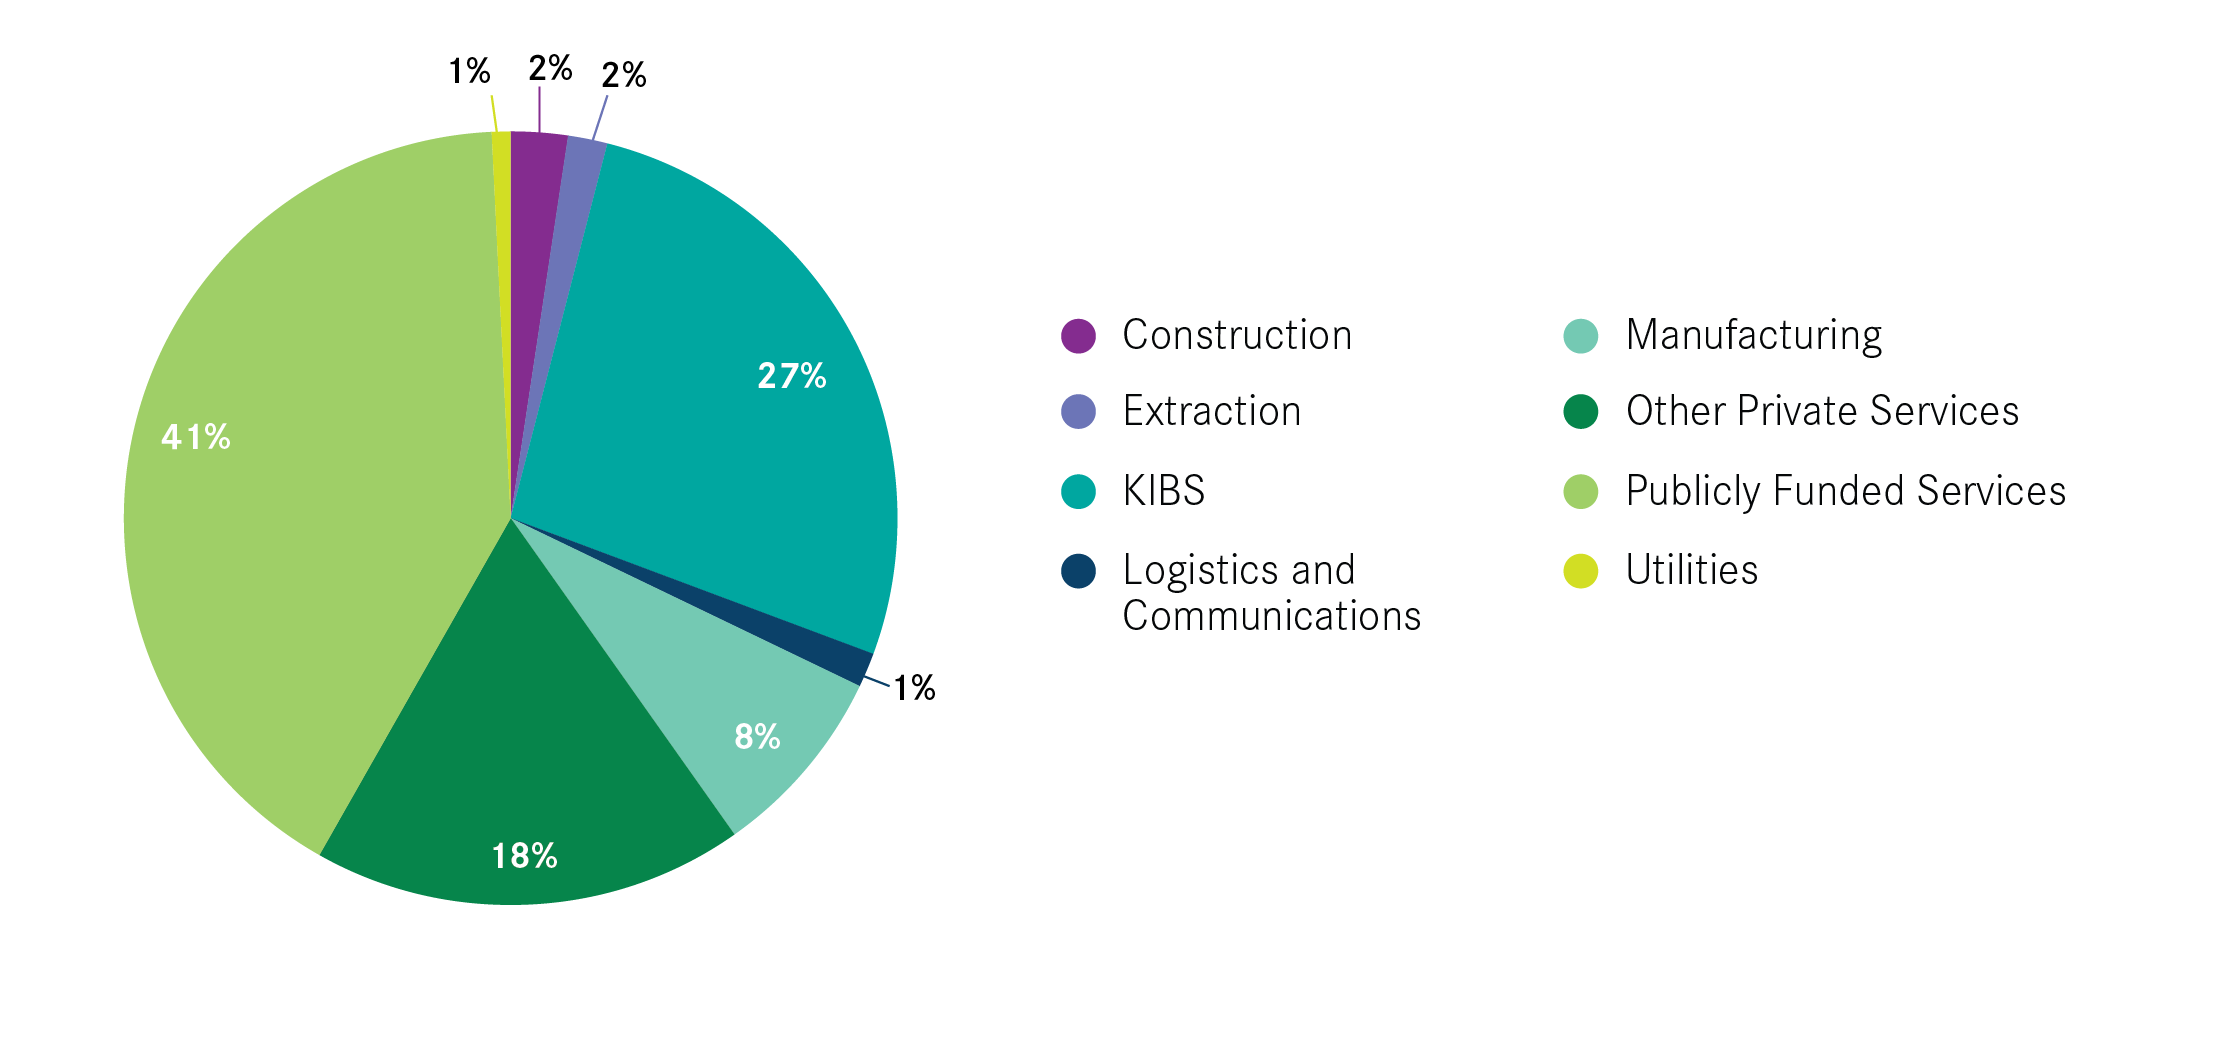
Figure 30: Share of Northumbria University graduates working in each sector, 2013/14 – 2014/15
Implications for the total number of degree holders in Newcastle
In 2015, 34 per cent of Newcastle’s working age population (aged 16 to 64) were degree holders. This was a slightly lower proportion of high-skilled workers than the UK average: 37 per cent of UK workers had a degree-level qualification. Since 2004 Newcastle has consistently lagged slightly behind the UK average, as shown in Figure 31.
Figure 31: Share of working age population with a degree, 2004-2015

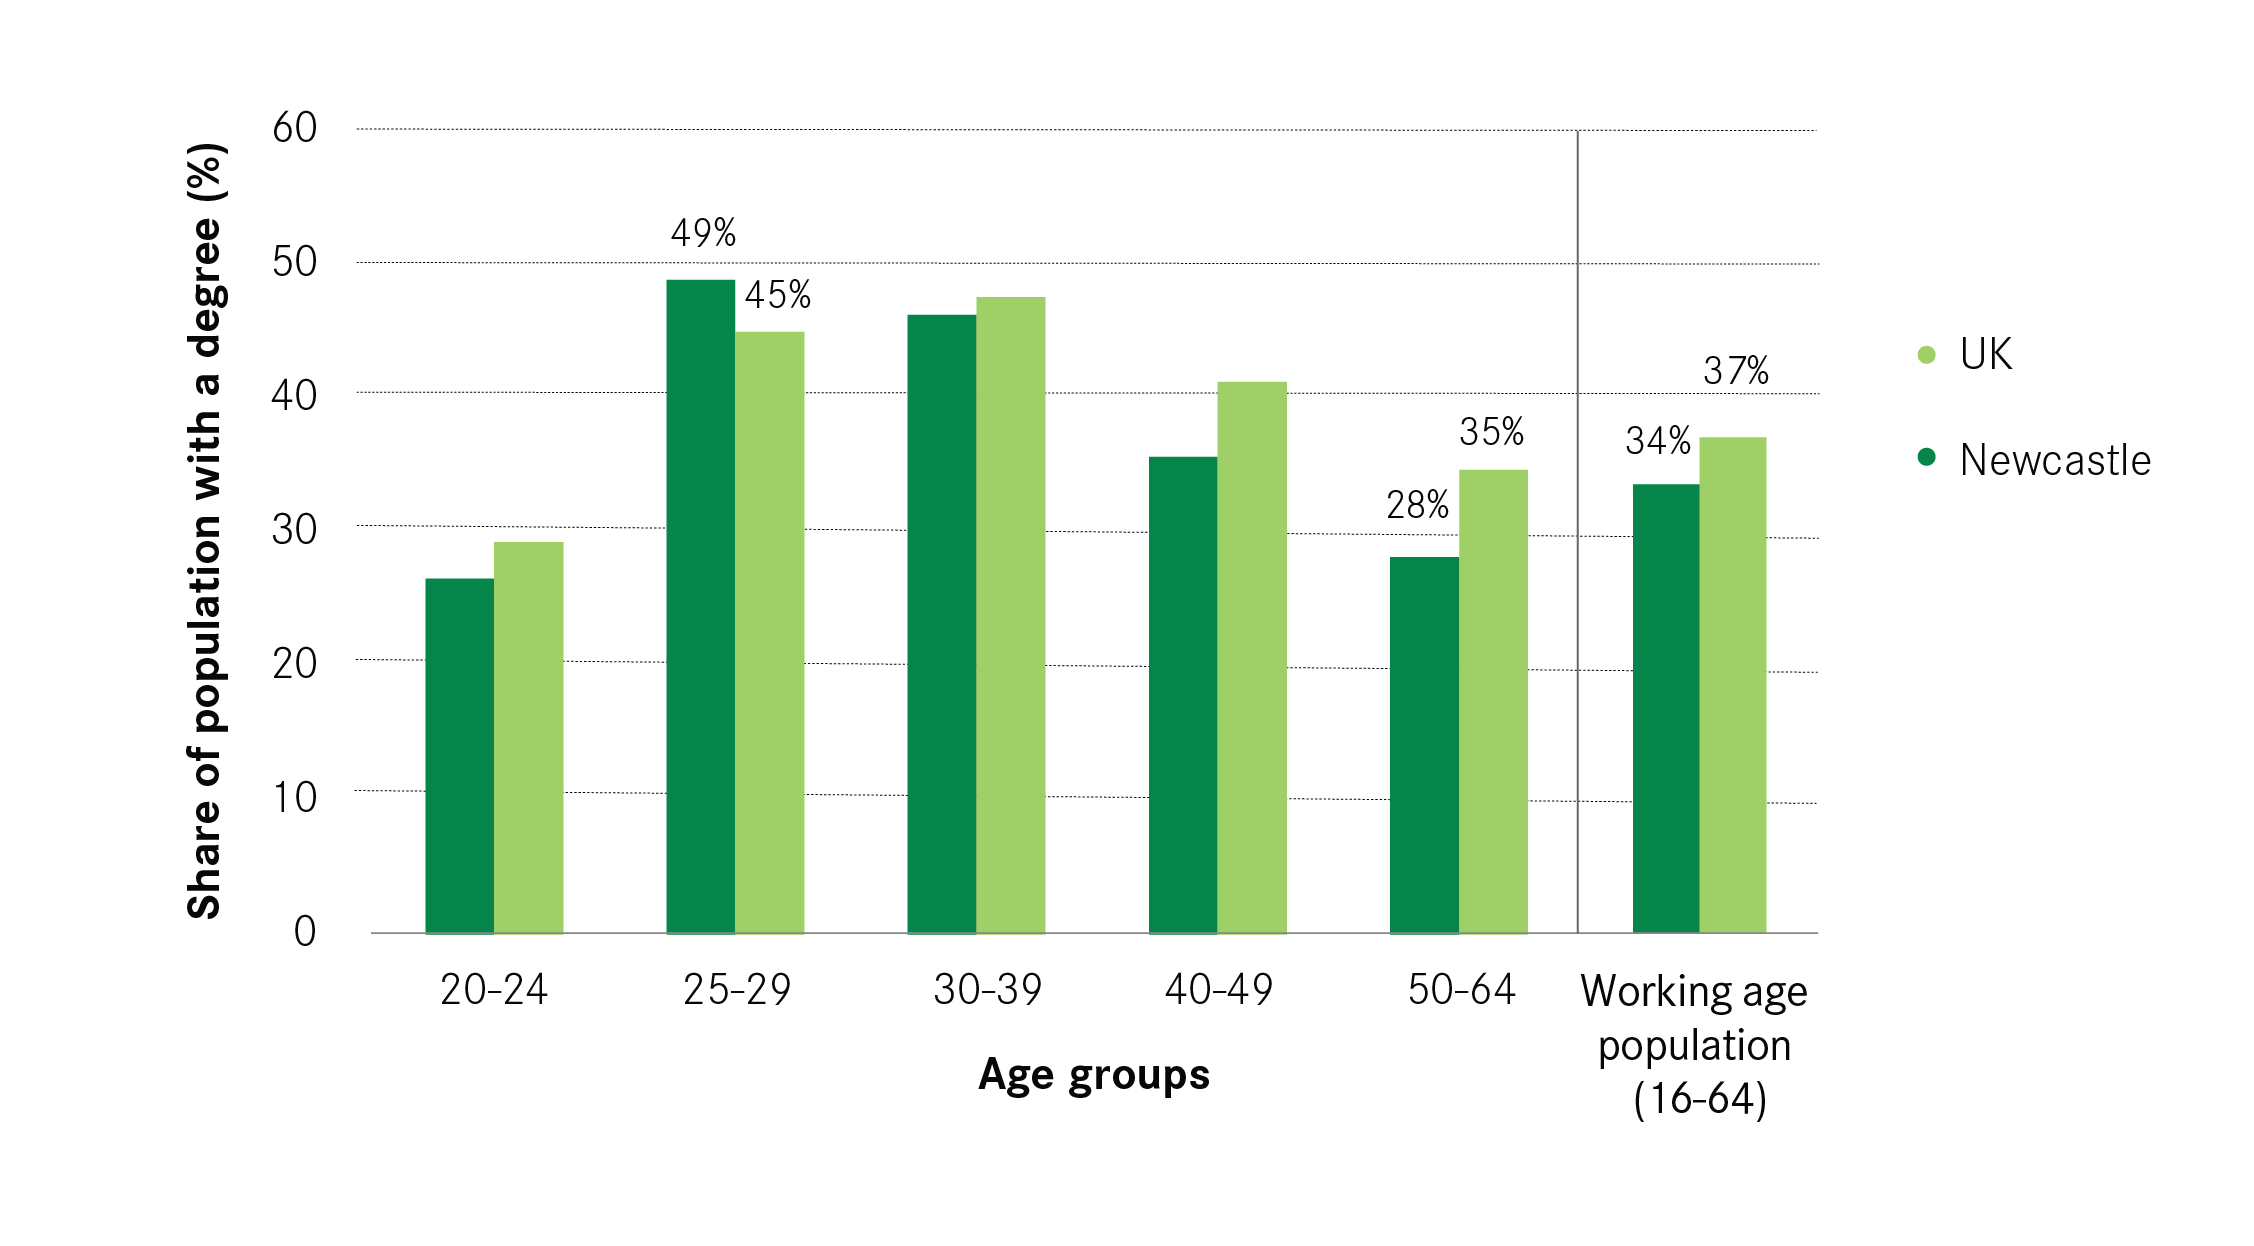
What is interesting is that this gap is driven by the older residents of Newcastle. As Figure 32 shows, it is the older age-groups which have the lowest likelihood of holding a degree. Only 28 per cent of Newcastle’s 50 to 64 year olds are graduates, whereas 35 per cent of the UK’s population in this age group have a degree. On the other hand, a higher share of Newcastle’s 25 to 29 year olds have a degree than the age group nationally, 49 per cent compared with 45 per cent. However, this is much a narrower age group, accounting for a smaller share of the population than 50 to 64 year olds, so this alone is not enough to close the overall skills gap.
Figure 32: Share of Newcastle’s population with degree level qualifications, by age, 2015
Young workers in the city are therefore more highly-skilled than the UK average. This is in part due to Newcastle’s success attracting in and retaining new graduates who live in and around the city.9 To provide some context, the city’s overall skill level can be compared to the new graduate workforce (see above).
If, in 2015, Newcastle’s share of graduates was equal to the national share, i.e. 37 per cent rather than 34 per cent, the city would have an additional 18,730 graduates. The annual cohort of recent graduates working in Newcastle is approximately equal to 5,000 people.10 This shows that the increase in new graduates that the city gains each year is not insignificant, and will play a role in improving the overall skills profile of the city as a whole.
It’s important to note that these figures are for illustrative purposes only. Over time, the UK average is likely to increase, while as section 1 showed, the outflow of older graduates to the rest of the North East will have a downward pull on the number of degree-holders in Newcastle. In addition, if the skills level of the city’s workforce was to increase significantly the economy would need to adapt to ensure enough high-skilled jobs were on offer.