04The nature of the new graduate workforce
This final section looks at the characteristics of the new graduate labour market in Crawley.
Four fifths of new graduates working in Crawley came from elsewhere and tended to be higher achievers.
Figure 17 brings together all graduates who decided to work in Crawley on graduation to provide an overview of the nature of the graduate workforce in the city. Four fifths of new graduate workers in Crawley came from elsewhere and 20 per cent of all new graduate workers moved away from Crawley for university and returned on graduation.
Figure 17: The components of the new graduate workforce, 2013/14 – 2014/15

In terms of the class degree achieved, Crawley’s graduate workforce had a higher share of graduates with a
First or Upper Second Class degree than the UK as whole (Figure 18). Whilst it had the same percentage of new graduates with a Russell Group First & Upper Second as the UK average, it had a higher share of new graduates with a non-Russell Group First & Upper Second class degree – 61 per cent compared with 55 per cent.2
Figure 18: Share of working new graduates by class of degree, 2013/14 – 2014/15

Graduates wages in Crawley
Graduates working in Crawley earned on average £23,800 a year, which was above the mean UK graduate wage of £23,100. This puts Crawley 9th out of all British cities, as shown in Figure 19.
However, analysis of UK graduates finds that graduates’ wages was not the main reason why graduates choose their employment location.3 Other factors such as the type of jobs available in that city and the opportunities for career progression are more important.
Figure 19: Mean new graduate wages of top15 UK cities, 2013/14 – 2014/15
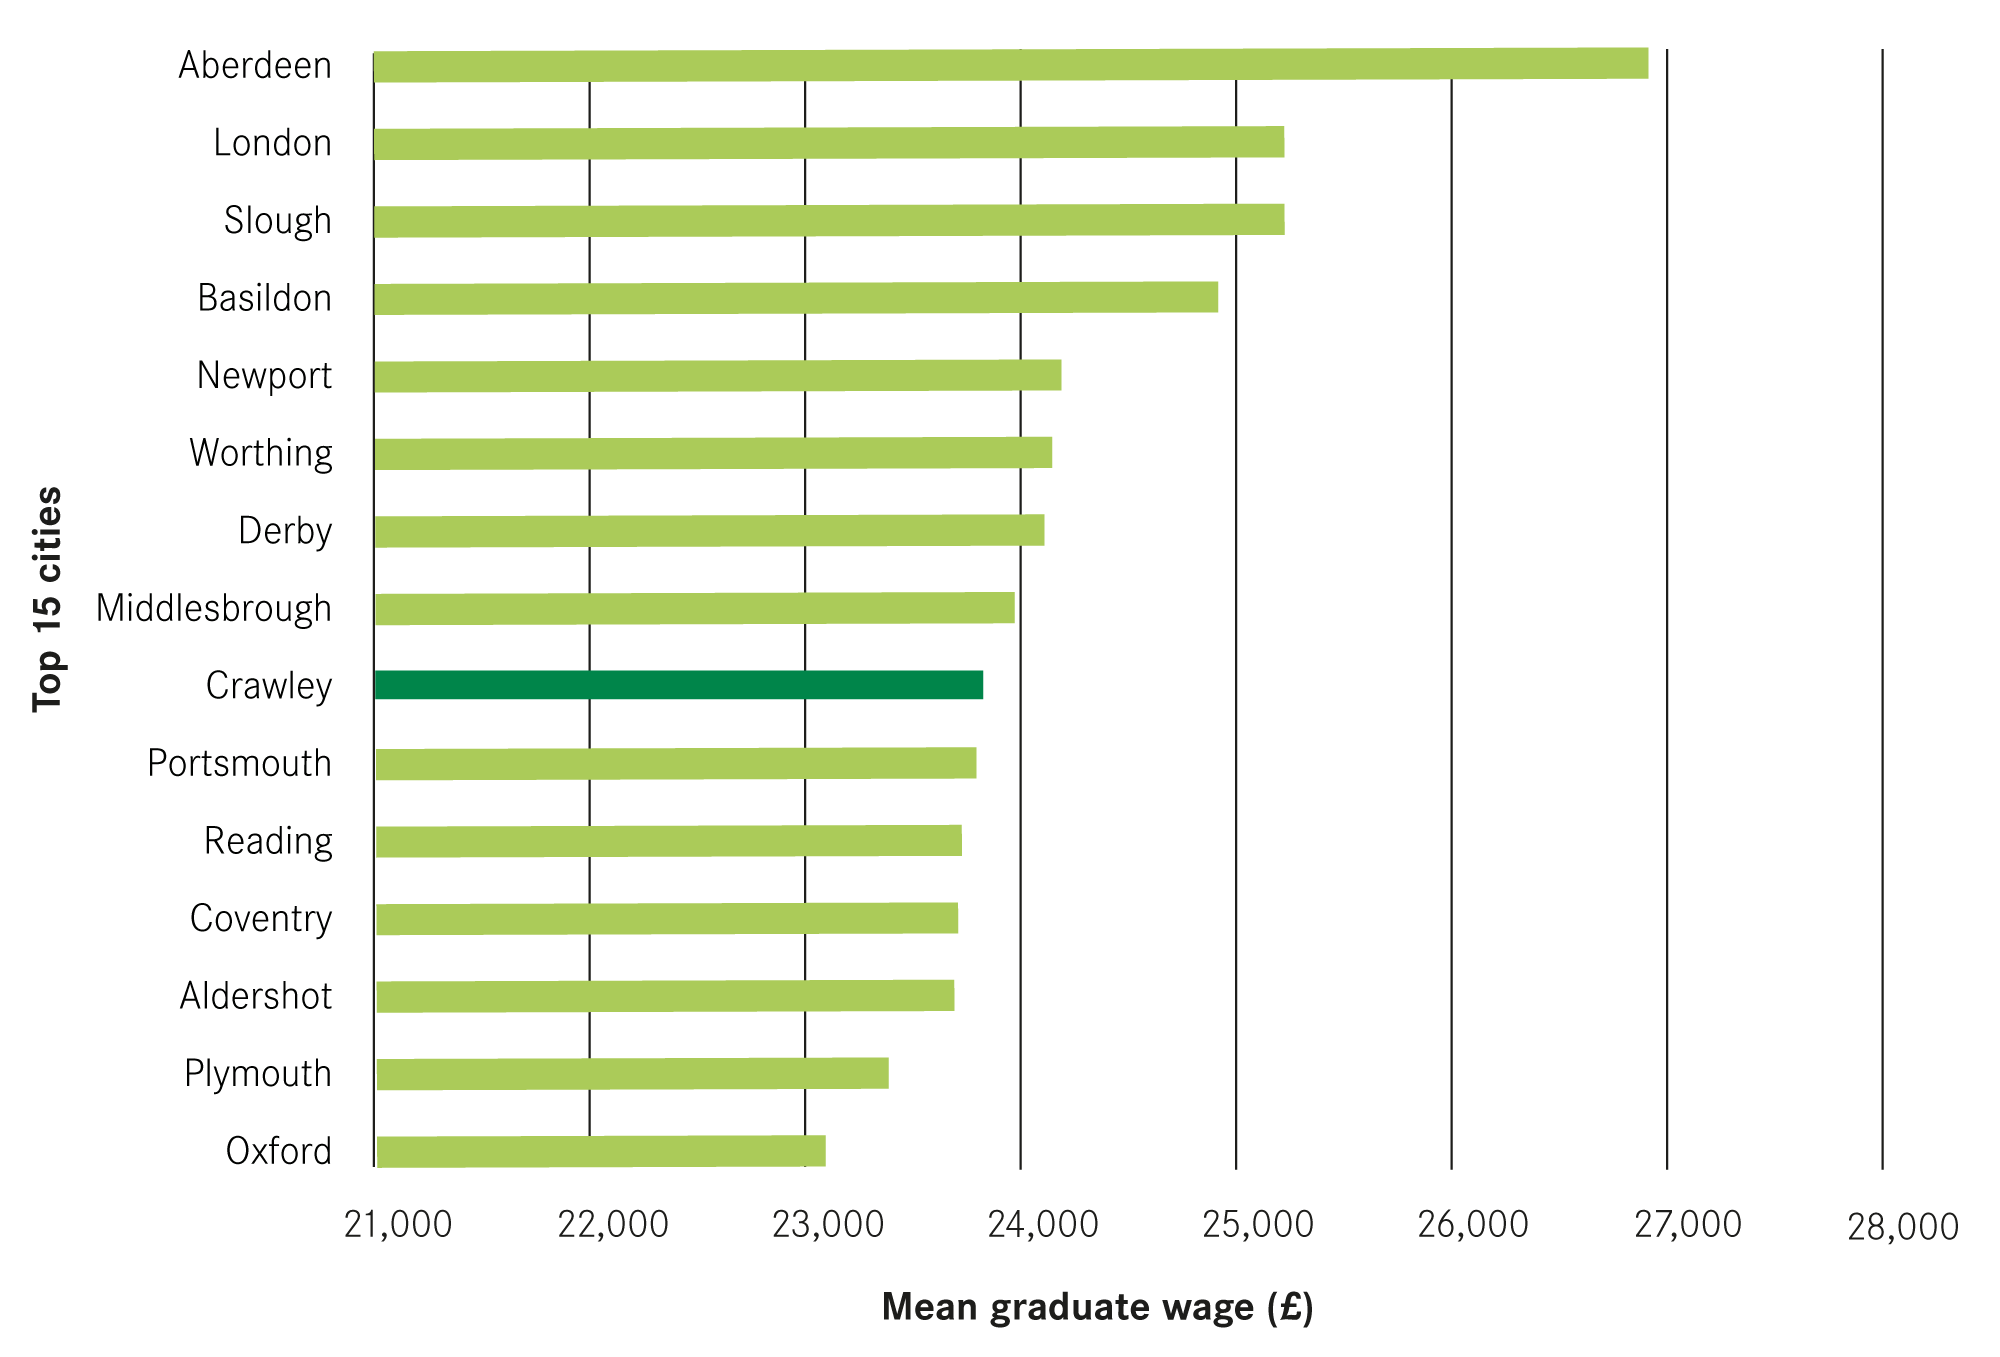
Figure 20 shows the average wages for three migration groups: those who left Crawley for university and returned upon graduation; those who moved into Crawley for work but had no prior links to the city; and those who left Crawley for university and did not return.
The data shows that there were no significant differences in wages between those who moved into Crawley for work and those who left the city. Interestingly, there was a significant gap between these two groups and those who returned to Crawley after graduation. When we look at those who work in Crawley in terms of the class degree achieved, those who moved in for work were more likely to have a First or Upper second class degree from a Russell Group University (19 per cent) than those who returned to Crawley (3 per cent).
Those who had no prior links to Crawley were also less likely to have achieved a Lower Second, Third or Pass degree from a non-Russell Group University (17 per cent) than those who were originally from Crawley (34 per cent). This might partially explain the differences in wages. Non-economic reasons such as new graduates wanting to work in their hometown might also explain this trend.

Crawley has the lowest share of new graduates working in the public sector
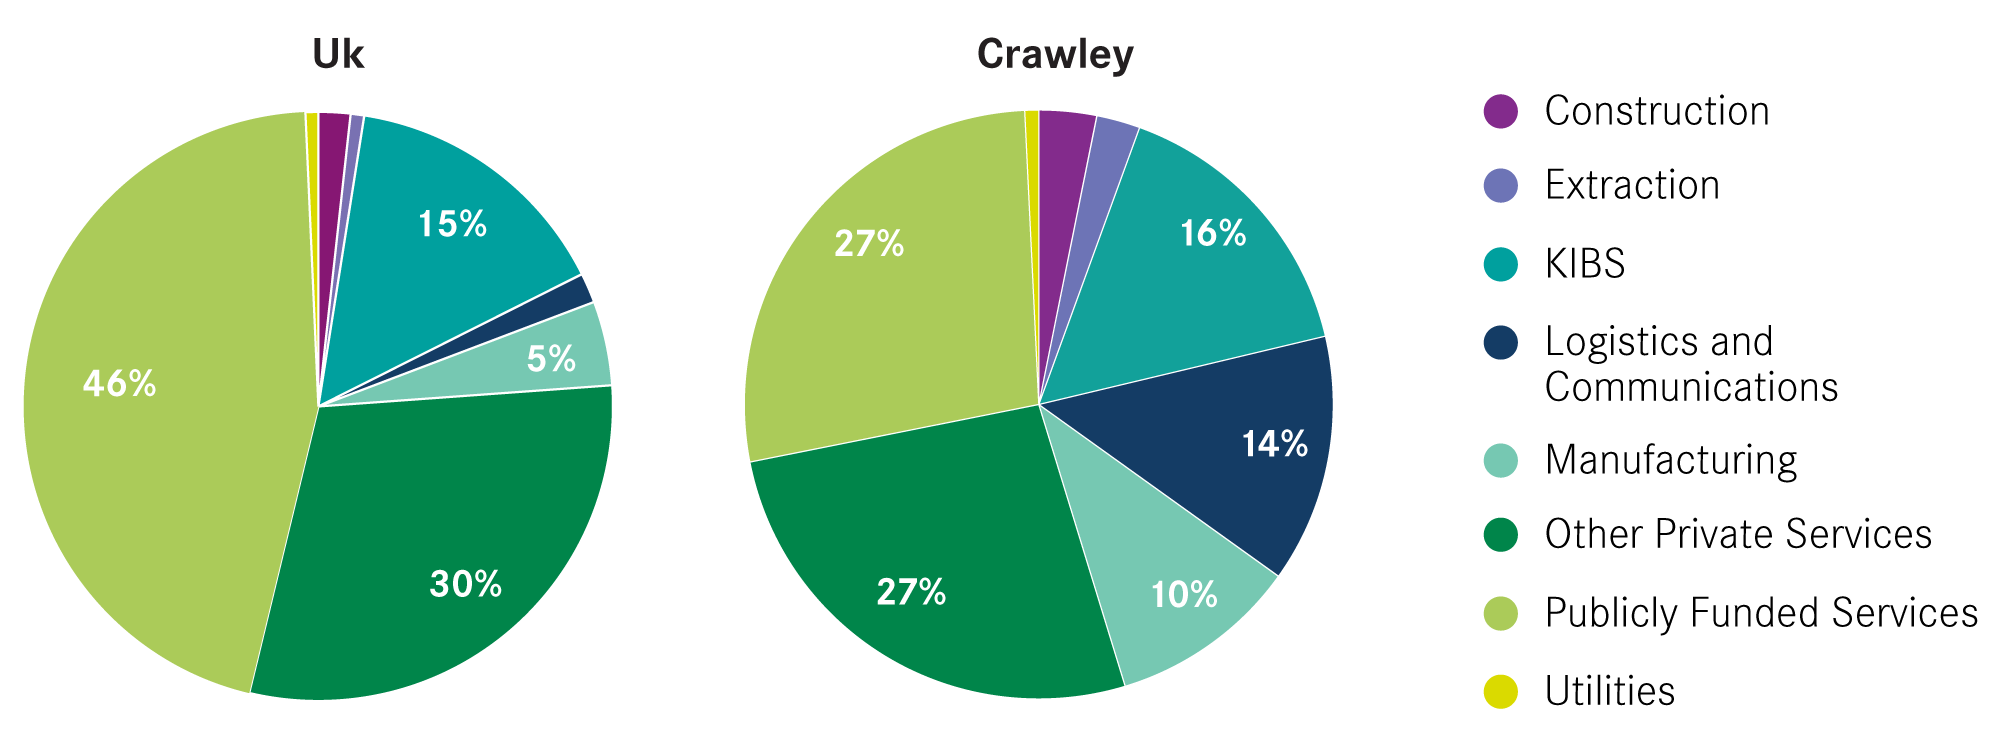
Figure 21 shows that the largest share of new graduates working in Crawley – 27 per cent – were employed in publicly-funded services jobs. But this was the lowest share among UK cities and indicates the strength of Crawley’s private sector. Crawley had the highest share of new graduates working in the Logistics and Communication industry. Looking at a finer industrial breakdown shows that 7 per cent of new graduates were employed in air transport, not surprising given the size of Gatwick Airport. Interestingly, Crawley had the 6th highest share of new graduates working in manufacturing, while it also had the 14th highest share of new graduates employed in private knowledge intensive business services (KIBS).
Figure 21: Share of graduates in Crawley working in each sector, 2013/14 – 2014/15
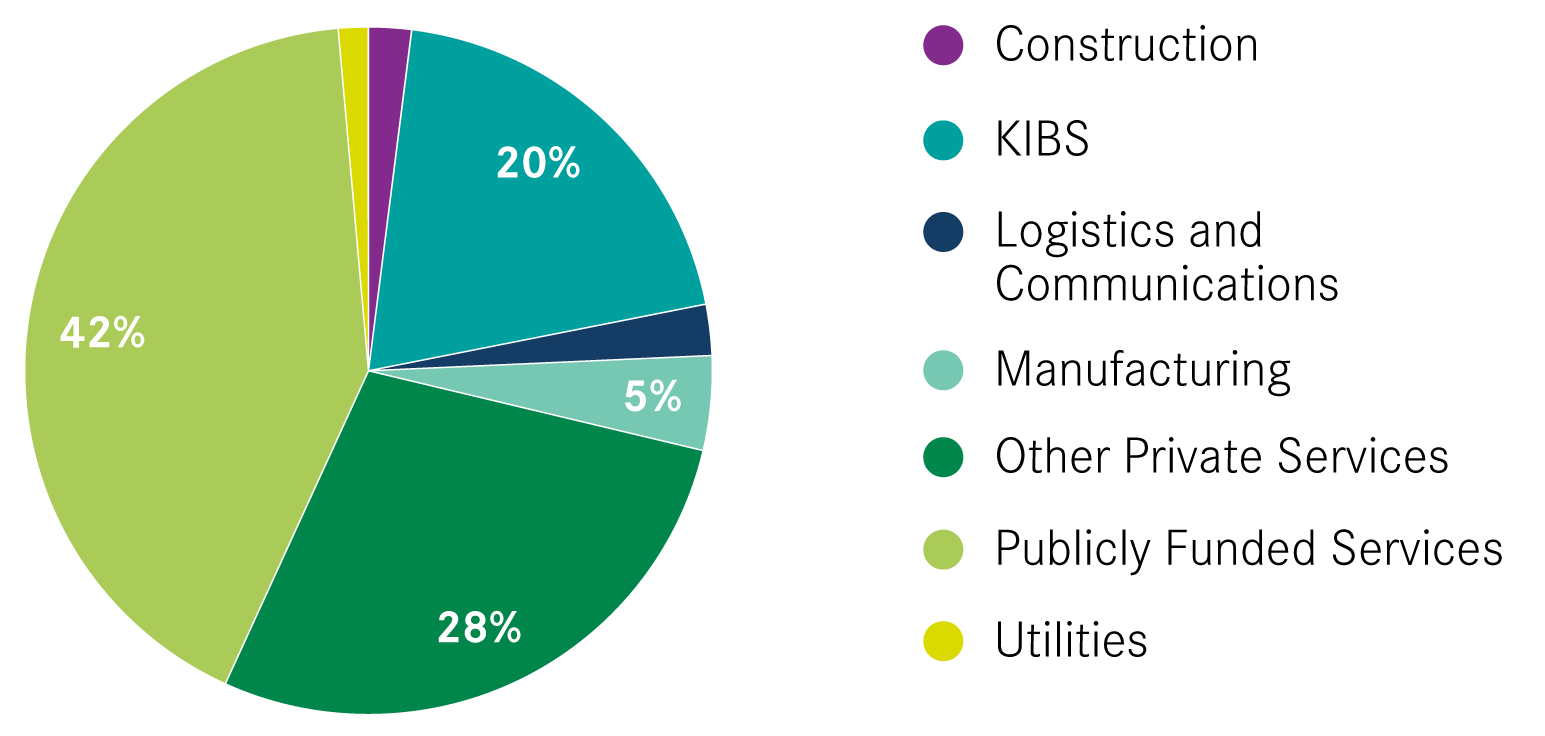
In contrast, the picture of those graduates who did not return looked very different (Figure 22). A much higher share worked in publicly-funded services jobs although this was still lower than the UK average – 20 per cent of this group worked in KIBS jobs, higher than the national average and reflective of the flows of this cohort to London.
Figure 22: Share of students from Crawley working elsewhere in each sector , 2013/14 – 2014/15