
03The nature of the new graduate workforce
This final section looks at the characteristics of new graduates labour market in Coventry.
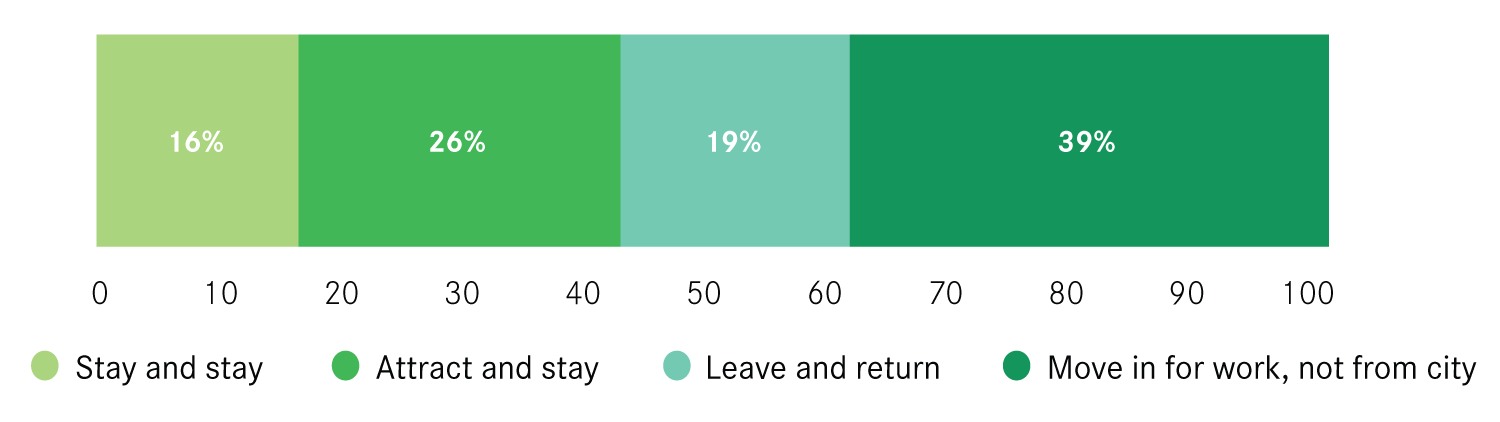
Figure 19 brings together all graduates who decided to work in Coventry on graduation to provide an overview of the nature of the graduate workforce in the city. 16 per cent of all graduate workers were home-grown: growing up, studying and subsequently working in Coventry; more than a quarter of workers had come to study in Coventry and stayed for work; and 39 per cent of new graduate workers had been attracted in from elsewhere, the 34th highest among UK cities.
Figure 19: The components of the new graduate workforce in Coventry, 2013/14–2014/15
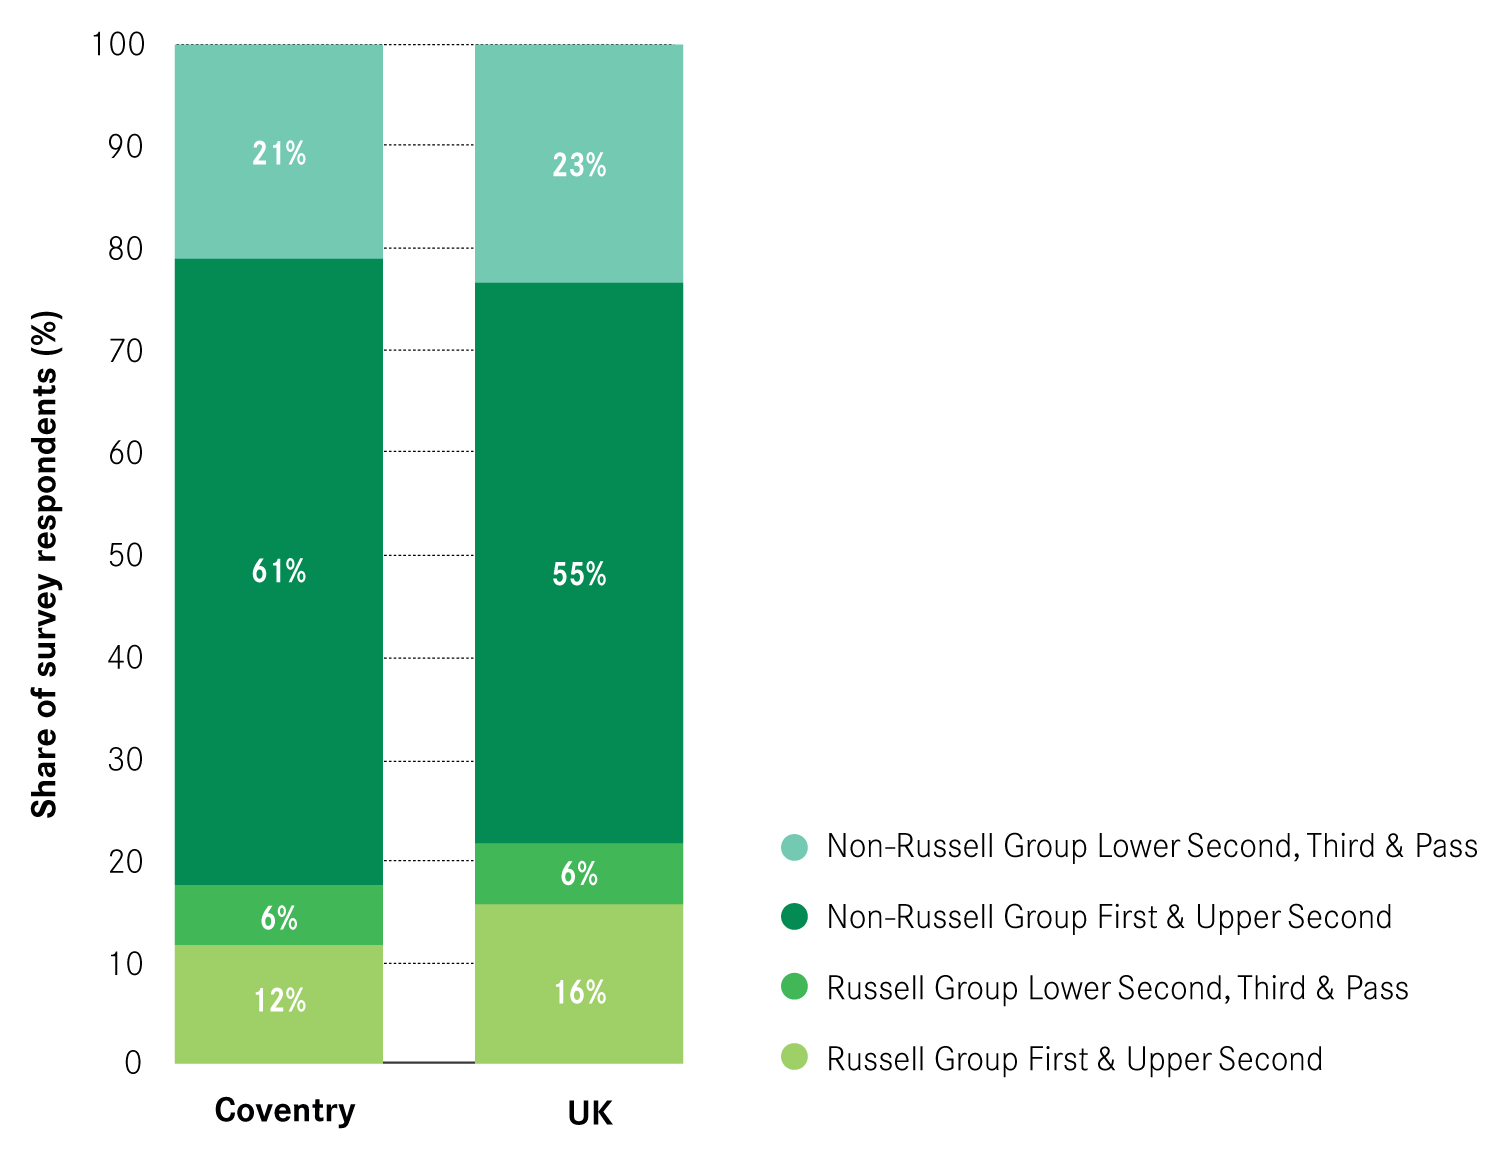
In terms of the class degree achieved, the composition of Coventry’s graduate workforce was slightly different from the UK average. Coventry had a lower share of graduates with a First or Upper Second Class from a Russell Group University – 12 per cent – than the UK as a whole – 16 per cent . However this was counter-balanced with a higher share of graduates with a First or Upper Second Class degree from a non-Russell University than the UK.
Figure 20: Share of new graduates by class of degree, 2013/14–2014/15
Graduate wages in Coventry
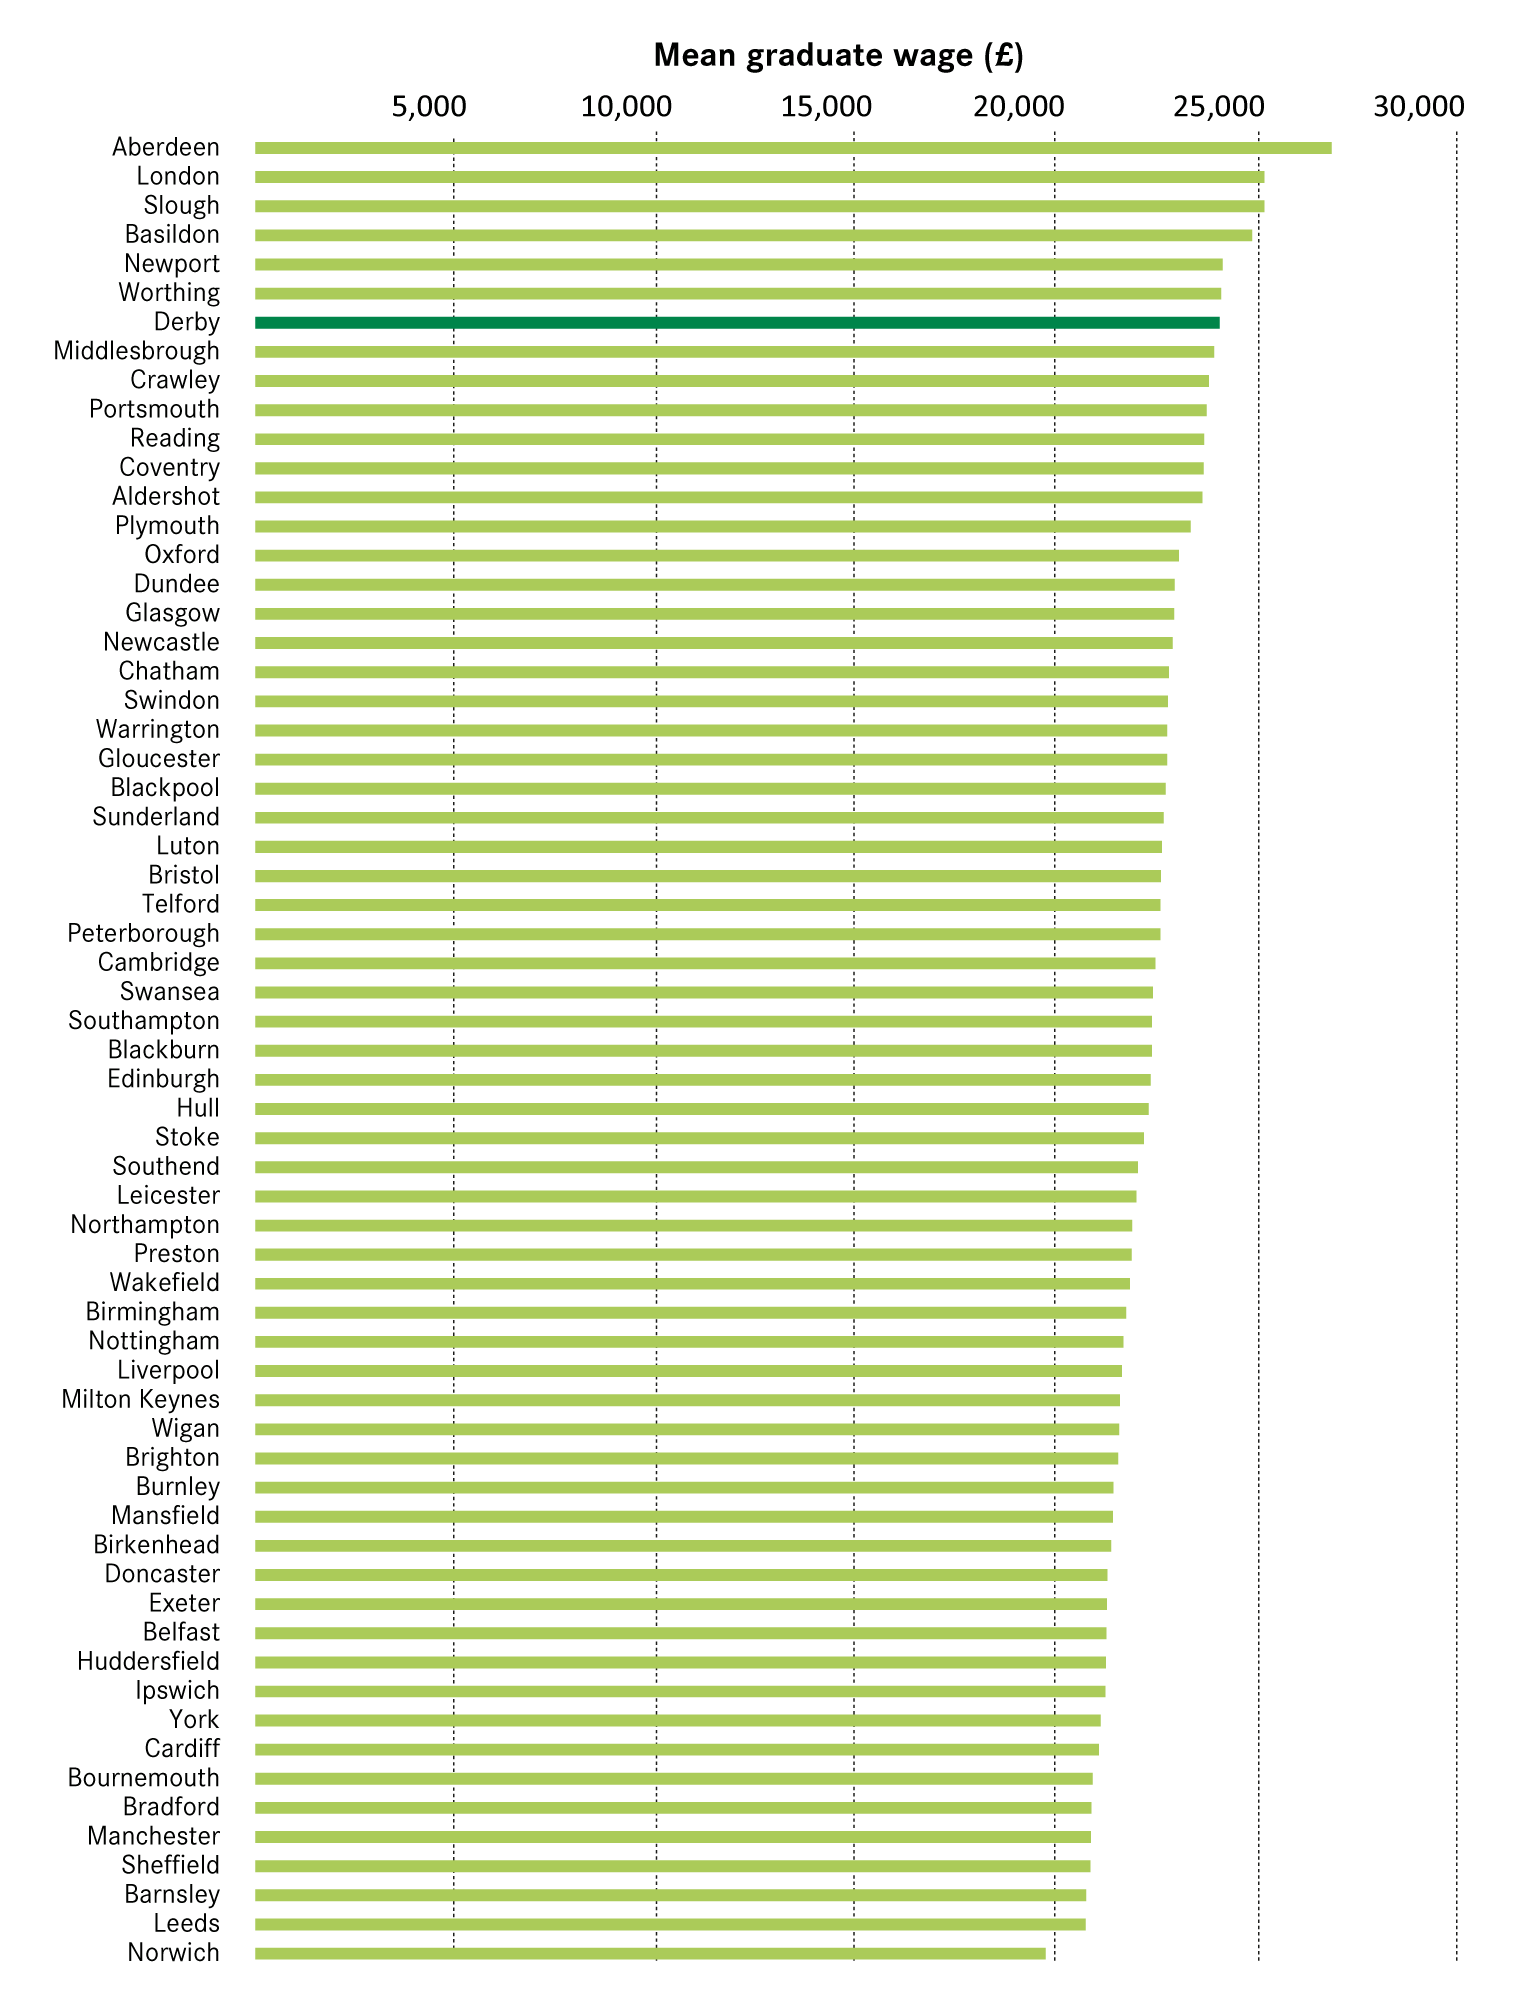
Graduates working in Coventry earned on average £ 23,690 and this is the 12th highest graduate wage among UK cities, as shown in Figure 21.
Figure 21: Mean graduate wages of each UK city, 2013/14 – 2014/15
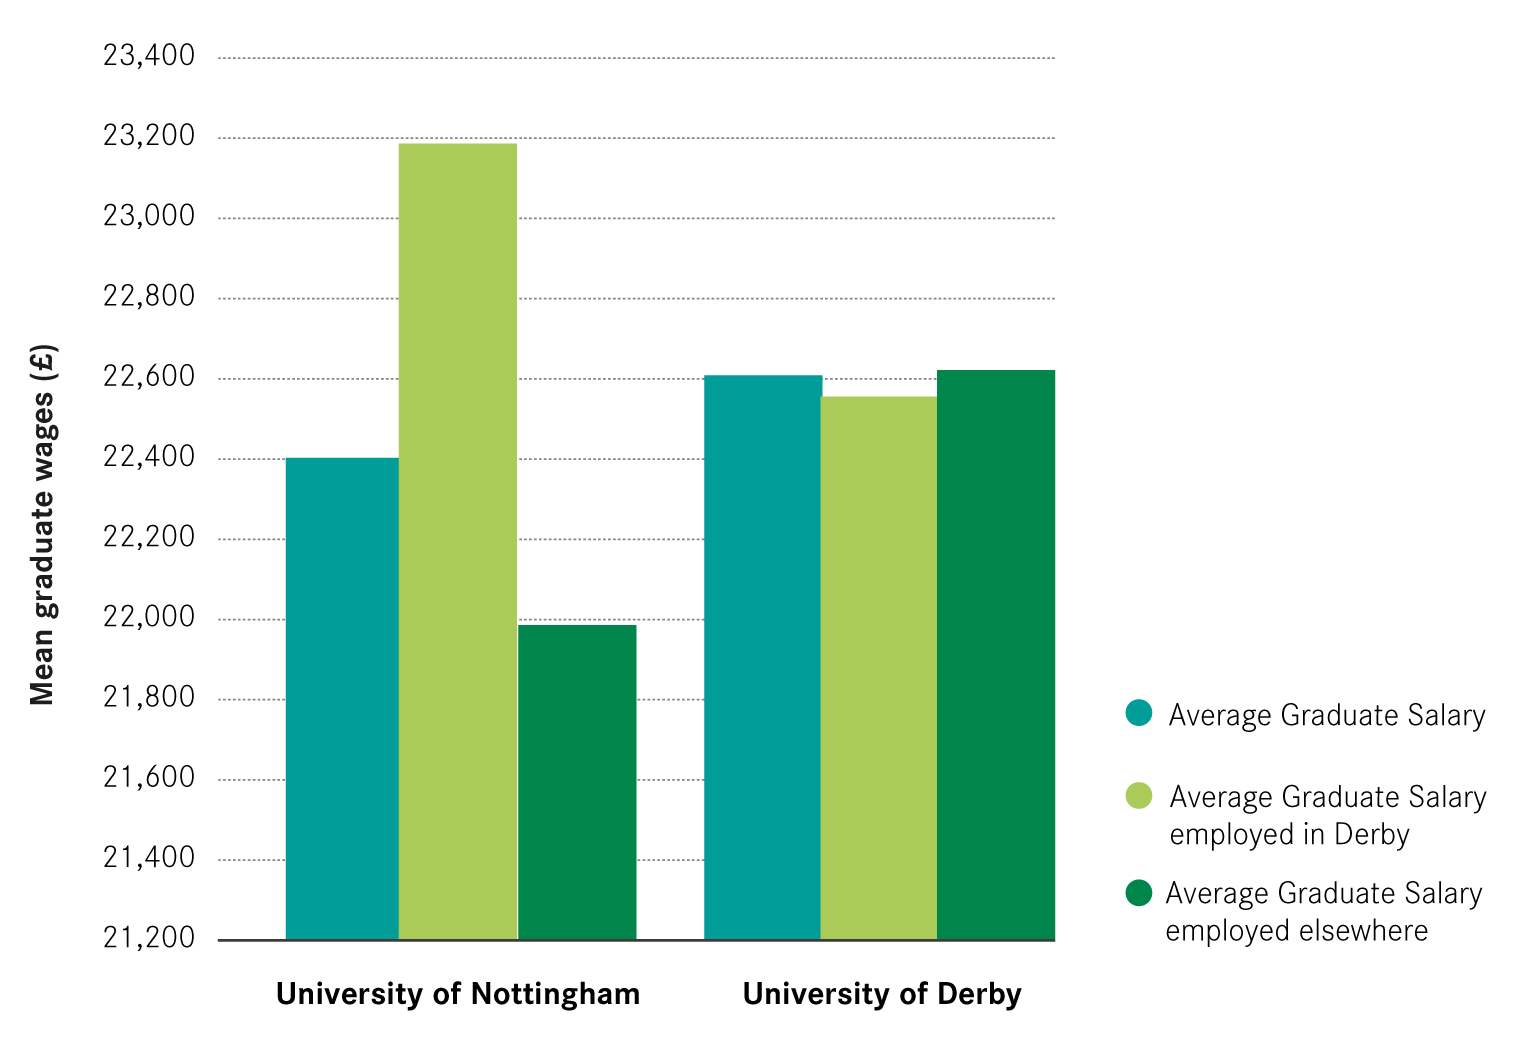
In terms of institutions, Figure 22 shows that the average salary of a University of Warwick graduate was higher than one from Coventry University. New graduates from both universities earned more when they worked elsewhere than when they worked in Coventry.3
Figure 22: Mean graduate wages by institution and location of employment, 2013/14 – 2014/15
However, analysis of UK graduates finds that graduate wages were not the main reasons why graduates chose their employment location. Other factors, such as the type of jobs available in that city and the opportunities for career progression, were more important.4
Coventry had the third highest share of graduates working in manufacturing
Manufacturing is a large employer of new graduates in the city. Figure 23 shows that 13 per cent of all graduates working in Coventry were employed in this sector, the 3rd highest among UK cities after Derby and Basildon. However, the most popular employer of graduates in the city was the publicly-funded services sector, with the share of graduates in this sector – 54 per cent – substantially higher than the UK average – 46 per cent. In contrast, at 9 per cent, the share working in private knowledge intensive businesses services (KIBS) was lower than the UK average – 15 per cent – and the 38th highest among UK cities.
Figure 23: Share of new graduates in Coventry working in each sector, 2013/14–2014/15
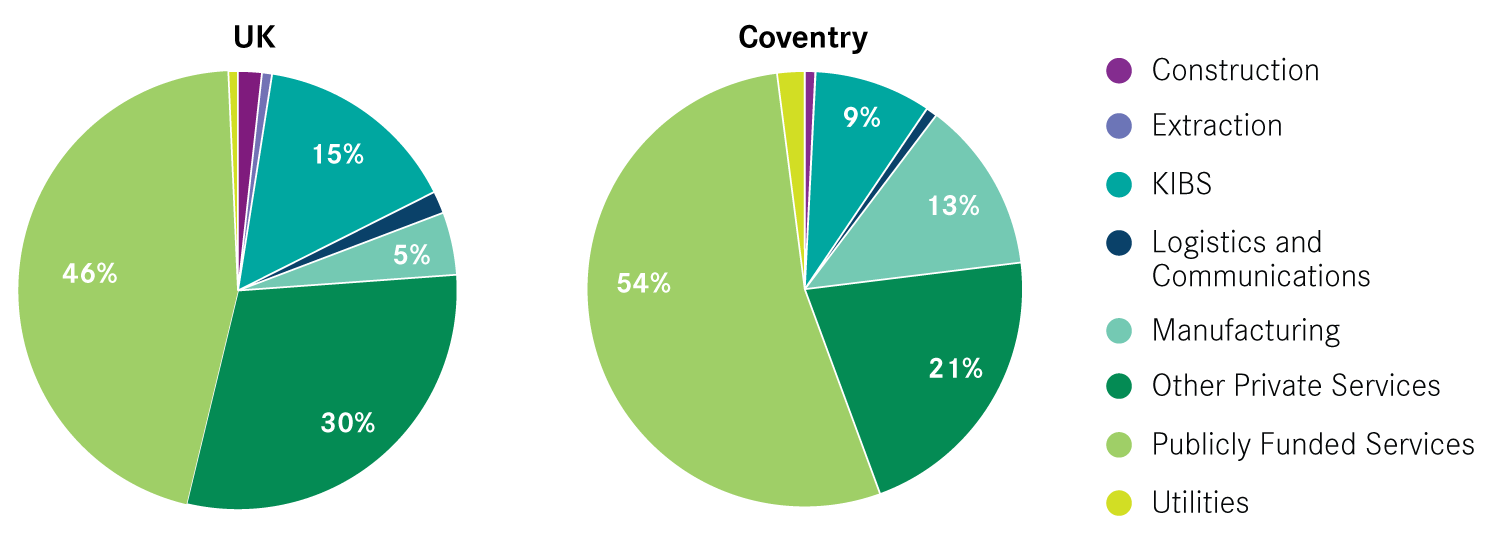
Looking at a finer industrial breakdown shows that in the manufacturing sector,11 per cent of all new graduates worked in the manufacture of motor vehicles, trailers and semi-trailers. In the publicly-funded services 29 per cent of all new graduates worked in education and 19 per cent in health and social work. In other private services 5 per cent of all new graduates were employed in retail.
But different industries play different roles in attracting graduates into the city
The origins of new graduates working in Coventry varied by industry. Manufacturing played a prominent role in attracting new graduates from elsewhere: 62 per cent of new graduates in manufacturing did not have any prior links to Coventry. In contrast, this was 34 per cent for publicly-funded services. This shows that the two sectors play different roles, with manufacturing pulling new graduates from others parts of the country and publicly-funded services providing jobs to local graduates. The attractiveness of the manufacturing sector should be seen as a positive as this contributes to the overall size of the city’s new graduate workforce.
Figure 24 shows that manufacturing also played an important role in attracting new graduates with the highest level of qualifications. 38 per cent of new graduates who moved to the city with a First or Upper Second from a Russell Group University worked in manufacturing and this is far larger than its share of new graduates overall. At 34 per cent, publicly-funded services accounted for the second largest share of this cohort.
Figure 24: Where Coventry’s new highest achieving graduates work
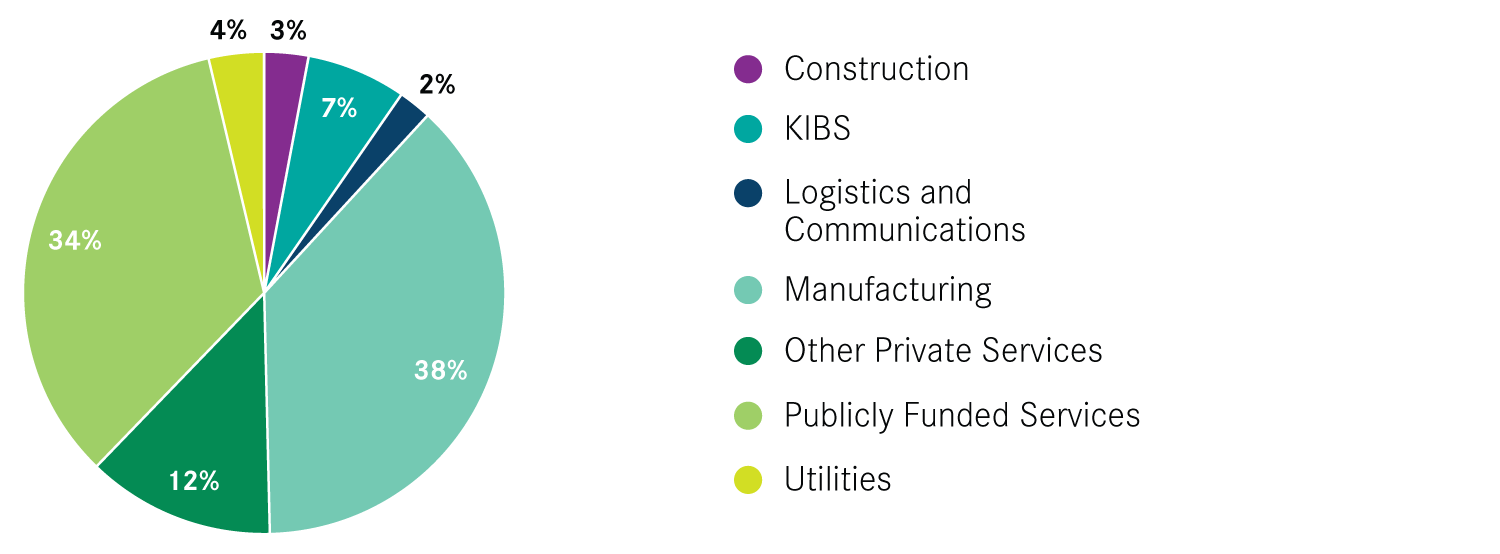
Note: The chart includes new graduates moving to Coventry for work who are not from the city, with a First and Upper Second degree from a Russell Group University.