03What role does transport play in densifying city centres?
While much is said about transport and the need for investment in it, there is little information about the performance of transport systems across cities. This, coupled with current and likely future demand generated from the growth of city-centre economies, is an important assessment to make when deciding on investment in new transport infrastructure. To what extent is the lack of transport a barrier to city centre success? And do all cities need additional investment in new transport infrastructure?
Box 5: What is meant by investment in new transport infrastructure?
Transport infrastructure is the permanent fixed network of assets that allow for people and goods to move easily such as roads, railways, ports and airports, as well as the vehicles and facilities to make use of and maintain them. This report focuses on investment in major upgrades, brand new schemes and/or significant improvements to increase capacity and speeds, such as new trams, or upgrading road networks to support Bus Rapid Transit. Investment in new freight transport infrastructure that frees up capacity for more passenger services on existing rail lines should be considered in response to the findings of this report.
This report does not look at the maintenance of existing infrastructure, but this should be supported by government in line with the NIC.
This section looks at data from the NIC that aims to provide a sense of how quickly the transport system in a city links people to job opportunities in city centres (see Box 6). This includes travel by private car and public transport, and combines it with data on how people use the existing transport system to access city-centre jobs to understand where transport may be holding back growth.
Box 6: City definition and NIC intra-urban employment accessibility index methodology
Centre for Cities uses primary urban areas (PUAs) in its analysis of economic activty and how it is concentrated. For the purposes of this report, some of the NIC’s data covers a wider area than these PUAs so ‘Brighton’ covers Brighton and Worthing PUAs, ‘Leeds’ covers Leeds, Wakefield, Bradford and Huddersfield PUAs, and ‘Portsmouth’ covers Portsmouth and Southampton PUAs.
Box 7: Understanding the data
The data in Figure 3 measures transport connectivity from where people live in each of the Built Up Areas (BUAs) to the centre of the Output Area (OA), or contiguous set of OAs in the BUA with the highest number of jobs. The minimum journey time is calculated from each OA to the defined city centre for (i) the public transport option and the private vehicle option, and
(ii) the public transport option only. The public transport option includes average waiting time for peak services.
These outputs are divided by the time it would take to travel in a straight line from the start point to the city-centre destination at 50kph (31mph). A connectivity value of 1 is equivalent to being able to travel at 50kph in a straight line from origin to employment destination in the city centre.
The light green line measures the private vehicle option. Milton Keynes’ score of 0.83 suggests that average commutes from within the BUA to the city centre are not too far from achieving 50kph in terms of directness and speed at peak times. The purple line measures the fastest public transport option and is slower in everywhere. Exeter’s public transport system is the best in the country for getting workers into the city centre during the peak, with an average score of 0.39, while Telford has the lowest score at 0.16.
This data gives a score based on the average speed of the commute. It does not give direct information about the cost, comfort, convenience or any other factor that also influences whether and by what mode people commute into city centres at peak times. It is also a weighted average across the city, so it does not capture individual corridors or bottlenecks that are impeding connectivity and may make for frustrating individual journeys.
Why focus on peak-time journeys?
The peak-time accessibility of the city centre is important for two reasons. The first is that the city centre is the single most common destination for journeys in a city because of its economic role. The second is that the peak is the most common time when people are making journeys, when most pressure is put on transport systems. This spatial and temporal concentration of demand for journeys puts transport networks under the greatest strain, leading to congestion on roads or crowded buses, trains and trams.
Peak-time transport accessibility into city centres is growing in importance even as the overall numbers of commuting journeys falls, and changing work patterns mean five-day commuting is in decline.7 The headline reduction in commuting trips nationally masks the growing number of peak- time journeys into successful city centres on weekdays that make their roads, buses, trams and trains increasingly congested.8
The NIC data is not perfect. It is limited in that it looks at the average journey and so does not allow for bottlenecks – the average journey for a city may be much quicker than some commuters experience on specific routes. In addition, as Box 7 makes clear, the built-up areas used in the data do not always align with the primary urban areas, which Centre for Cities considers to be a better reflection
of the functional economic geography of the places. Nevertheless, the data provides important insight and a consistent national comparison for the nature of transport provision and use in these cities and large towns and how it relates to economic performance.
Congestion is not a major issue into many city centres
In most places accessing city-centre employment by the fastest route is reasonably quick, even at peak times. Figure 3 uses the NIC data to set out the performance of transport networks in British cities and large towns in order of the fastest possible journey into the city centre. The light green bars show the accessibility for a journey by the fastest mode – which the NIC’s modelling calculates is always by car – whereas the purple bars refer to the speed of the journey by the quickest public transport route.
The most striking finding from the data is that, in most places, congestion is likely to be a minor constraint to linking workers with city-centre jobs even if there are some bottlenecks and delays on a few roads at the height of rush hour. Figure 3 shows that in 45 of the 57 cities and large towns measured, the city-centre jobs accessibility score (the fastest journey) is between 0.70 and 0.79 where a score of 1 would indicate a “perfect accessibility”.9
Figure 3: NIC’s employment accessibility score by fastest mode (car) and fastest public transport, 2016
![]()
Those with the best NIC accessibility scores are either:
- Strongly-performing cities or new towns with relatively small city-centre economies, such as Aldershot, Telford and Crawley. In these places, the more dispersed nature of jobs means that there are fewer bottlenecks which hinder a smooth commute to For new towns such as Milton Keynes, which were planned and built for travel by car, their high-capacity road networks have been able to handle the levels of demand to travel into the city centres even where this has grown rapidly.
- Places with weaker city-centre economies, such as Derby and Doncaster, have good intra-urban employment accessibility as the low number of jobs in the centre means there is lower demand to travel there. As a result, the existing capacity of the road network supports largely free- flowing traffic on average. In these cities, good car accessibility is a symptom of a weak city centre
City-centre accessibility decreases with increasing jobs density
According to the NIC data, those cities with the lowest accessibility scores are those with the densest city centres, i.e. those city centres that have the largest funnelling of commuters into them at peak times, and show consequently higher levels of congestion. Figure 4 illustrates this negative relationship between the NIC accessibility score (irrespective of mode) and the density of jobs in the city centre. In the bottom-right quadrant – B – are city centres such as Manchester’s, which has 268 jobs per hectare and an accessibility score of 0.63, and London, which has 543 jobs per hectare in the city centre and an accessibility score of just 0.45.
In contrast, city centres in the top-left quadrant – D – are much less dense and have much faster access according to the NIC data. This includes centres such as Aldershot, Telford and Newport. Aldershot’s centre for instance has just 38 jobs per hectare and a higher NIC accessibility score of 0.81. Congestion into these city centres is much less of an issue on average.
It is the economic geography of a city or large town that plays a fundamental role in the speed of the transport system into the centre. An increasing number of jobs in the centre, which leads to an increase in journeys into it, necessarily slows down commuting by private transport as more cars compete for limited road space.
Figure 4: NIC’s employment accessibility score by fastest mode (car) against city centre jobs density
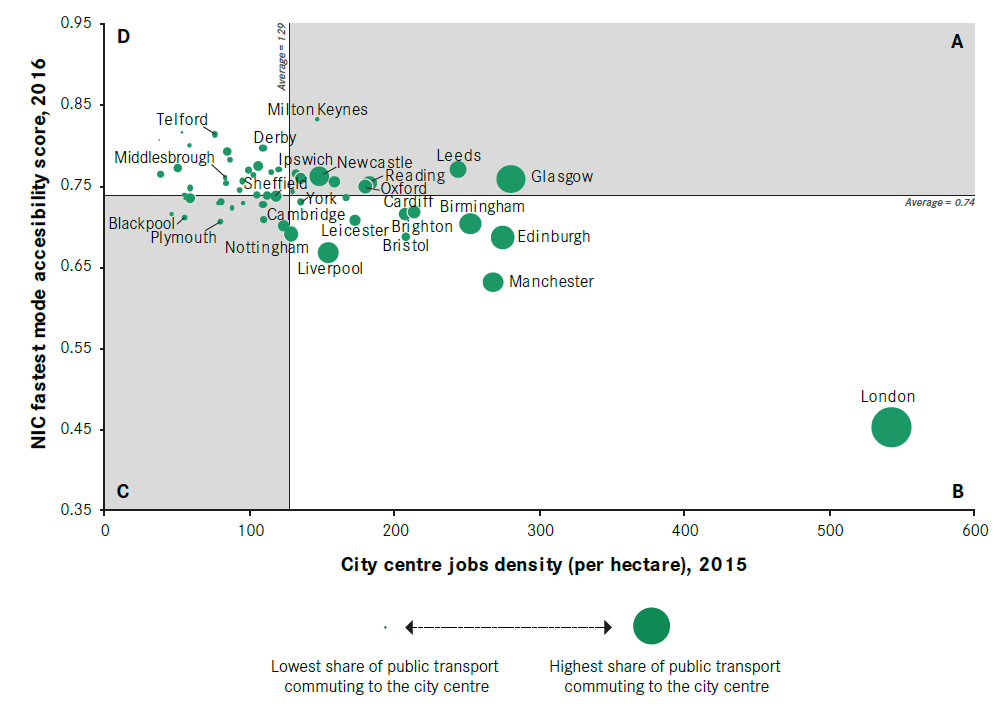
These patterns tend to influence whether a commuter decides to travel by public or private transport. As the bubbles in Figure 4 show, commuting by public transport increases as density increases and accessibility falls. While only 12 per cent of city-centre workers in Telford (the place with the highest accessibility score) commuted by public transport in 2011 (the most recent data available), 80 per cent of London city-centre workers did so.
This occurs because of the shift in balance of the relative costs and benefits between travelling by car and public transport that a larger city-centre economy creates. As the NIC data above shows, car travel is still quicker than public transport into every city centre in Britain. But the narrowing of this gap for the densest city centres, combined with other associated costs, such as parking charges, and in London’s case, the Congestion Charge, means that in Manchester and Birmingham around half of all city-centre commuters chose public transport in 2011.
Of course, public transport is not the only alternative to the car – walking and cycling are options too. But these options are far more popular choices in smaller cities such as Cambridge and York (where walking and cycling account for 41 per cent and 40 per cent of city centre commutes respectively) than for larger cities such as Liverpool or Manchester.
Bristol stands out as a major city with very high levels of walking and cycling into the city centre (32 per cent), which is a function of the higher share of city centre workers living in neighbourhoods around the city centre. These may be desirable because of the quality of housing, schools or shopping and cultural amenities. It may also be that the weakness of public transport accessibility further out from the city centre puts a higher premium for city-centre workers on housing within walkable distance.
There are two implications. Firstly, a growing city centre needs a transport system that allows an increase in commuters into it, and significant growth requires substantial public transport capacity as the roads become congested for cars.
Secondly, most cities with weak city-centre economies — those in quadrant D — have significant road capacity to support jobs growth in the city centre without leading to congestion. These weaker cities should focus on encouraging more jobs to locate in the city centre and maintaining bus speeds. It is unlikely that new public transport infrastructure or upgrades will be of tangible economic benefit to residents or businesses in these cities in the short- or medium-term.
In contrast to the strongly-negative relationship between city-centre accessibility by car and jobs density, the relationship between public transport accessibility and jobs density is bell-shaped: accessibility to the city centre initially increases with jobs density but decreases after having exceeded a certain level of density (see Figure 5).
It is particularly the weaker and less-dense city centres that have worse public- transport accessibility. Lower demand to access the smaller number of jobs in the weakest city centres makes public transport less viable, meaning less frequent services that increase average waiting times and worsen public transport accessibility. Conversely, denser and stronger city centres generate higher levels of demand for services to access more jobs. This supports the provision of more- frequent city-centre services to meet this demand, bringing down average waiting times for passengers and increasing public transport accessibility.10
Figure 5: NIC’s employment accessibility score by public transport against city centre jobs density
![]()
Figure 5 suggests that there is a turning point in this relationship. While the relationship is positive up to around 200 jobs per hectare, after this point public transport accessibility begins to fall. This could be because greater competition for road space slows buses down after a certain point, or the necessary increase in traffic lights and junctions makes journeys longer. As the bubble sizes suggest though, this does not appear to deter public transport usage, suggesting that public transport remains the most efficient mode of transport to get people to work in these cities.
In part, this is because of other public transport options that are available that are not competing for limited road space. In these cities, the rail network has overtaken the bus or car as the single most important transport mode to access the city centre at peak times. Rail journey reliability and times are less affected by the higher demand that worsens car and bus accessibility. This does mean though that residents reliant on buses have seen their feasible commutable distance shrink (see Box 9) while rail commuters have seen the number of jobs they can access grow.
Besides London, seven cities — Manchester, Birmingham, Bristol, Leeds, Edinburgh, Glasgow and Cardiff — have city centres with jobs density above 200 and public transport accessibility of 0.3 or below. Manchester, Leeds and Birmingham in particular stand out for their slow public transport.
The more reliable and faster parts of the public transport networks into the city centre at peak times, such as rail, tram and busways, are at capacity, while buses exposed to road congestion have spare capacity largely due to unreliability and unjustifiable commuting times (see Figure 6). The future jobs growth in these city centres is most at risk of being constrained by their inadequate transport infrastructure.
Box 8: How Brighton has supported city-centre growth by better use of the road network
Brighton has managed to push the limits of jobs density in its city centre (207 jobs per hectare – up 31 per cent between 1998 and 2015) while maintaining public transport accessibility (0.35). A key element of this has been ensuring that local bus services are not caught up in growing traffic. Buses are segregated from cars and prioritised using bus priority junctions, bus lanes and bus gates. The city also suppresses demand from car users through high parking charges in the city centre – the city raises more than Manchester and Birmingham councils combined from parking. This raises funds to invest in schemes that improve the bus offer to residents still using the car, such as park and ride.
By making the road network less efficient for cars, Brighton has increased its efficiency at carrying passengers. This has allowed the city centre to continue growing without significant new rail services or tram infrastructure.
Box 9: Repairing links to city-centre opportunities through bus priority measures
Birmingham city centre attracted 30 per cent more jobs between 1998 and 2015. The demand to access these jobs has reduced the efficiency of the road network and slowed down buses. Work by the Open Data Institute Leeds and Transport for the West Midlands found that over 10 years, bus speeds have fallen by 10 per cent and pushed 216,000 residents beyond a 45-minute bus commute of the city centre.11 Increasingly, commuters are travelling by train.12 Residents of parts of the city reliant on buses for public transport face longer and less-reliable peak journey times by bus, putting city-centre jobs out of reach for some. In response, Transport for the West Midlands is introducing plans to speed up bus journeys and increase reliability using funding from the recently-announced National Bus Strategy.13
A lack of spare capacity supports the case for further major infrastructure investment
As well as speed, capacity is also an issue that should be considered when looking at the performance of the transport network and requirements for investment. A system with a lot of spare capacity is unlikely to need large infrastructure investment. While data on usage is patchy, estimates are available for the primary centres of England’s combined authorities (see Figure 6).14
This more limited dataset suggests that the denser the city centre, the less spare road and train capacity there is. In the West Midlands, for instance, 83 per cent of road capacity, and 63 per cent of national rail capacity in the city centre is being used at peak time – one of the highest of any of the areas measured.
But the averages presented in this overall city score do not capture particular lines and routes into city centres that are at capacity. In Greater Manchester, for instance, the Metrolink line from Altrincham into Manchester city centre is full at peak times and has been since soon after opening, leaving some commuters unable to board services, while elsewhere on the network, peak-time trams from Rochdale are not full.15
Bus capacity stands out for its lower capacity utilisation. In several of these cities, the share of bus capacity used into the city centre is much lower than for national rail and road. In the West Midlands, less than half (46 per cent) of the bus capacity is used and in West Yorkshire only 63 per cent is used despite more than 80 per cent of road and rail capacity being taken up.
This raises the question as to why capacity utilisation is not higher given the nature of its accessibility score and the density of its city centre. Work by the Open Data Institute Leeds for the West Midlands Combined Authority shows that it is the inefficiency of the system – especially the irregularity of and delays to services at peak times – that makes the bus an unattractive option.11 Given this, policy should look at what investments, such as bus lanes, can improve the efficiency of existing services.
Figure 6: Combined authority primary-city centre jobs density and transport-capacity utilisation
![]()
Figure 10: NIC urban transport capacity data
The capacity of different transport modes in each city given in Figure 6 is taken from the Urban Transport Capacity Metric, prepared by Steer for the NIC. It represents the capacity utilisation for each mode entering a city centre cordon area in the AM peak, over a one-hour period. It has been calculated by establishing the total capacity on each mode entering the area and estimating total demand into that same area.17
‘Build it and they will come’ cannot be justification for major transport infrastructure investment
A counter-argument sometimes put forward is that investing in better public transport now will spur the growth of a city-centre economy, rather than the other way round. But the relatively free-flowing nature of the transport network into many city centres suggests that this is not a constraint on growth, and further investment will make little fundamental difference. ‘Build it and they will come’ is unlikely to be a successful strategy.
This also applies to the type of transport that infrastructure investment is used to support. While the political allure of a large new tram or underground system is clear, it may not be the most appropriate intervention. Cities should consider the mix of modes and their performance carefully when planning new infrastructure investments. Box 11 considers the case of investment in tram lines in Manchester and Sheffield.
Box 11: Build it and they still might not come
Transport infrastructure investment in Sheffield and Greater Manchester illustrates the importance of building new high-capacity transport in line with demand and as part of a wider city-centre strategy. Both cities have an extensive tram network, but the share of commuters using public transport to access the city centre looks very different (see Figure 6). That is because of the different performance of their city centres.
Opened in 1992, Greater Manchester’s Metrolink tram first connected the city’s prosperous southern suburbs and Bury through the city centre. These added capacity and higher-frequency services to an existing heavy rail line. The improvement is one part of Greater Manchester’s wider efforts to support the city centre — the fastest growing for jobs and population in recent years18 — as a place for business, housing, education and leisure.
The higher-than-expected ridership on this route19 has also provided an operational surplus to help the city fund maintenance and expansions to Oldham, Rochdale and to Trafford Park.
Launched two years later, Sheffield’s Supertram linked a weaker city centre with Meadowhall, an out-of-town shopping centre, and industrial zones along the Don Valley to less affluent suburbs. The city centre has struggled in recent years, with the number of jobs actually falling between 1998 and 2015.20 Disappointing Supertram ridership meant that local councils ended up paying the costs of construction, rather than the tram franchisee as had been hoped. It now has the highest proportion of concessionary journeys of any tram in the country, at 32.5 per cent.21 Initial plans by the local transport authority to expand the Supertram beyond Sheffield to other local authorities across South Yorkshire have been stopped, despite all local authorities helping to fund its construction through council tax contributions.22