
02Fast Growth Cities before the pandemic
The following five areas are looked at in detail:
- Labour markets, skills and education
- Businesses and growth
- High streets and city centres
- Housing and planning
- Transport
1. Labour markets, skills and education
Fast Growth Cities’ common strength is their robust labour markets
The main strength that the Fast Growth Cities share is their strong labour markets. This applies to both the quantity and quality of the jobs available as well as the ability of the cities within the group to attract workers from their surrounding areas.
In recent years, most FGCs have seen an increase in their employment rates. This was led by Oxford which had an 82.4 per cent employment rate (2018), an increase of 6.5 percentage points compared to the UK average of 3.8 percentage points between 2014 and 2018. Employment rates in Cambridge and Norwich also grew at a pace that was above the national average. Milton Keynes’ employment rate also increased and is above the national average. These overall positive developments over the last few years have meant that with an average employment rate of 78 per cent, the group has a higher share of people in work than the rest of the country, which had an employment rate of 75.5 per cent.
Figure 1: Nearly all Fast Growth Cities have more people in employment than the national average

Case study 1: Addressing a low employment rate with job creation through inward investments
Challenge: Peterborough has a comparatively low employment rate, which is lagging behind the national average. This is partly attributed to the limited job offer in the area.
Solution: The city started to focus on securing additional inward investment to create new jobs. The increased inward investment has been coupled with encouraging land development and creating investment sites attractive to foreign direct investment (FDI).
Peterborough’s inward investment company Opportunity Peterborough, which is wholly owned by the Council, coupled its inward investment services with encouraging place-based growth as well as working with private sector developers in creating Gateway Peterborough, a distribution and manufacturing park. This led to significant ‘landing’ sites for foreign investors. So far, it has attracted FDI from countries like Spain, the US and Germany. The attracted businesses are expected to have created more than 1,000 jobs.
After a business has ‘landed’, Opportunity Peterborough provides support in terms of identifying the skills of the workforce, helping to engage with local communities and local supply chains as well as acting as a broker for knowledge and technology development partnerships.
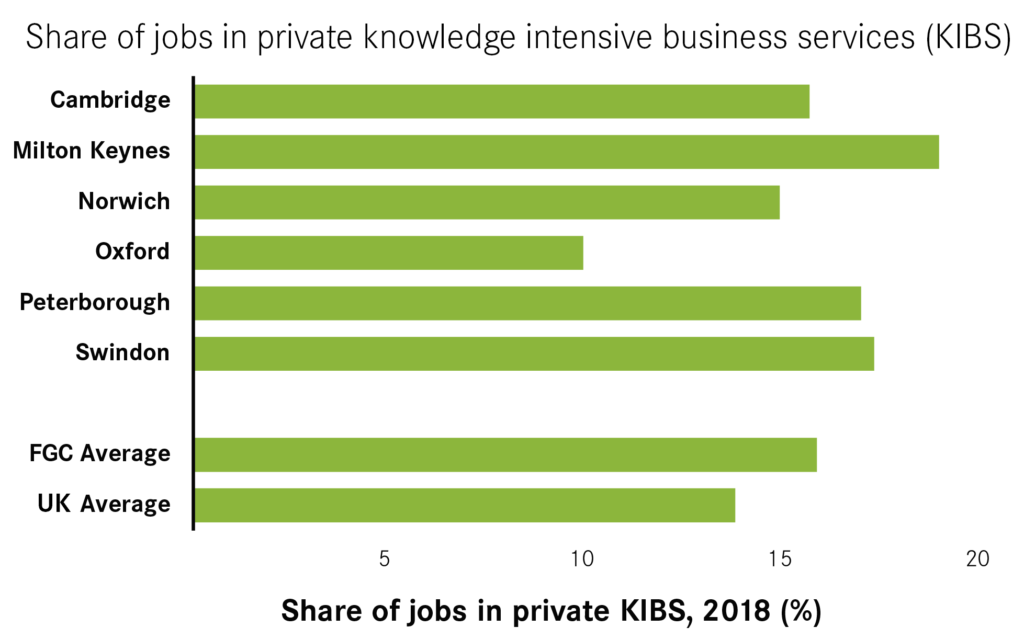
But it is not only the sheer number of jobs which characterises the strength of the FGCs’ labour markets. It is also the types and quality of jobs they provide. FGCs have high shares of jobs in private KIBS – these are high-quality jobs with high salaries and job security that tend to be very productive. These are often in growing industries such as software engineering or research and experimental development. Swindon, Milton Keynes and Peterborough are all among the
top 10 UK cities for share of private KIBS jobs, having at least 16 per cent of their workforce in these industries compared to the national average of 14 per cent. The share of jobs in KIBS for Oxford, 9.9 per cent, is significantly below the national average, although this is offset to some extent by its large higher education sector.3
Figure 2: The share of people employed in high-quality sectors in the Fast Growth Cities is above average
The FGCs provide jobs not only to their own residents but also to their surrounding areas. The share of their workers living outside of the boundaries of the city is on average 40.2 per cent across the group (Figure 3). That is above the national city average of 26.1 per cent and illustrates the role that the FGCs play as employment hubs for their region. This is particularly true in Cambridge and Oxford. At least one in two workers in these cities commutes from outside, compared to the UK city average of around one in four. Swindon has the lowest share of workers coming from outside but is still in line with the urban average.4
Figure 3: Fast Growth Cities are employment hubs for their surrounding regions

When it comes to skills, there is a larger variation across the Fast Growth Cities
Growth in employment and the composition of jobs by industry paints a picture of the static strength of the labour market but these indicators do not describe the flexibility and resilience of the labour market to shocks such as the pandemic.
The skills levels of the labour force are an important factor in determining the long-term success of a city. High shares of skilled people make a place more attractive for productive businesses and can influence their investment decisions. These high-skilled businesses can pay higher wages which boost the wider prosperity of the local economy through spill-overs. Higher-wage jobs generate higher demand for, and employment in, local services such as restaurants and retail but also in public services such as schools and nurseries.
The previous Centre for Cities report from 2016 identified skills shortages and the share of residents with low skills levels as a key barrier that needed to be overcome. The most recent analysis shows that the majority of cities made progress in this regard.
Looking at the share of the population with NVQ4+ qualifications, which is equivalent to a degree-level qualification, Cambridge and Oxford perform extremely well with more than 61 per cent of their populations having degree-level qualifications in 2018. Milton Keynes and Norwich started from a lower base but made strong progress between 2014 and 2018 with the share of the population in this group increasing faster than the national average. Peterborough and Swindon still have levels of high-skilled population which are below the national average.
Although high-level skills are important for a city, basic skills are also crucial to improve the quality of the workforce because low skills prevent those that live in the cities from benefiting from the jobs growth that the cities have experienced.
The FGCs perform well on this measure, with four out of the six having shares of their populations with no qualifications that were lower than the national average in 2018. Not only this, but the decrease in this measure is the same as or larger than the national average between 2014 and 2018 for all FGCs apart from Swindon.
Case study 2: Coping with a lack of degree-level workers
Challenge: One of Swindon’s biggest challenges is its low share of residents with degree-level education, which is below the Great Britain average. The city identified particular challenges within the sectors of construction, digital and advanced manufacturing sector and science, technology, engineering and mathematics (STEM) sectors more generally.
Solution: To improve the skill levels of its population, Swindon is about to establish an Institute of Technology, due to open in September 2021, which aims to provide programmes to support young people into better careers. The institute’s aim is to become a centre of excellence for higher- level technical skills, with employers playing a key role in its leadership, curriculum design and delivery. There is a target of 1,800 students by its fifth year, to include 50 per cent of the learner cohort as apprenticeships, in addition to full- and part-time study programmes. This partnership between local education providers and employers will provide higher education provision from Level 4 to Level 6 in advanced manufacturing, engineering, digital technologies, and life sciences, meeting the demand of businesses for higher-level STEM skills to drive future innovation and productivity.
Figure 4: Skill levels vary across the Fast Growth Cities

All Fast Growth Cities recognise the importance of higher education as a driver for economic growth
The ambition to use higher education to spur the growth of their economies is a key attribute that unites the Fast Growth Cities. Universities in Cambridge, Oxford and Norwich all contribute to the strong higher education sector in the UK. Each of these cities has large numbers of students and university personnel who contribute to the economy by living in the city, consuming local services as well as potentially working in the labour market in these places after completing their studies (Figure 5). At the same time, these cities contribute to the wider prosperity of the UK by upskilling students to work in higher-skilled sectors across the country (and outside of the UK).
Milton Keynes, Peterborough and Swindon have plans to soon open their own campus-based higher education facilities. Milton Keynes will open a university to address urgent technological and skills gaps and Anglia Ruskin University is partnering with Peterborough and the Cambridgeshire and Peterborough Combined Authority to establish a new employment-focused university, due to open in September 2022. Swindon’s Institute of Technology is due to open in September 2021 with the aim to become a centre of excellence for higher-level technical skills.
Figure 5: Cambridge, Norwich and Oxford make strong contributions to the higher education sector in Great Britain

Summary
FGCs have seen strong employment growth in recent years and were able to establish robust labour markets with high-performing jobs. The focus on higher education and research in the FGCs is reflected in the rise and development of higher education institutes. But to maintain further growth, for some cities it will be vital to further work on skills shortages or increase the basic skills of their workforce.
2. Business and growth
Fast Growth Cities have strong industrial profiles with different strengths and weaknesses
One way to assess the health of a city’s economy is to look at the types of businesses that it can attract. A healthy city has lots of businesses that are exporting and highly skilled, and these types of businesses are important for a number of reasons. They tend to be more productive and so are the drivers of increased productivity in a place. They generate income that is independent of the local economy because they export their products and services to places beyond their city borders. And most importantly they have a multiplier effect on jobs in local services – the better they perform, the higher the local disposable income in the economy and so the higher the demand for services from local businesses such as shops and restaurants.
On average, the FGCs perform well by this measure, with a higher share of people employed in high-skilled exporting industries than the national average. In Cambridge, Milton Keynes and Swindon, the share of people employed in high-skilled exporting industries far exceeds the national average. Oxford, Peterborough and Norwich in contrast have lower shares of jobs in exporting businesses, which is likely to act as a drag on future economic growth in these cities. The size of the education sector in Oxford goes some way to accounting for the smaller high-skilled exporting base. The ability to attract international students into Oxford and Cambridge can be thought of as a type of exporting industry, as the attraction of international students contributes to the wider economic success of the country.
Figure 6: Most Fast Growth Cities have higher than average shares of people employed in more productive industries

The industrial structure is also reflected in the productivity of the FGCs. In 2018, they collectively accounted for 2.6 per cent of the national GDP despite being home to just 2 per cent of national jobs. When looking at the GVA per hour for single cities in Figure 7, it is clear that the strong productivity is mainly driven by Swindon and Milton Keynes, which have higher than average productivity due to their large shares of high-skilled exporting workers. Despite Norwich and Peterborough having made strong improvements towards catching up, they are still lagging behind the national average. Productivity in Cambridge and Oxford seems to have stagnated in recent years, and easing the constraints that have caused this indicator to see little improvement should be the key aim of local and national government.
Figure 7: Milton Keynes and Swindon drive productivity growth within the Fast Growth Cities

The Fast Growth Cities have different innovation systems – building on their different strengths will be crucial for achieving future growth
While the industrial composition tells us about the current strength of a place, it does not say much about the potential of a place to reinvent itself or about the resources available to adapt to change.
This can be measured by looking at the innovative capacity of a place which shows its ability to absorb shocks and to absorb and develop new innovations. This is a combination of business dynamics, skilled labour and innovative output such as patents. Innovative places are likely to be the first places to benefit from the ongoing change in the economy – either because they are directly involved in the development of solutions (such as Cambridge’s life sciences cluster and Oxford’s lead in the development of a Covid vaccine as well as the development of ‘track and trace’ apps) or have the right dynamics to quickly adapt their business models.
Box 1: Measuring innovative capacity
Innovative capacity is the ability “to produce and commercialise a flow of innovative technology over the long term”.5 This means that innovative capacity is less about single innovative players and more about a network and a critical mass of innovators. To capture the innovative capacity of different places across Great Britain, Centre for Cities has analysed a set of indicators for each place.6 These included skills and knowledge indicators (i.e. highly skilled workforce), physical infrastructure (i.e. accessibility or office space), business innovation (i.e. innovative firms), university innovation (i.e. spin-offs from universities) and innovative output such as patents or trademarks. Altogether, they describe the innovative capacity of a place.
Centre for Cities has previously assessed the innovative capacity of 62 cities and large towns across Great Britain based on a selection of different indicators (see Box 1). Among the FGCs are some of the most innovative cities in the UK: Cambridge and Oxford have mature innovation systems in place with different strengths and the capacity to benefit the entire UK. Cambridge has the highest level of patent applications among UK cities followed by Oxford in the third place. Milton Keynes has one of the highest start-up rates of UK cities. Peterborough and Milton Keynes have a particular strength in business innovation.
Although they are home to successful and innovative flagship institutions, such as UK Research and Innovation in Swindon and the university in Norwich, both cities have lower innovative capacity, as shown in Figure 8. This may stem from, for example, a lack of business dynamics and innovation suggested by low start- up numbers.7
Table 8: There is a strong variation in innovation systems across the Fast Growth Cities
Different innovation systems across FGCs
| Patent strength | Trademarks strength | University innovation strength | Business innovation strength | Innovation city type | |
| Cambridge | VERY STRONG | VERY WEAK | VERY STRONG | VERY STRONG | super city |
| Milton Keynes | WEAK | VERY STRONG | VERY WEAK | STRONG | commercialiser |
| Norwich | WEAK | VERY WEAK | STRONG | VERY WEAK | disjointed innovation system |
| Oxford | VERY STRONG | VERY STRONG | VERY STRONG | STRONG | super city |
| Peterborough | STRONG | STRONG | VERY WEAK | STRONG | business-led |
| Swindon | VERY WEAK | VERY WEAK | VERY WEAK | WEAK | disjointed innovation system |
Case study 3: Completing the local innovation system
Challenge: Milton Keynes scores strongly when it comes to different innovation metrics but the city felt that its full potential has been limited by the lack of undergraduates. Milton Keynes is now the largest urban area in the UK without a university, something the council and its partners are working hard to address.
Solution: To address the lack of undergraduates, Milton Keynes Council and Cranfield University partnered in establishing the Milton Keynes University (MK:U). The project is focused on stimulating growth within the Oxford-Cambridge Arc, and challenging traditional delivery models of higher education institutions. It is planned that MK:U will work in partnership with businesses to produce a long stream of STEM and digital graduates equipped with the technical, entrepreneurial and commercial skills required to drive the future local economy.
MK:U is supported by a range of international businesses who will co-design and co-deliver the curriculum and ensure that employer needs are incorporated from the beginning. The curriculum will focus both on the city’s existing strengths, for example in ‘smart city’ innovation, and on delivering much needed skills such as cyber security. MK:U is intended to become a core anchor institution for the city, addressing a key issue within the MK economy and strengthening the skills pipeline. Funding has been secured to establish an early MK:U presence in the city centre. This will see four degree apprenticeship courses launched in 2021 and the opening of an innovation hub and living lab in 2022, focusing on smart city technology companies.
Case study 4: Generating spillovers from the university to the business sector
Challenge: The city of Norwich performs strongly when it comes to university innovation but lags behind when it comes to business innovation. The lack of innovation in the private sector is shown by the low number of innovation outputs such as patents and trademarks.
Solution: One way to foster more innovation in the private sector is to create spillover effects between the universities and local businesses. Norwich has two universities, the University of East Anglia and Norwich University of the Arts. Both institutions were integral to the development of the economic strategy and local industrial strategy with recognition of the need to integrate spin-out programmes with the finance and support offers of other key stakeholders. To date, significant investment has been made and the offer continues to evolve for research consultancy, internship and business start-up/incubation in partnership with the city, local enterprise partnership (LEP), local businesses and technology networks such as SyncNorwich, Hot Source and Norfolk Developers.
Refinement of this offer in close collaboration with local partners includes the development of local accelerator coaching programmes and stronger integration with a comprehensive package of funding options from both private equity and LEP innovation capital seed funding. So far, this has led to spin-offs located in the local area and are considered to have high growth potential such as Syrinix, which is developing intelligent pipeline monitoring solutions, or Rainbird, which provides automated decision- making platforms powered by artificial intelligence.
Summary
The FGCs have strong economies with large shares of employment in highly productive companies. Together, they have a disproportionately large contribution to GDP. But there is a difference between the cities when it comes to their industrial profile and innovative capacity. Further efforts should focus on attracting high-skilled exporting businesses as they are associated with higher levels of productivity. In Swindon and Norwich, further efforts should also focus on increasing the innovative capacity in these places by taking into account possible spillover effects of the existing flagship institutions there.
3. High streets and city centres
Discussion on the high street tends to focus on retail and its current struggles. But city centres do not only consist of local services such as shops, cafés and restaurants. In strong city centres, the majority of commercial space is made up of offices. This is the case because of the benefits that city centres offer to businesses. This includes access to lots of workers, access to shared infrastructure (such as public transport or supply chains) and access to knowledge through the ability to share tacit information face to face, particularly in very dense city centres. City centres with a strong offering of office space as well as food, drink and leisure amenities attract high-skilled workers to an area which in turn provides higher footfall and spending on the high street.
The majority of Fast Growth Cities have high shares of retail space in their city centres
Looking only at the footprint of commercial properties in the city centre, the city centres of most FGCs do not have the attributes of other strong city centre economies in Britain. Milton Keynes stands out as an exception with high shares of office space in its core, while Cambridge, Norwich and Peterborough have very low shares. Cambridge is an exception as, due to its urban structure, much of the economic activity lies outside of its city centre, with much of this focused in the CB1 development located near the railway station and in a set of science and business parks on the city fringes.
Figure 9: The majority of Fast Growth Cities have high shares of retail space in their city centres

Cambridge, Norwich and Oxford usually see high levels of visits from tourists
Oxford, Cambridge and Norwich are special cases in this context. Their historic centres and attractiveness as tourist destinations skew how their city centres are used. New, non-retail commercial space is difficult to develop within the centre. The popularity of the three as visitor destinations is reflected in the fact that on the weekend, more than 80 per cent of all visitors to the city centre in both Cambridge and Oxford come from outside of the city.8
This is also evident when looking at the number of visitors to each city: proportional to their populations, Cambridge, Oxford and Norwich all see higher than average influxes of visitors from outside the city coming for holiday trips (Figure 10). Nearly all of the FGCs also see higher than average shares of people coming for business trips, which is in line with their stronger economies. Milton Keynes, Cambridge and Oxford score particularly highly by this measure which shows their attractiveness as hubs for business both within their local area and more widely, while Peterborough and Swindon, in contrast, have low numbers of visitors for both business and holiday visits.
Figure 10: Many Fast Growth Cities are attractive places for holiday and business trips

Summary
The city centres of most of the FGCs are more reliant on retail than cities with strong city centre economies. The demand for retail and other local services in Norwich, Oxford and Cambridge is also driven by people coming from outside the city as they are important tourist destinations. Milton Keynes is an exception as it is mainly a business-destination which is reflected in the high share of city centre office space and the high share of people visiting for business. For cities with high shares of retail in their city centres, further investment should focus on turning these places into more attractive places to do business. Where city centre space is unavailable, investment should focus on the districts where economic activity is already clustered such as Oxford’s West End Global Innovation District and Cambridge’s CB1 development, the new North East Cambridge district and other business and research parks.
4. Housing and planning
One consequence of a place generating more and better paid jobs is more people moving to the city to access them. The FGCs’ economic and population growth has increased the strain on the local housing markets. Housing availability and affordability is a key limiting factor for more people who would like to move into or stay in an area for work. If an area is too expensive relative to the wages available, residents will be pushed out, which is likely to have a particular effect on reducing the pool of young and less skilled people. These people are often employed in sectors which are crucial for a city to run effectively such as many of the key workers highlighted by the pandemic.
Most Fast Growth Cities have built a lot — but there is room for more
In the first Centre for Cities report on the Fast Growth Cities group, the high demand for housing and increasing unaffordability were highlighted as key constraints to allow further growth. In 2018, housing affordability was on average roughly similar to or cheaper than the national average in four of the six Fast Growth Cities with Oxford and Cambridge being strong outliers with extremely high levels of unaffordability (Figure 11). But the majority of Fast Growth Cities saw a stronger increase in the housing affordability ratio between 2004 and 2018 than the national average which indicates a high demand for housing in these places.
Figure 11: The high demand for housing in many Fast Growth Cities has led to high house prices

Supplying more homes in high-demand cities is essential to mitigate the negative effects of the housing shortage. By this measure, the FGCs perform well with an average increase in the housing stock of 10.6 per cent. Four of the six cities have increased their housing stock at a pace far exceeding the national average (Figure 12). This includes Cambridge, the third least affordable city in the UK which increased its housing stock in the decade up to 2018 by 15.7 per cent, more than double the average increase in England and the highest increase nationally. Milton Keynes follows closely behind, with growth in housing stock of 14.5 per cent. In contrast, Oxford saw an increase of only 4.5 per cent, despite its ongoing issues with affordability, although it has made some positive strides (see Case Study 5).
To deal with the ongoing affordability problems, the FGCs and neighbouring places in their travel-to-work areas should continue to increase the number and types of homes available. The types of housing will also be important within this – it will be key to ensure that there are a range of new homes of mixed tenure types available. This should include expanding the amount of affordable housing in the cities. The cities are aware of this, through the Cambridgeshire and Peterborough devolution deal, as well as additional funding from the council, Cambridge will deliver a further 900 sustainable homes, 546 of which will be council-owned for rent in line with the local housing allowance.
In addition, Oxford City Council has housing investment plans including delivering 560 affordable homes by 2022 through funding from the Oxfordshire Housing and Growth Deal and investment from the council. While, ultimately, more houses overall will be needed to help rebalance prices with incomes, this is not sufficient to solve the issues the cities face and so an increase in affordable houses will be needed to help people of all incomes to access the economic opportunities that the FGCs provide.
Figure 12: Most Fast Growth Cities made strong efforts to deliver more housing

Case study 5: Reducing unaffordability and increasing the stock of houses
Challenge: Oxford stands out as having both high levels of unaffordability as well as low housing stock growth. This is driven in part by the limited land available for development as a result of constraints including the green belt, historic conservation areas as well as environmental constraints on the city.
Solution: To create more housing, particularly affordable homes, Oxford has taken a multi-faceted approach. The council set up a housing company in 2016 to build on existing council-owned land, seek out partners and to acquire further land for development. The company has plans to develop over 2,000 homes over the next 10 years, and the council plans to buy 1,000 of these homes from the company with nearly 800 of these being for social rent.
The city also worked with other Oxfordshire authorities to secure the Oxfordshire Housing and Growth Deal in 2017 providing £60m to deliver over 1,300 affordable homes and £150m for infrastructure to help accelerate the delivery of some of the 100,000 homes planned across the county. Nearly 30,000 of these homes are to meet Oxford’s housing needs.
This year, Oxford adopted a new local plan allowing for a further 11,000 homes to be built within the city limits, which requires balancing the demands for student housing as well as targeting the provision of affordable homes for certain employers including key hospital workers. Even with these solutions in place, the number of houses in the city remains short of needs and so the council worked with neighbouring councils to ensure needs were met in locations that had a strong relationship to Oxford. Land has now been allocated to meet the remaining need in neighbouring authorities including around 7,000 homes in urban extensions to the city.
Box 2: How energy efficient is the domestic building stock in the FGCs?
Energy performance certificates (EPCs) show how energy efficient a building is on a scale from A to G. While the rating A means that a house is running at very low cost and is very energy efficient, G means the opposite
– that the house is not energy efficient and has higher running costs. This has implications for the environmental footprint of a property. A move towards net-zero would require large shares of properties to be in the upper ratings of energy efficiency.
Overall, FGCs have higher shares of buildings in the categories A to C than the average domestic building stock in England and Wales (see Figure 13). Peterborough and Milton Keynes both have more than 50 per cent of their buildings classified as A, B or C which represents very high energy efficiency. In addition, the FGCs have lower shares of housing stock in the least energy efficient category than average.
Figure 13: Fast Growth Cities have a higher stock of energy-efficient houses than the average level for England and Wales
Energy efficiency of domestic buildings

Source: MHCL, Energy Performance of Buildings Certificates 2018
Summary
If the affordability ratio continues to develop at a similar pace as in the past, most FGCs will face problems in meeting the needs of both their economies and their populations. As they attract a greater pool of workers, those with lower incomes will face particular challenges in affording to live in these places. The increase in housing stock in recent years shows a commitment for growth by the majority of the group to meet the demand for affordable housing. It is important to continue with this commitment in the future. For the most unaffordable, Cambridge and Oxford, although increasing the supply of houses will help reduce unaffordability, it is likely to be insufficient to fully address the root problem, given the extremely high house prices in these places. In these cities and other places in the group, there will continue to be a role for the FGCs to play in providing social and affordable housing to give immediate relief to low-income families, alongside market-rate housing.
5. Transport
In 2016, the increased pressure on transport and infrastructure was identified as a key barrier to continued growth and it remains a central topic for most FGCs. Transport both within and between places is important for several reasons, including connecting workplaces with homes. The strength of the transport system determines the size of the labour force that can work in a city as well as being a determinant in how attractive a place is to live. As outlined above, FGCs are employment hubs attracting more workers from outside their boundaries than other cities in the UK, making transportation a particularly important condition for their success.
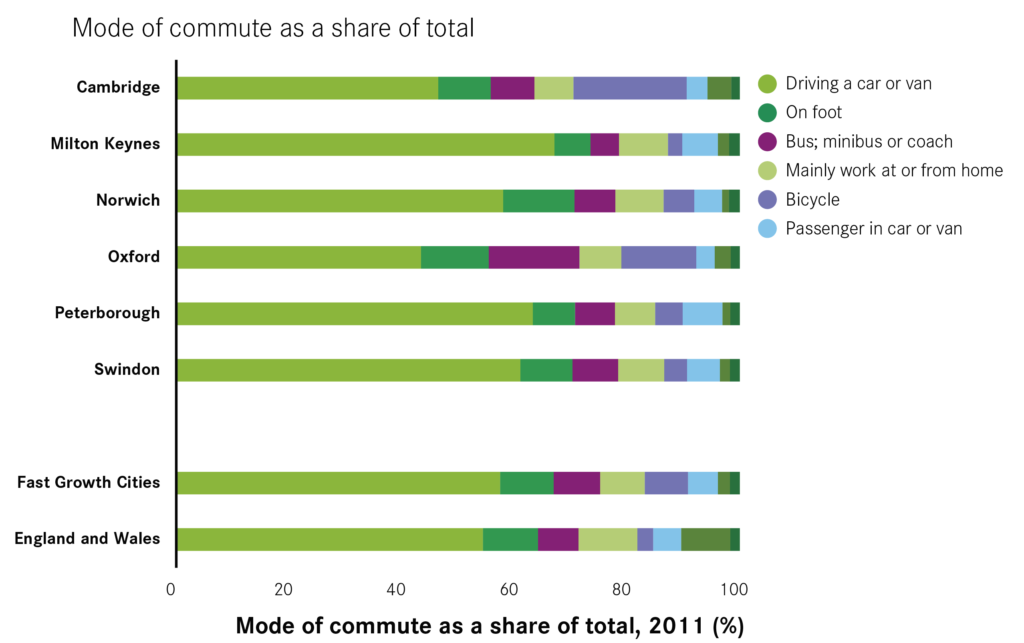
In general, for all the FGCs, the car is the most common mode of transport – with higher than average shares of commutes taken by this mode in all cities other than Oxford and Cambridge, where car use is high but below average due to the higher rates of cycle commuting.
This can be explained by the relative ease of using the car over other forms of transport, measured by how quickly different modes of transport can access the city centre (Figure 15). Public transport accessibility is broadly in line with or above the urban average across the FGCs.9 The largest gaps between accessibility by public transport and car are in Milton Keynes where the public transport system is not developed and accessibility by car is very high meaning that a switch towards public transport may be challenging.
Figure 14: For all Fast Growth Cities, the car is the most common mode of transport
As the pandemic continues, high accessibility by car will likely be an advantage as people switch away from public transport to access city centre jobs and leisure more easily. But if this continues in the long run, it is likely to lead to issues such as elevated levels of air pollution and increased congestion as well as placing a greater strain on city centre parking. Looking further ahead, enhancing alternative modes of transport in the FGCs will be important given the speed and scale of their growth. In recognition of this, major schemes such as the mass rapid transit system in Milton Keynes, redevelopment of Oxford station and reopening the Cowley branch line, and the Cambridge metro are important examples of the cities’ commitment to future growth.
Case study 6: Greater Cambridge transport strategy
Challenge: A challenge for all cities is how to secure sustainable long- term growth, tackle significant transport congestion and ensure ease of movement between key economic hubs. Cambridge also faces a particular spatial challenge. With key employment sites growing mainly to the south, and key residential sites to the north and west of the city, the challenge is how to address this and retain the connectivity that has been a critical factor for Cambridge’s success.
Solution: The Greater Cambridge Partnership (incorporating the three local authorities in the area, plus the academic and business communities) has a strategy and funding to efficiently and sustainably connect key employment and residential sites in the area, easing congestion, improving air quality and reducing carbon emissions. A City Deal agreed with Government in 2014 is providing up to £500m alongside local match funding.
Over the coming decade, the partnership’s transport strategy seeks to deliver dedicated, rapid, high-quality public transport routes on four key arterial corridors into Cambridge (intended as a first phase to the Mayor of Cambridgeshire and Peterborough’s Cambridgeshire autonomous metro), complemented by a wider step-change in public transport services, an enhanced cycle network and a range of smaller interventions.
In the wider area, the partnership’s City Access project is developing a package of measures to improve public transport, create more active travel options and offer people better choices for their journeys in and around Cambridge city centre. The strategy is underpinned by a comprehensive and growing base of evidence and engagement, including the 2019 Greater Cambridge citizens’ assembly on transport and air quality.
The other alternative to public transport in light of the pandemic is active travel such as cycling or walking. These modes make up a higher share of commutes than average in all FGCs other than Milton Keynes. This is particularly true in Oxford and Cambridge where more than four times as many people commute by bike than the national average. This strength in offering active travel will provide a strong base on which the FGCs might build, including implementing the second tranche of the Emergency Active Travel Fund to effectively enhance the active travel offering in these places.10
Figure 15: Accessibility by car is higher than by public transport for all Fast Growth Cities
Summary
The FGCs currently rely predominantly on cars for commuting, which is in line with wider national trends. This dependence will likely rise as a result of the pandemic, which may cause challenges in the long term for congestion, pollution and city centre parking if left unchecked. This is a particular challenge for cities that previously saw large shares of their workforces coming from outside of the city boundaries such as Cambridge and Oxford. Looking ahead, it is therefore important that the group builds upon existing strengths by further investing in alternative modes of transport to allow the group to grow quickly in a way that is sustainable. The FGCs are also better placed than many others to take further advantage of any potential shift towards active travel.
Conclusion
The cities all perform well when it comes to population and employment growth. Their strong labour markets act as hubs for their local areas and wider regions. As a result, they significantly contribute as a group to both the national economy and the research base of the country. All the cities have made strong commitments to supporting further growth in the future but face different barriers to their continued success, which underlines the case for further investment, given the contribution these places make to the UK’s economy. While some can already see constraints on their growth, other members of the group will need more support to fully reach their potential. Their different strengths and weaknesses must be considered when thinking about ways to unlock further growth in these places.