
03The residents and workers of the Gatwick Diamond
As noted earlier, the availability of skilled workers is likely to be a big factor in attracting and retaining high-skilled businesses. This section looks at where the residents and workers of the Gatwick Diamond live and work, looking at the implications this has for skills and housing.
Workers and residents: two distinct populations
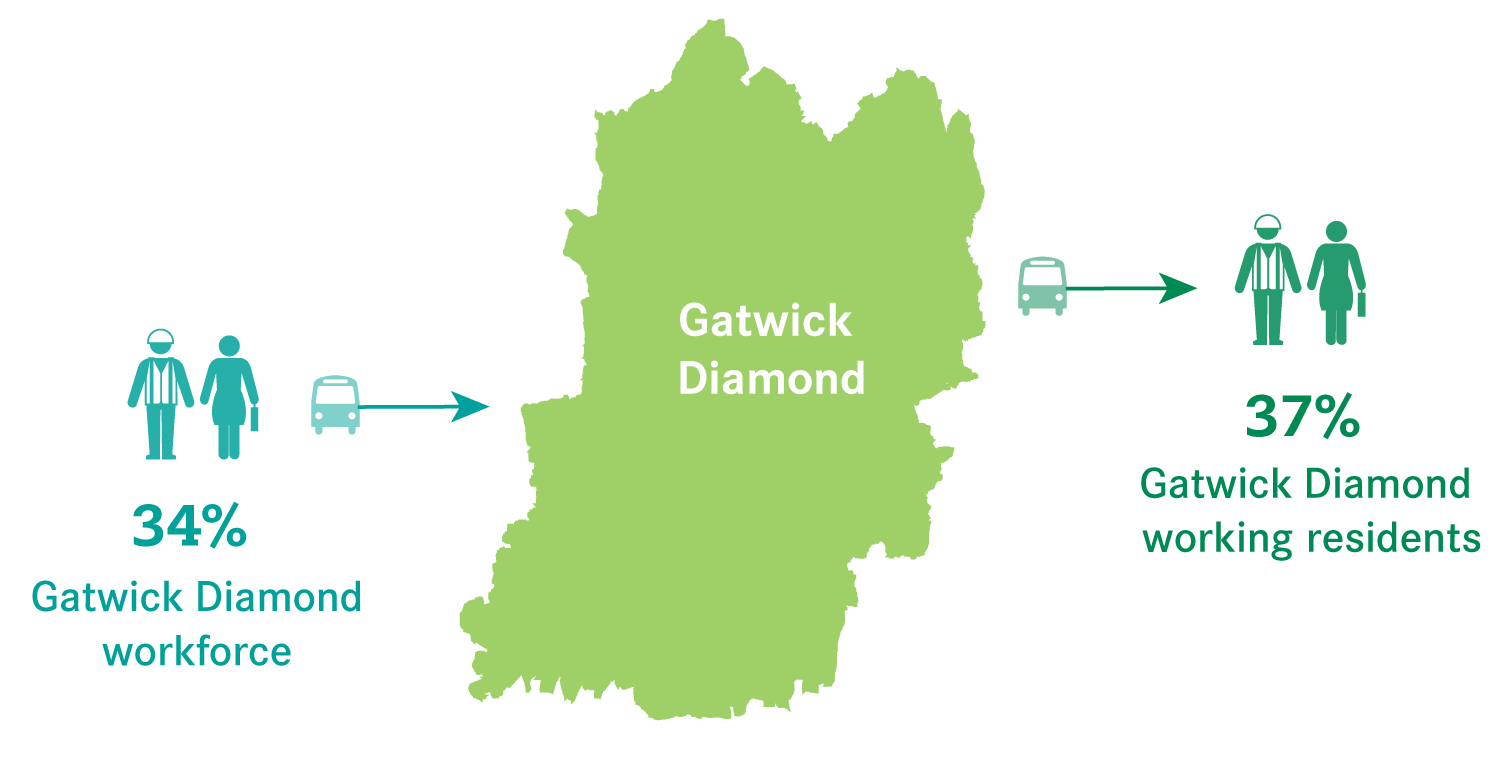
Because of its location between London and the coast, the Gatwick Diamond experiences large daily population flows – whether this is inflow of workers (coming to work in the Gatwick Diamond) or outflow of residents (leaving home in the Gatwick Diamond to work elsewhere). In 2011, about 100,400 workers commuted to the Gatwick Diamond, while some 112,900 Gatwick Diamond residents went to work outside of the area.14 This makes the Gatwick Diamond a point of daily crossover between different types of populations.
Figure 17: Flow of workers to and from the Gatwick Diamond
Commuting patterns for workers and residents
More than one in three workers come from outside the Gatwick Diamond. This makes the Gatwick Diamond the most reliant on an external workforce among all comparator areas. Enterprise M3 and the Thames Valley Berkshire experience similar levels of in-commuting, Greater Medway and the SEMLEP tend to be more self-contained, with 21 and 19 per cent of workers respectively living outside the respective areas.
As shown in Figure 18, the reach of the Gatwick Diamond is relatively limited. Those who commute in tend to live very close to the border, although it is interesting to note that a sizeable number of people commute from South London and Brighton, despite having access to a large number of local job opportunities. This is a positive for the area, likely reflecting the good job opportunities available within the Diamond.
Figure 18: Origin of Gatwick Diamond’s workers
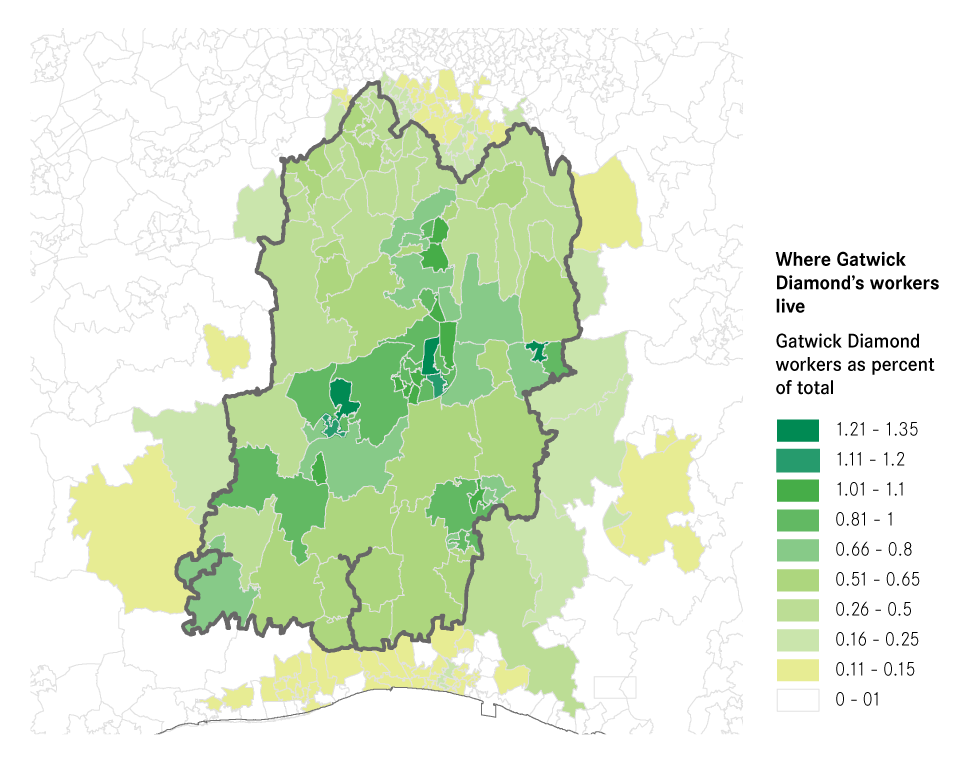
At the local authority level, the largest inflow of workers from outside the Gatwick Diamond came from Brighton and Hove (10,600 workers, or 3.6 per cent of the total workforce), followed by the London boroughs of Croydon (10,300 workers / 3.5 per cent) and Sutton (9,300 workers / 3.2 per cent). In total 37,400 London (GLA) residents came to the Gatwick Diamond to work, accounting for 37 per cent of external commuters and 13 per cent of the total Gatwick Diamond’s workforce.
The destination of those external commuters reflected the geography of jobs in the Gatwick Diamond, and underlines the importance of good transport links between these sites and areas outside of the Diamond. Manor Royal attracted the largest share of commuters (9 per cent of all Gatwick Diamond commuters), followed by the area covering the airport (7.4 per cent) and Leatherhead (7.2 per cent). The centre of Crawley had a much weaker pull, being the destination of 1.4 per cent of inward commuters.
On the other hand, workers that also lived in the Gatwick Diamond were not as mobile. Among the Gatwick Diamond workers who also lived in the Gatwick Diamond, two thirds lived and worked in the same local authority.
On the resident side, more than one in three Gatwick Diamond residents were working elsewhere. In 2011, 36.8 per cent of residents commuted to work outside of the Gatwick Diamond. As shown in Figure 19, this was the largest outflow of residents among all comparator areas. In Enterprise M3, 34.5 per cent of residents worked elsewhere, while it was much lower at 23.2 per cent in the SEMLEP.
Figure 19: Residents by place of work, 2011

The main workplace destination outside the Gatwick Diamond was by far London, with almost one in four of Gatwick Diamond’s working residents (23 per cent) working in the capital. In particular, Westminster was the local authority outside the Gatwick Diamond with the highest number of working Gatwick Diamond residents, accounting for 6.2 per cent of all working residents. Croydon and Sutton also had a high share of Gatwick Diamond residents in their workforce (2.3 per cent and 2.4 per cent). This predominance of commuting to London is clearly visible in Figure 20.
Figure 20: Destination of Gatwick Diamond residents outside the area
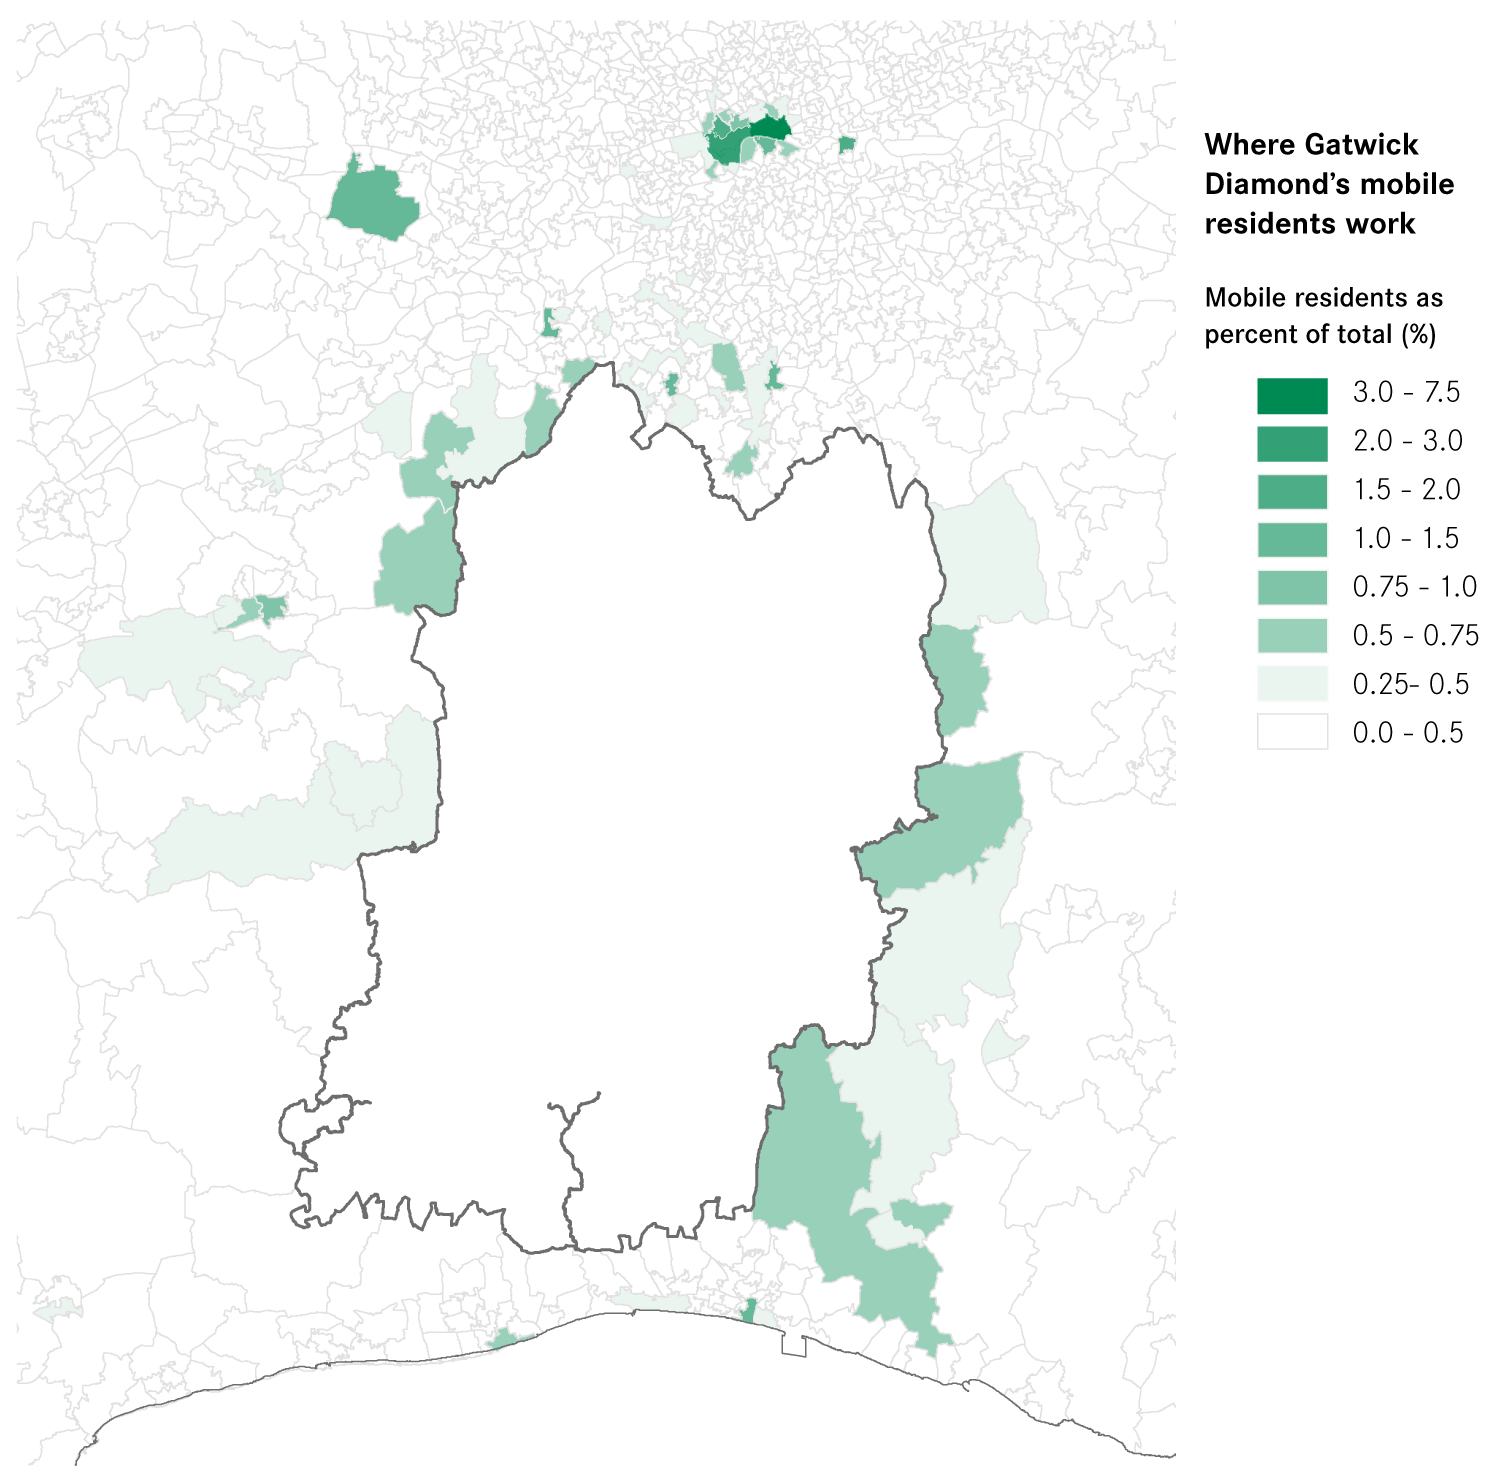
This meant that the pull of London on the Gatwick Diamond was much greater than for the other comparator areas. For instance only 15 per cent of the working residents of Greater Medway, and 12 per cent of the Thames Valley Berkshire LEP’s worked in London, despite these two areas also being close and well connected to the capital.
Occupations and pay of the Gatwick Diamond residents and workers
A large proportion of Gatwick Diamond’s residents occupy high-skilled positions.15 As shown in Figure 21, in 2015 they represented 52.2 per cent of all residents, above the British average of 44.5 per cent. This was slightly lower than the Thames Valley Berkshire and Enterprise M3, which respectively had 53.4 and 52.3 per cent of their population employed in high skilled jobs.
However the share of residents in low-skilled occupations was the lowest of all areas, with 16.7 per cent of residents occupying such positions.16 Comparatively low-skilled residents represented 18.8 per cent of Enterprise M3 population, and 19.9 per cent of Thames Valley Berkshire’s.
Figure 21: Residents by job occupation

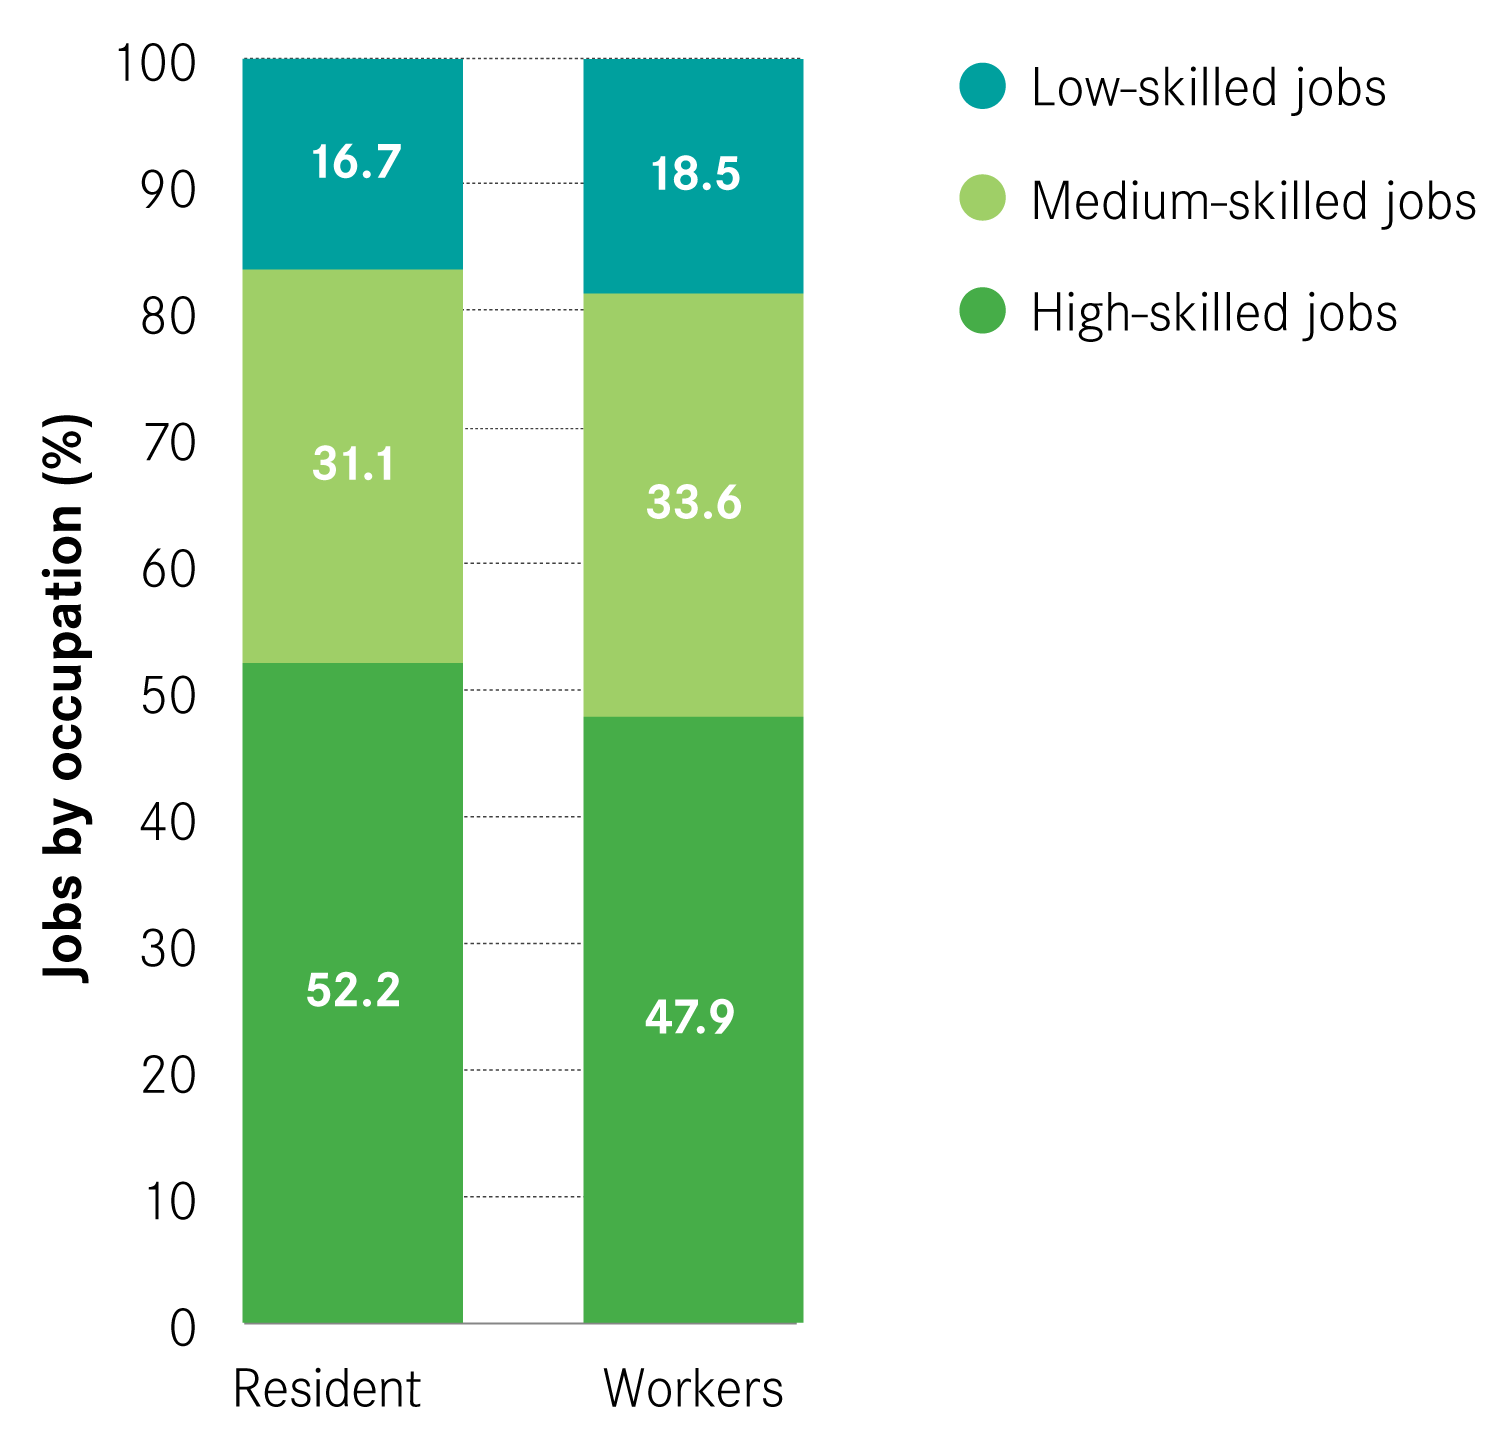
Overall, the share of high-skilled jobs occupied was higher among residents than workers (Figure 22). 47.9 per cent of workers were high-skilled, compared to 52.2 per cent of residents. Although it is not very large, this difference still reflects that more high-skilled residents must work outside the area than high-skilled non-residents commute into the Gatwick Diamond.
Figure 22: Jobs by occupation, residents and workers
This difference is also reflected in wages. Within the Gatwick Diamond, resident wages were on average 8 per cent higher than workers’ (£619 against £572). But as Figure 23 shows, this was common across the comparator areas, with high wages in London likely to be driving up resident wages in neighbouring places.
Figure 23: Residents and workers average weekly wages, 2016

These disparities have implications for housing
The relative cost of housing is likely to be a factor in the success of an area at attracting and retaining workers. The data shows that this is a key challenge for the Gatwick Diamond.
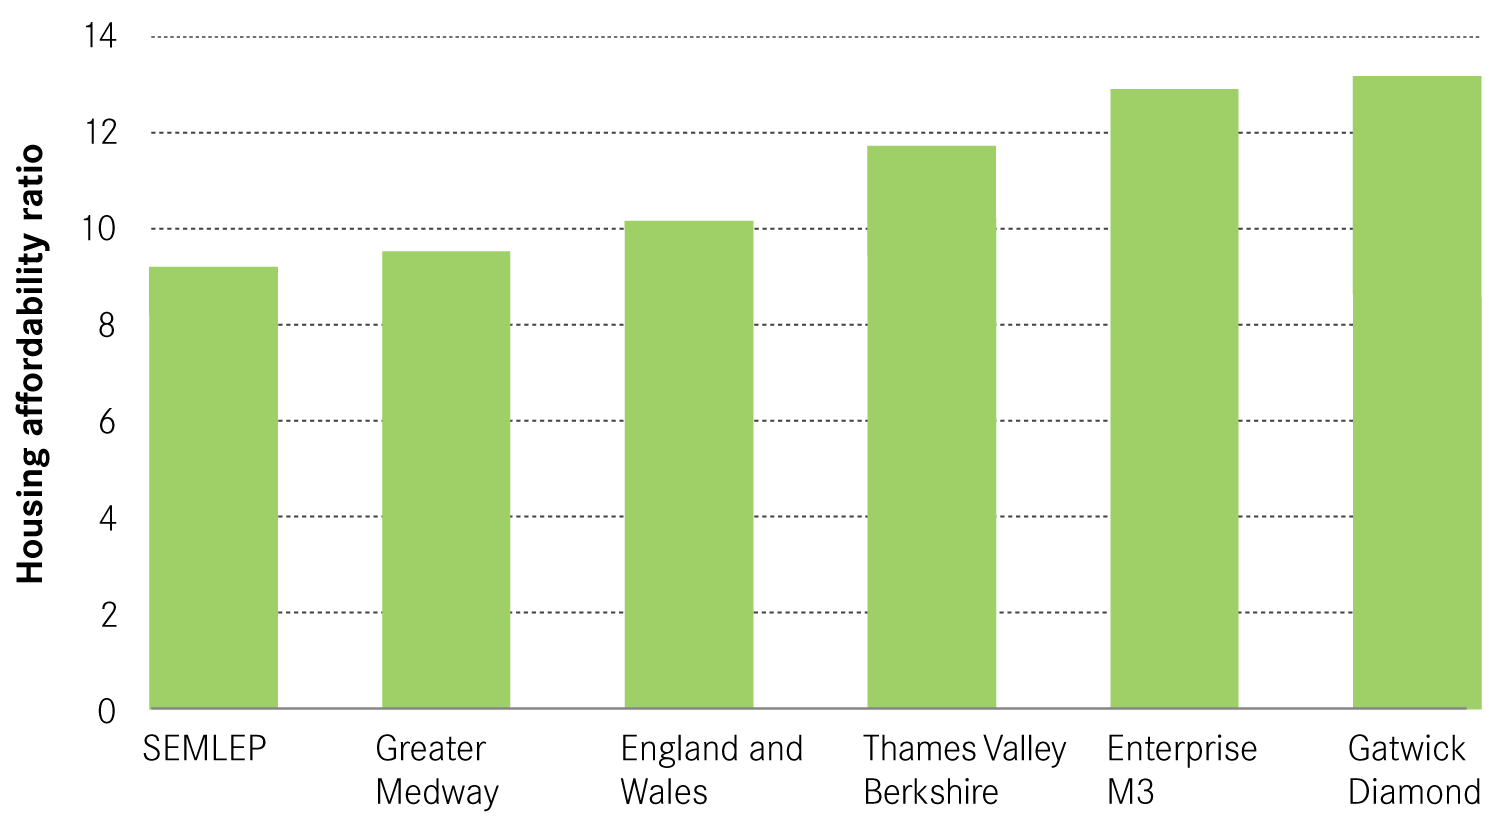
In terms of housing, the Gatwick Diamond is the least affordable of all the comparator areas, with house prices more than 13 times higher than the annual resident wage (see Figure 24).17 This is 1.4 points higher than in the Thames Valley Berkshire and 4 points higher than in the SEMLEP.
Figure 24: Housing affordability ratio
Yet as described previously, a large proportion of the Gatwick Diamond’s residents work elsewhere, leading to great variations in their salaries. This means that the affordability of housing differs for those residents who work in Gatwick Diamond and those who work elsewhere.
Figure 25 below shows housing affordability of Gatwick Diamond’s residents according to their place of work. The main destination of residents commuting to London is Westminster and the City – more than 6 per cent of all Gatwick Diamond’s residents worked in this area. And the average weekly wage in the borough of Westminster and the City of London was £943 in 2016, 53 per cent higher than the average worker’s wage in the Gatwick Diamond. For these workers, living in the Gatwick Diamond is only 8.7 times their annual salary, which is even lower than the British average. This is likely to make the Gatwick Diamond area a relatively attractive place for these workers to live.
Figure 25: Affordability ratio by work place, 2016
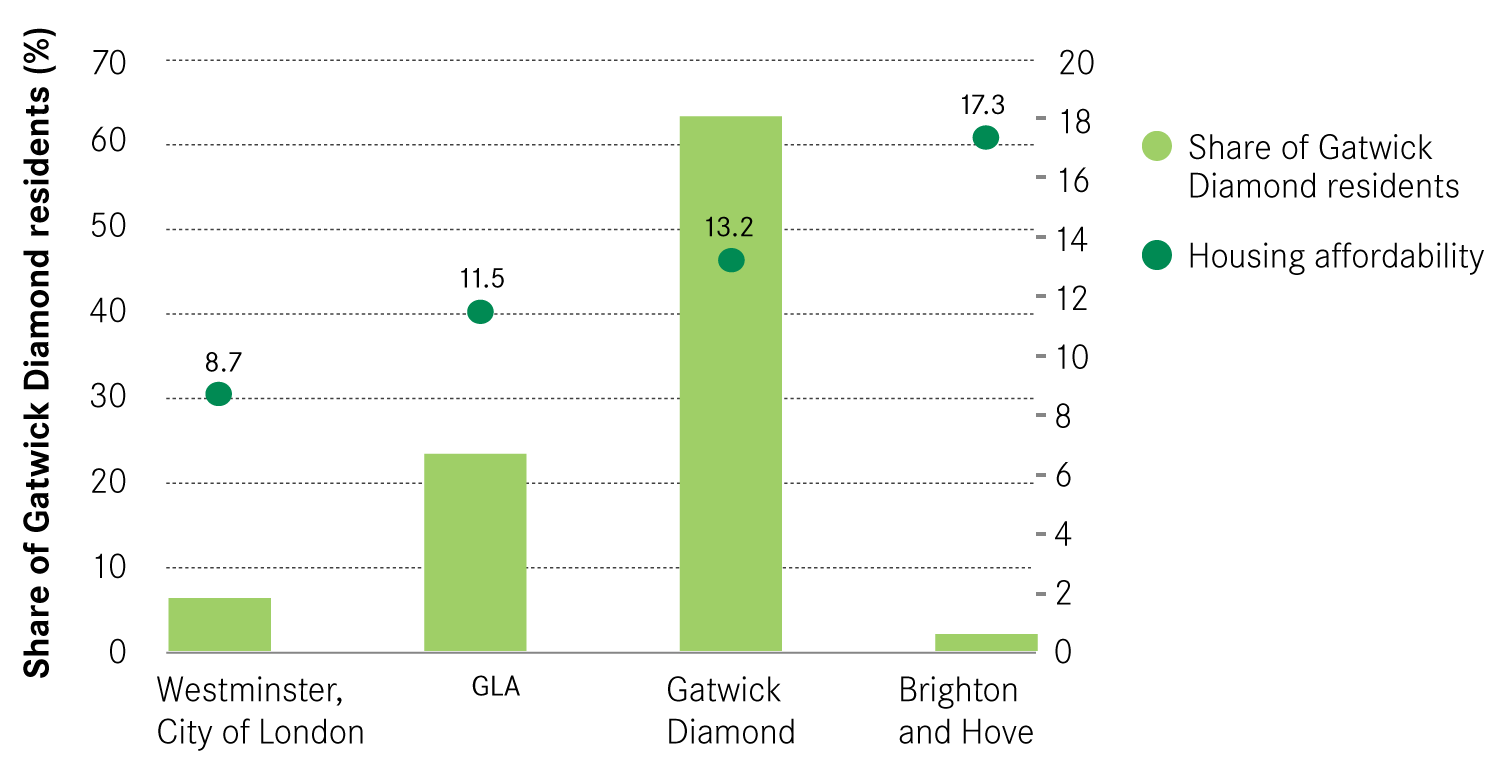
On the other hand, living in the Gatwick Diamond is considerably less affordable for those who work in Brighton and Hove, for whom the average house price is 17 times higher than the average annual salary.
Looking at the migration patterns in and out of the Gatwick Diamond show the demographics of Londoners, to whom the area is particularly attractive. Between 2009 and 2015, the Gatwick Diamond attracted a net inflow of 25,500 people of all ages, suggesting that it is an attractive place to live. Within this, there was a large net inflow of people aged 31-45 to the Gatwick Diamond, with an accompanying inflow of those aged 0 to 7. Most of the people came from London (in particular south and south-west London), as well as Brighton and Hove. Comparatively, the Gatwick Diamond lost a large part of its population to the South Coast and the South West of England.
These patterns suggest that the area is attracting young families from London as they look for more space, and commuting patterns suggest that a number of them are likely to continue to work in London. The relatively higher affordability of the area makes it an attractive choice for London workers to live. This provides a particular housing challenge. The Gatwick Diamond is relatively cheap for these people because of the wages they earn in London. But demand to live in the area pushes up housing costs for those who live and work there.
This demand is reflected in the varying nature of house prices across the Diamond. Figure 26 shows the cost of housing per square metre across the Gatwick Diamond, to take account of differing house sizes. It shows that the average house price per m2 was considerably higher in the north than in the south. In Epsom and Ewell and Mole Valley, the house price per m2 was above £5,000, and it was close to £4,600 in Reigate and Banstead. Tandridge followed with houses being sold at around £4,200 per m2, above Mid-Sussex and Horsham (about £4,000 per m2). Meanwhile Crawley had the lowest house price per m2, at £3,600.
Figure 26: Average house price per m2 by local authority

This poses a challenge to the Gatwick Diamond. Given both the economic strength of London and the acute nature of the capital’s housing crisis, the appeal of the Gatwick Diamond for London workers is likely to persist. In doing so this is likely to push up house prices in the area further, making it more unaffordable to those who work in the Diamond. Given that the supply of workers is an important factor in attracting and retaining businesses in the Diamond, failing to deal with the growing unaffordability of housing may make the area less attractive to business investment in the future, with implications for economic growth.
Competition for space – the role of Permitted Development Rights
As well as pushing up the cost of housing, high demand is also likely to create pressure to convert commercial space to residential space, something that has been made easier through the introduction of Permitted Development Rights (PDR).
Permitted Development Rights (PDR), which simplifies the process to convert commercial space into residential, appears to be causing particular pressures in the Gatwick Diamond.
According to DCLG planning application statistics, in the past three years 31 per cent of all PDR applications in the Gatwick Diamond concerned non-residential to residential conversions, while the remaining of the applications were mostly related to home extensions. This was considerably higher than in England as a whole, where conversions only concerned 18 per cent of PDR applications, but also higher than any comparator area. In Enterprise M3 for instance, conversions accounted for 26 per cent of PDR applications, and in the Thames Valley Berkshire this was only 19 per cent.
In total more than 60 per cent of these applications went through in the Gatwick Diamond – which equals to almost 400 agreed conversions between April 2014 and April 2017. This represents 1.9 per cent of all the Gatwick Diamond non-residential properties, a slightly higher share than in other comparator areas. In the SEMLEP for instance, the total number of agreed PDR conversions to residential represented 1.3 per cent of all non-residential units.
Within the Gatwick Diamond, more than half of all the applications for conversions to residential were submitted to the local authorities of Horsham and the Mole Valley, while Crawley and Epsom and Ewell both received the lowest number of applications for conversion (7.7 and 6.6 per cent of all Gatwick Diamond’s PDR applications for conversions).
PDR could act as a constraint on economic growth by reducing the number of commercial properties available to current or potential businesses, therefore increasing prices and restraining growth. This has become an issue in other high demand areas, and has led a number of authorities – particularly those in central London – to seek exemption from PDR.