01Introduction
Housing matters to people; it is both where they live and makes up the biggest share of household spending.1 It also matters to the economy both nationally and locally. There is now a consensus between politicians from all three major parties, the OECD and the IMF that house prices in the UK are too high in relation to wages. House prices have doubled over the last 15 years while average incomes have only increased by 28 per cent,2 a result of a mismatch between demand and supply.
Modest estimates put the UK’s house-building shortfall at 110,000 – over half of the minimum of 200,000 houses that are needed each year.3 In recognition of this, there is cross-party political support for an increase in the building of new homes nationally.
While this is welcome, there is less clarity or consensus on where these homes are needed, which this paper addresses. House-building is reflecting neither the geography nor the scale of demand in the areas where people want to live, close to the jobs and opportunities offered by successful city economies.4 As it stands, there are too few homes with access to these jobs, which offer people limited options as to the home and the community in which they can live.
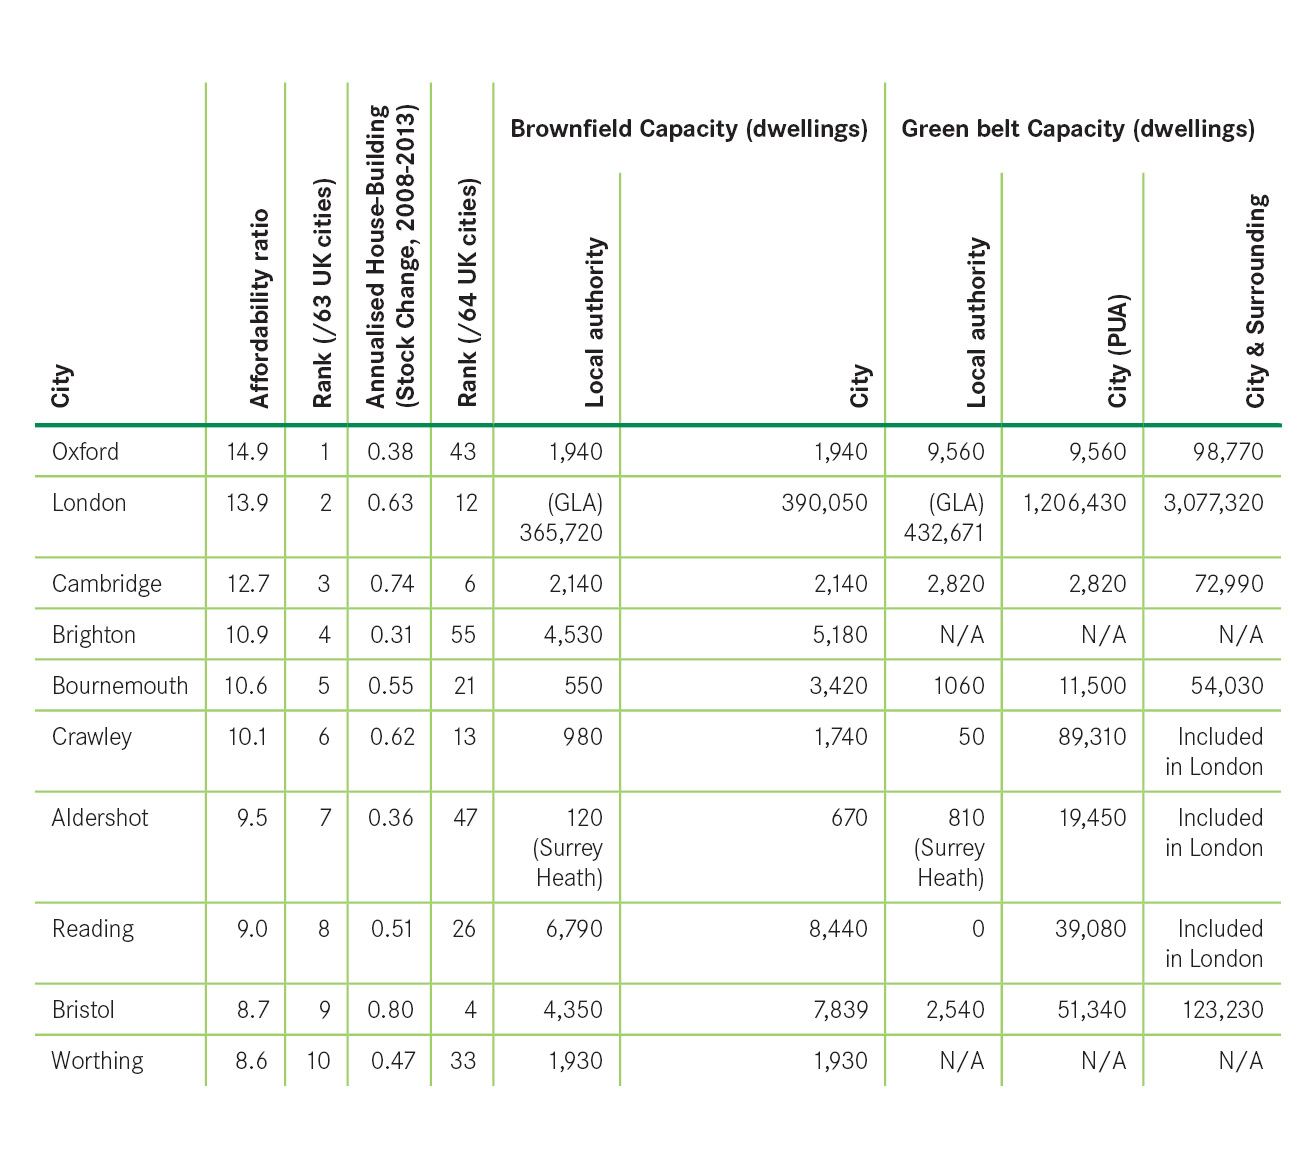
Demand for housing is most pressing in the country’s most economically successful cities such as Oxford, London, Cambridge and Bristol. Table 1 shows the cities with the least affordable housing in the country (using mean house price to mean income ratios). In these cities demand for housing far outstrips supply. With the exception of Bristol, Bournemouth and Cambridge, the cities with the least affordable housing in Britain are in the Greater South East of England.
Figure 1: Least affordable cities in Great Britain (House prices relative to income)