02The role of cities in their national and European economies
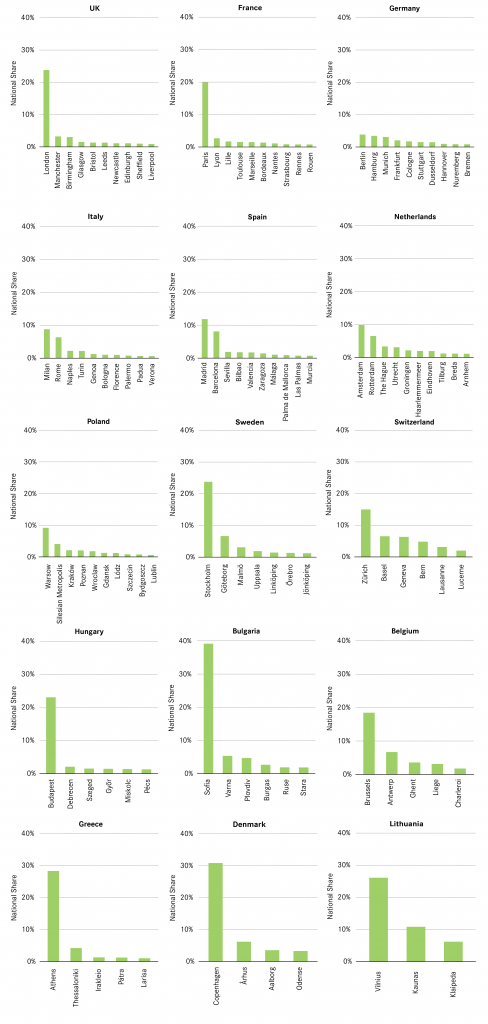
Cities play a much larger role in the UK economy than their counterparts in other European countries. Around 60 per cent of UK output is generated in its cities. As Figure 3 shows, in no other country do cities represent such a high share of national GVA. In France, cities account for 50 per cent of the national GVA, while they account for 36 per cent of German output and 32 per cent of the Italian economy.3
This economic activity is more strongly concentrated in a few places in the UK than in any other large country. London alone accounts for 24 per cent of UK GVA. As Figure 3 shows, having one city dominating the national economy is not an exception in Europe – Copenhagen represents more than 30 per cent of the Danish economy, while Paris accounts for 20 per cent of the French economy.
But capital cities do not dominate everywhere. In Germany, Berlin comprises only 4 per cent of German GVA, while in the Netherlands Amsterdam accounts for 10 per cent of output. And Italy and Spain are countries whose economies are dominated by two cities rather than one capital city.
The relative size of London to the UK’s next largest cities is much more reflective of the pattern seen in France than other western European countries (see Figure 4). The economies of Manchester and Lyon (the second cities in each country) are about seven times smaller than London and Paris respectively.
In contrast, in Spain the gap between Madrid and Barcelona is not as acute, with Madrid’s economy being only 1.4 times larger than that of Barcelona. However the third largest city, Seville, is significantly smaller and is only a fourth of the size of Barcelona. This pattern is similar in Italy, where the output of Milan is also 1.4 times higher than Rome, but Naples is three times smaller than Rome.
At the other end of the spectrum, Germany is much more decentralised, with no one city strongly dominating. The economy of Berlin, the largest German city in terms of output, is only 12 per cent bigger than Hamburg, the second largest economy. And while London alone accounts for a quarter of the UK’s economic output, in Germany it takes the country’s 18 largest cities to do the same.
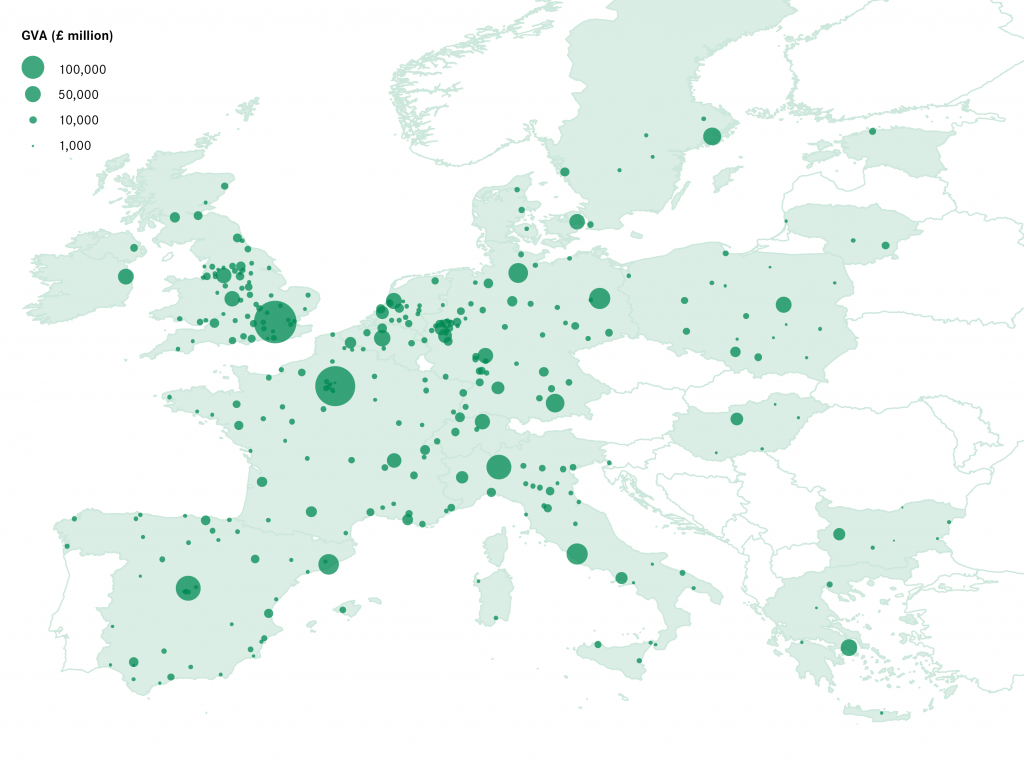
London dominates not only the UK economy but the European economy too. In 2011 London was the largest economy in Europe, producing more than £340 billion worth of goods and services (3.4 per cent of the European economy). As shown in Figure 6 Paris was a close second, and generated about £300 billion.4 This was almost three times higher than Milan, the third largest economy. London wasn’t the only UK city to feature in the top 20 however – Manchester and Birmingham ranked 16th and 19th respectively.
Figure 6: Top 20 European cities (GVA £ billion), 2011
As a group, UK cities made the largest contribution to the urban economy of Europe. The UK’s cities accounted for 21 per cent of European cities’ output, while German and French cities represented 19 per cent and 18 per cent of output respectively (Figure 7). This shows the relative size and importance of UK cities in the European context.


