
02The performance of city centres
The performance of city centres has varied over the last two decades
Some city centres have undergone a radical change in the last two decades. After seeing populations decline in the 1970s and 1980s,1 the cores of a number of cities have passed a turning point and seen a boom in both the number of jobs located and people living in city centres.
There have been two big changes in city centres on average since the turn of the century. In terms of jobs, ‘knowledge-based’ jobs such as those in marketing, finance and law, have contributed an ever larger share of all jobs in city centres between 1998 and 2015. In terms of populations, city centres are now younger, with the average city centre resident being 2.5 years younger in 2017 than in 2002.
These changes have not affected all city centres in the same way. Figure 1 sets out the performance of city centres in terms of job creation and population growth since the turn of the century, with the size of the bubble denoting the cost of commercial and housing land within them.2
The crossed lines show the average population and job growth rates for city centres across the country, excluding London. Splitting the chart into quadrants, using these average lines, explains why this variation has occurred.
Figure 1: The growth of jobs and population in city centres
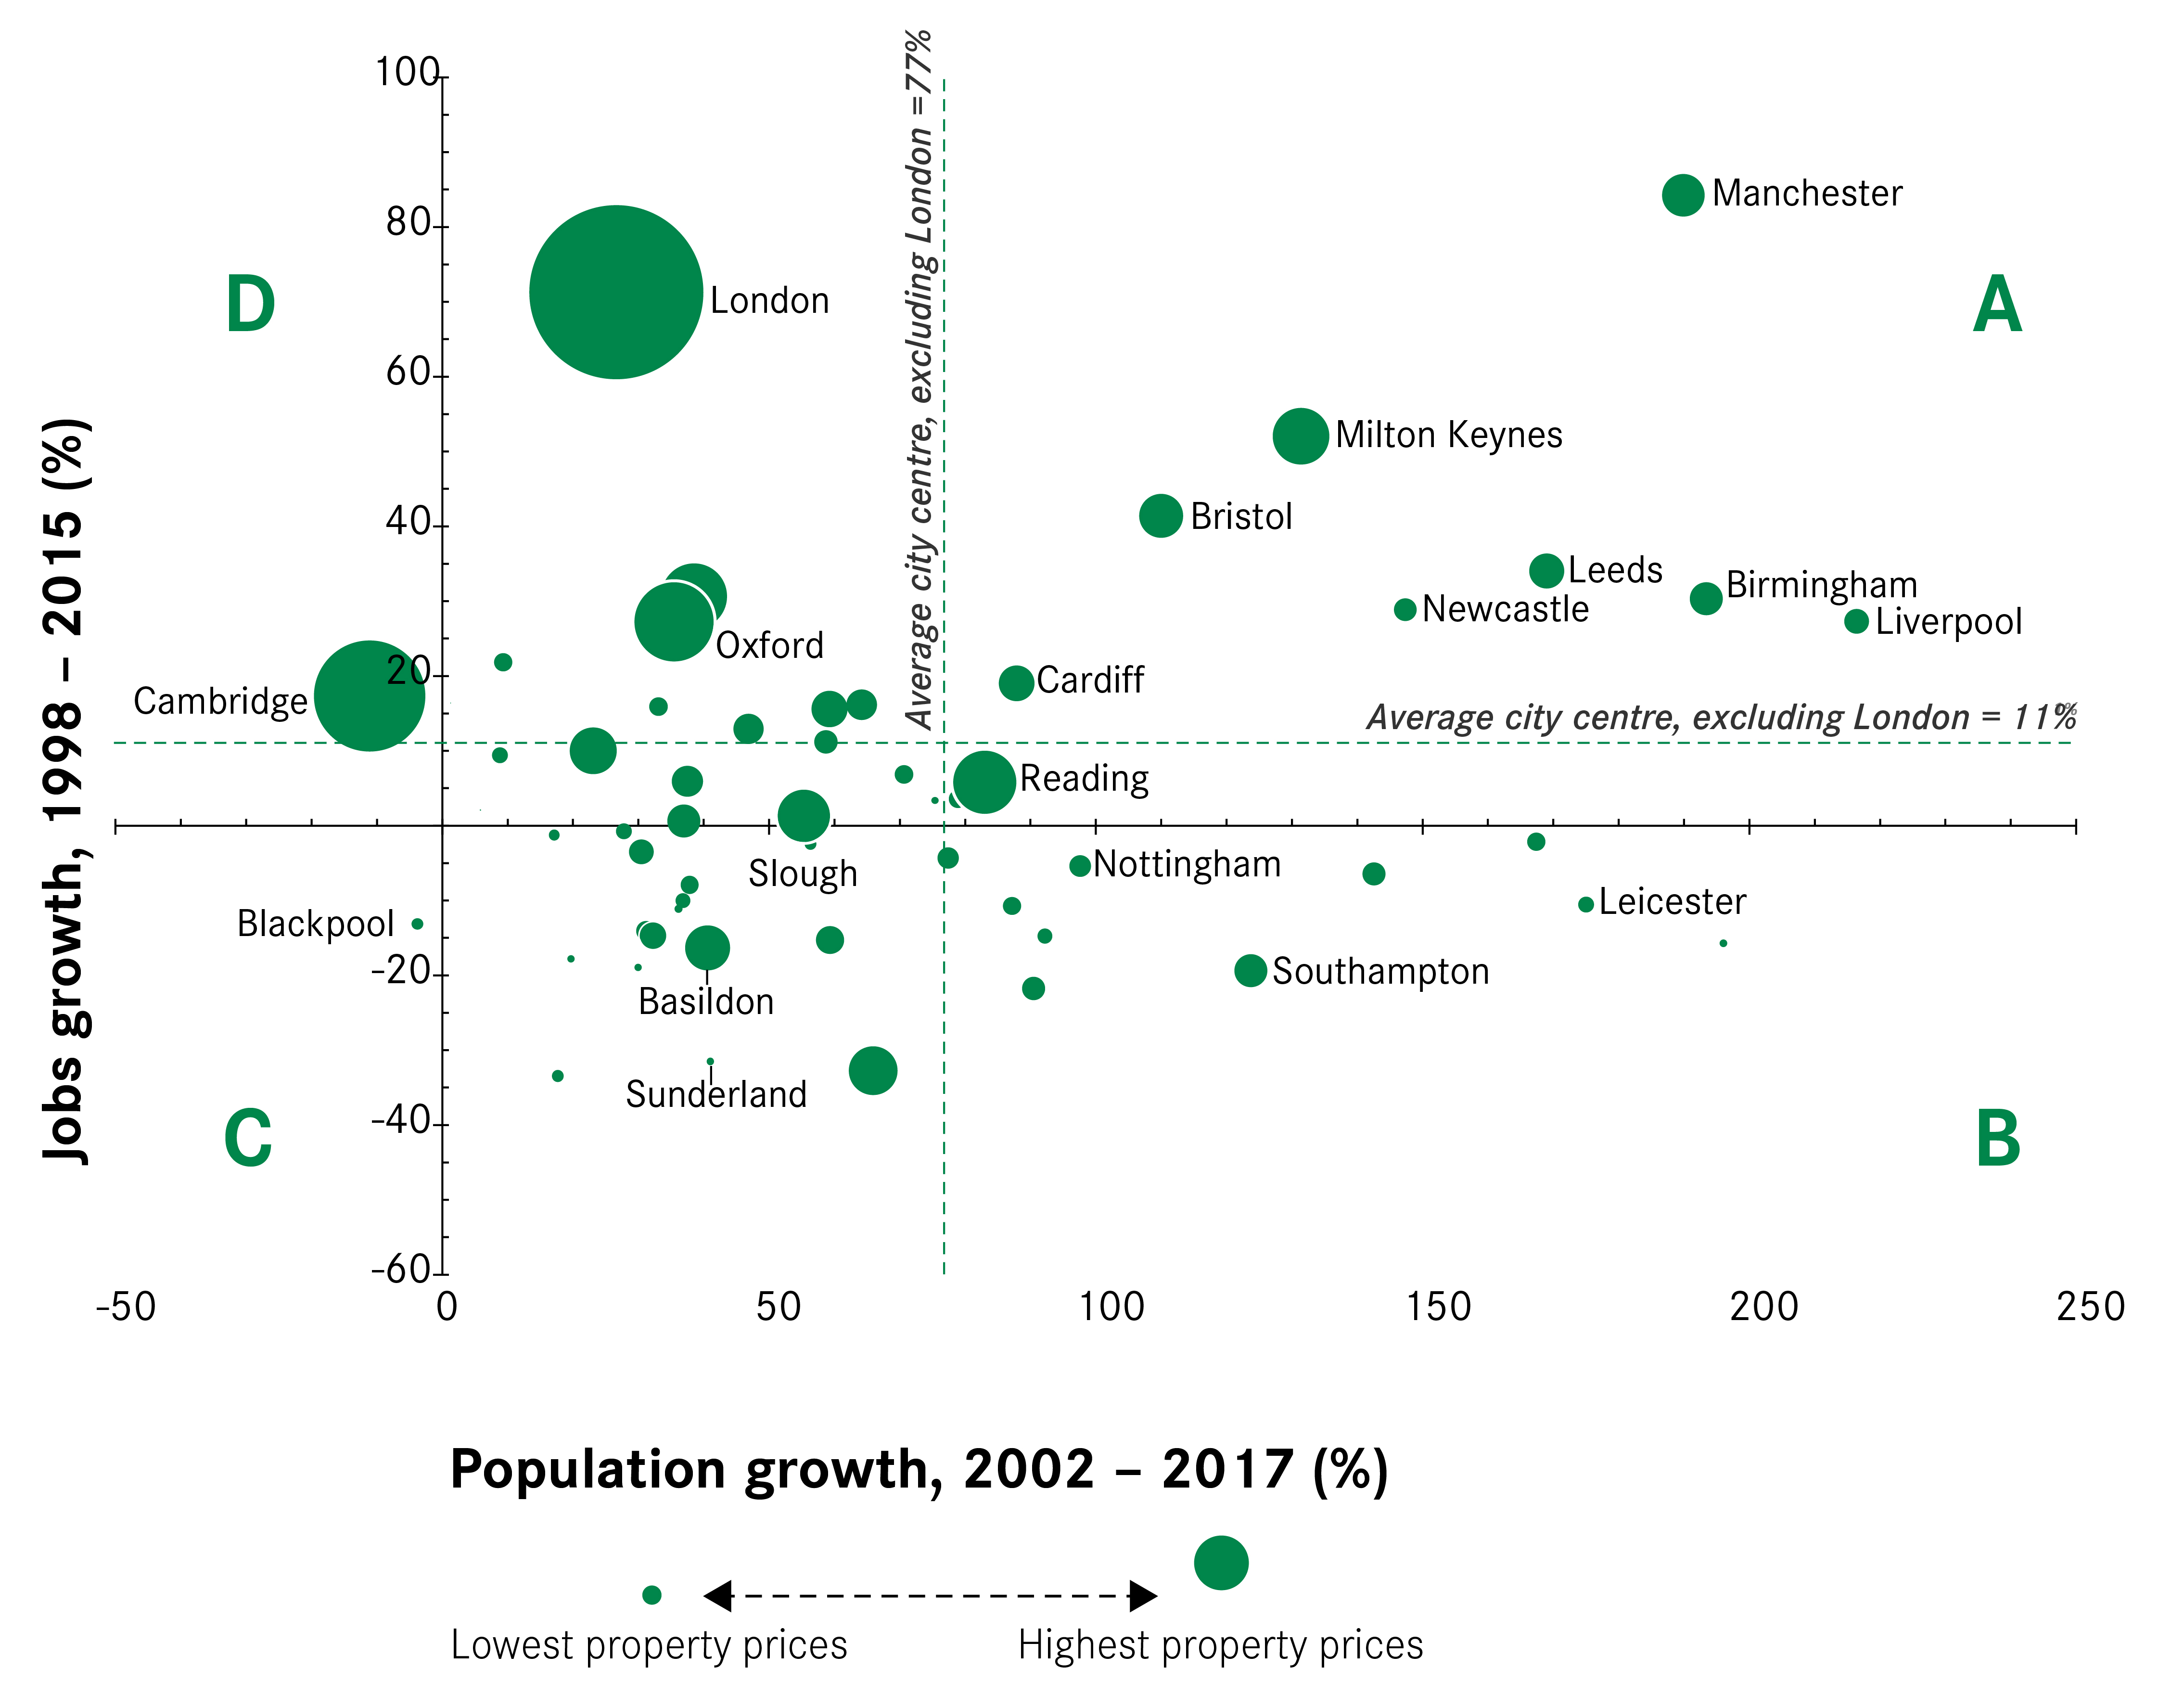
Quadrant A city centres have seen the largest growth, with Manchester city centre in particular seeing great success. Jobs growth has been driven by an increase in knowledge-based services activities. In terms of population, the return to city centre living has been driven by a mix of students and young professionals, reflecting the expanding role of these city centres as places to both live and work.
The relatively low prices of property in these city centres (compared with larger circles in other quadrants) suggest that this rapid growth has largely been accommodated with an increase in the supply of property. In Manchester, for example, the city centre has made room for an additional 20,000 residents (since 2002) and 70,000 jobs (since 1998).
The much higher property prices in a number of city centres in Quadrant D, such as Oxford and London, coupled with below average population growth suggest this has not been the case in these city centres. This is not because of a lack of demand, but instead due to constraints on supply as house building has failed to sufficiently respond to demand thereby limiting population growth. This is likely to help explain why in London half of overall population growth was attributed to those aged over 30, who are more able to afford the high prices, compared with 18 per cent in Leeds and 22 per cent in Manchester where housing is more affordable.
Although Scottish population data is unavailable for this time period, the growth rate between the 2001 and 2011 Census indicates that Glasgow would fall within Quadrant D, but close to the boundary with Quadrant A. Its population is estimated to have grown by 72 per cent between 2002 and 20173 while the number of city centre jobs increased by 15 per cent, giving it the fastest jobs growth of all Scottish cities.
City centres in Quadrant B have seen the opposite trend, experiencing strong residential growth in spite of very poor jobs growth. This has tended to be the result of growth in the number of students living in the city centre, or because the population grew from a very small initial base leading to a large percentage increase (for example in Bradford). Growth in students was particularly prominent in Sheffield and Leicester. Census data shows that in Sheffield the increase in student residents between 2001 and 2011 was equivalent to three-quarters of the city centre’s total population growth, while in Leicester it was 63 per cent. Box 3 discusses this in more detail.
In Scotland, Dundee would also fall within Quadrant B, having experienced fast population growth of 87 per cent but no increase in city centre jobs.
Box 3: Population growth in selected city centres, 2001-2011
Data from the Census gives more detail on the age and qualifications of those that moved into city centres. As Figure 2 shows, young people made up the vast majority of the growth across all city centres but there were differences between city centres in Quadrants A and B.
In Quadrant A, growth was driven by a combination of students (who made up the vast majority of those in the category 16-24 without a degree) and young professionals (denoted by those aged 16-34 with a degree). In Manchester and Birmingham city centres, in particular, there was a large inflow of young professionals, contributing nearly half of the population growth across the decade.
In city centres in Quadrant B, population growth was driven more by an expansion in the city centres’ students, with young professionals playing a smaller role. In Sheffield and Nottingham, for example, more than half the population growth between 2001 and 2011 can be attributed to those aged 16-24 without a degree.
Figure 2: Composition of population growth in selected city centres, 2001-11

Finally, city centres in Quadrant C have seen sluggish growth in both residents and jobs. The varying price of space within this group suggests this has occurred for two different reasons. First, in inexpensive city centres, such as Barnsley and Mansfield, this is likely to be because they have not been very attractive to high-skilled business investment (explored further in the next section), and this, in turn, has meant that residential growth has been weak. In particular, there has been little demand from higher-skilled workers to live in these city centres. For example, in Manchester, Reading and Brighton, around half of all city centre residents had a degree in 2011. In Doncaster, Birkenhead and Blackpool, it was around 12 per cent.
Second, in a city centre like York where property is relatively expensive, its low growth may be partly due to restrictions in space within its historic centre. This makes York much more like cities in Quadrant D, such as Cambridge, where constraints on the availability of space require choices and trade-offs about how land is used, but without the same growth in jobs.
In Scotland, Aberdeen and Edinburgh would fall within Quadrant C. Edinburgh had the faster-growing city centre, with an estimated population increase of 38 per cent, but jobs growth was weak in both. There was only a 3 per cent growth in jobs in Edinburgh, and a decline of 8 per cent in Aberdeen.
Jobs are the drivers of city centre rebirth
Growth has occurred in successful city centres principally because of their ability to attract jobs. These jobs have in turn created additional footfall for shops, bars and restaurants and together these developments have altered the benefits the city centres offer as places to live.
Access to jobs and shops, restaurants and other amenities scored highly on a Centre for Cities survey of those people who live in a city centre, as Figure 3 shows. This has triggered population growth and a return to city centre living in the city centres with the strongest jobs growth and explains why this population boom has not been replicated in those city centres in Quadrant C which struggle to attract jobs.
Figure 3: The main reasons why respondents chose to live in their neighbourhood

City centres in Quadrant B offer a counter to this, as they have been able to attract new residents despite poor jobs growth. But as noted earlier, this has predominantly been driven by the expansion of higher education. The location decisions made by students are likely to have been driven by proximity to university facilities and other amenities, combined with a renewed focus by some cities on developing student accommodation in more central locations. So this growth has been a result of the increasing role these city centres play as places to learn, rather than places to work.
This distinction between learning and working matters. While growth in student numbers boosts footfall and generates a vibrant local services sector, it has occurred independently from jobs growth. This is why population growth of young professionals in these centres has been weaker than in more successful cities.
High-skilled services jobs locate in successful city centres because of the benefits they offer
The ongoing structural changes seen in the national economy, with an ever greater specialisation in more knowledge-based services activities, has increased the attractiveness of a city centre as a business location.
This is because successful city centres offer specific benefits to businesses that other areas of the UK – be they the suburbs of cities, the hinterlands around cities, or more rural areas – are less able to. As well as offering access to many workers for businesses to hire from within a commutable distance, they also offer the potential for face-to-face interaction with clients, collaborators and competitors, allowing them to share ideas and information. In turn, the ability to share this information (through ‘knowledge spillovers’) makes them more productive.
Importantly, this does not apply to all businesses, but to knowledge-based ‘exporter’ businesses. These companies are defined as those that sell beyond their local market, be that to regional, national or international markets. And because they don’t sell to any one particular market, their location is not tied to one either, making them footloose in principle.
This contrasts with a second group of businesses, described in Centre for Cities’ work as local services firms. These businesses, such as hairdressers and restaurants, sell exclusively to a local market which means their location is fixed to where there is a population centre to sell to.
The success of cities and city centres is determined by their ability to attract exporting businesses. This is for two reasons. The first is that these businesses are both more productive than local services, and are the drivers of productivity growth.5 The second is that in improving productivity, they increase wages in a local economy, which in turn increases demand for local services. This means that the success of a city centre’s local services hinges on the success of the city’s export base.
The growing importance of ever more knowledge-based activities to the national economy has meant that city centres have become increasingly important in recent years, with these types of higher-paid, higher-skilled jobs increasingly locating in them since 1998.6 Crucially, these businesses are prepared to pay a premium for this, as shown by the many businesses clustered in the centre of London, despite it being one of the most expensive places in the world to locate.7
Given that the UK is likely to continue to specialise in such activities, this will mean that city centres will become ever more important to the success of the national economy. And given the trends seen above, this will mean that city centre living is likely to become ever more in demand in successful city centres too.
Not all city centres offer the benefits that high-skilled businesses are looking for
As suggested above, not all city centres appear to have offered such appeal to business. Looking at the industrial make-up of city centre economies in 2015 shows this variation across city centres.
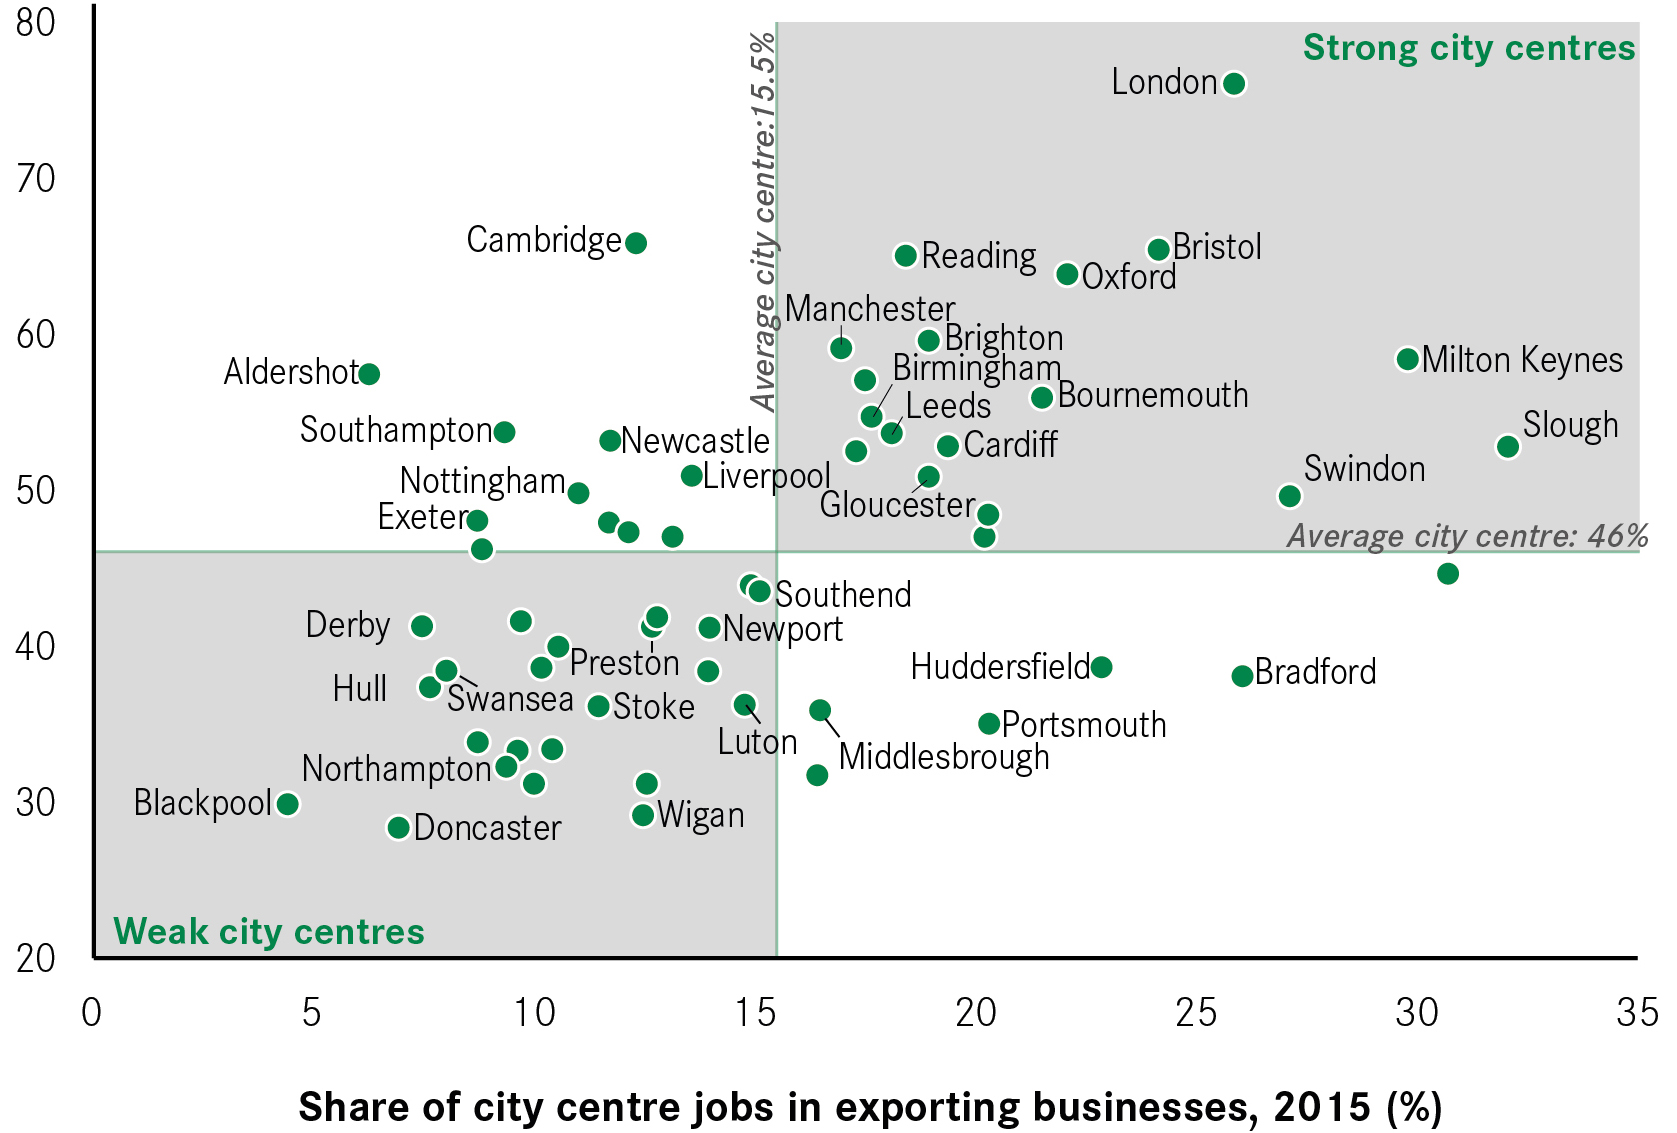
Figure 4 shows how successful city centres have been at attracting in exporting businesses, and how highly skilled the jobs that these businesses have created are. City centres in the top right quadrant, such as Milton Keynes and Bristol, have a higher than average share of jobs in exporting businesses, and a significant share of these jobs are high-skilled. In contrast, city centres in the bottom left, such as Northampton and Blackpool, have fewer than average exporting jobs and only a small share are high-skilled.
Reflecting the findings above, many of the city centres that have seen strong growth in recent years (Quadrant A in Figure 1) are classified as strong city centres in Figure 4, as they have attracted many high-skilled exporters. The strong jobs growth in these productivity-driving firms has, in turn, led to the population increases seen above.
Figure 4: The size and make-up of the exporting base in city centres
These outcomes are reflected in the benefits that different city centres offer to exporting businesses. The charts in Figure 5 show how these benefits vary according to the strength of a city centre’s economy.
Strong city centres (those with higher shares of high-skilled exporting jobs) tend to have access to a more highly-skilled workforce and contain a greater density of jobs (a proxy for knowledge spillovers). But they also have more expensive commercial space, showing that the businesses there are willing to pay a premium to access these benefits.
In contrast, weak city centres have fewer high-skilled workers and less dense city centres, meaning that knowledge spillovers are less likely to occur. Cheaper commercial space highlights how these characteristics result in a less attractive business location.
Figure 5: Characteristics of city centres

Given the growing importance of higher-skilled exporting jobs to the UK economy and their locational preferences, the challenge for economic policy is to maintain growth in the strongest cities and to get growth going in weaker ones. Despite this, the policy conversation instead focuses on the struggles of the high street, looking at city centres in terms of their role as places of leisure without considering their roles as places of work. As the next section will show, this misdiagnoses the problem.
The performance of the high street is an outcome of the wider economic performance of city centres
Because retailers and other high street businesses are local services businesses, the performance of the high street is a reflection of the strength of the city centre economy. This is shown by the varying fortunes of city centre retail across cities.
Figure 6 sets out the vacancy rates of high street services across English and Welsh city centres. The first thing to note is that, despite high profile closures in 2018, high street retail is not struggling everywhere. It is certainly true that retail is struggling in some city centres – in Wigan 21 per cent of units were empty in 2017-18, while in Newport this figure was 24 per cent – but in city centres such as Brighton and Birmingham, just 8 and 10 per cent of units (respectively) stood empty.
Figure 6: Vacancy rates in city centresacancy rates in city centres

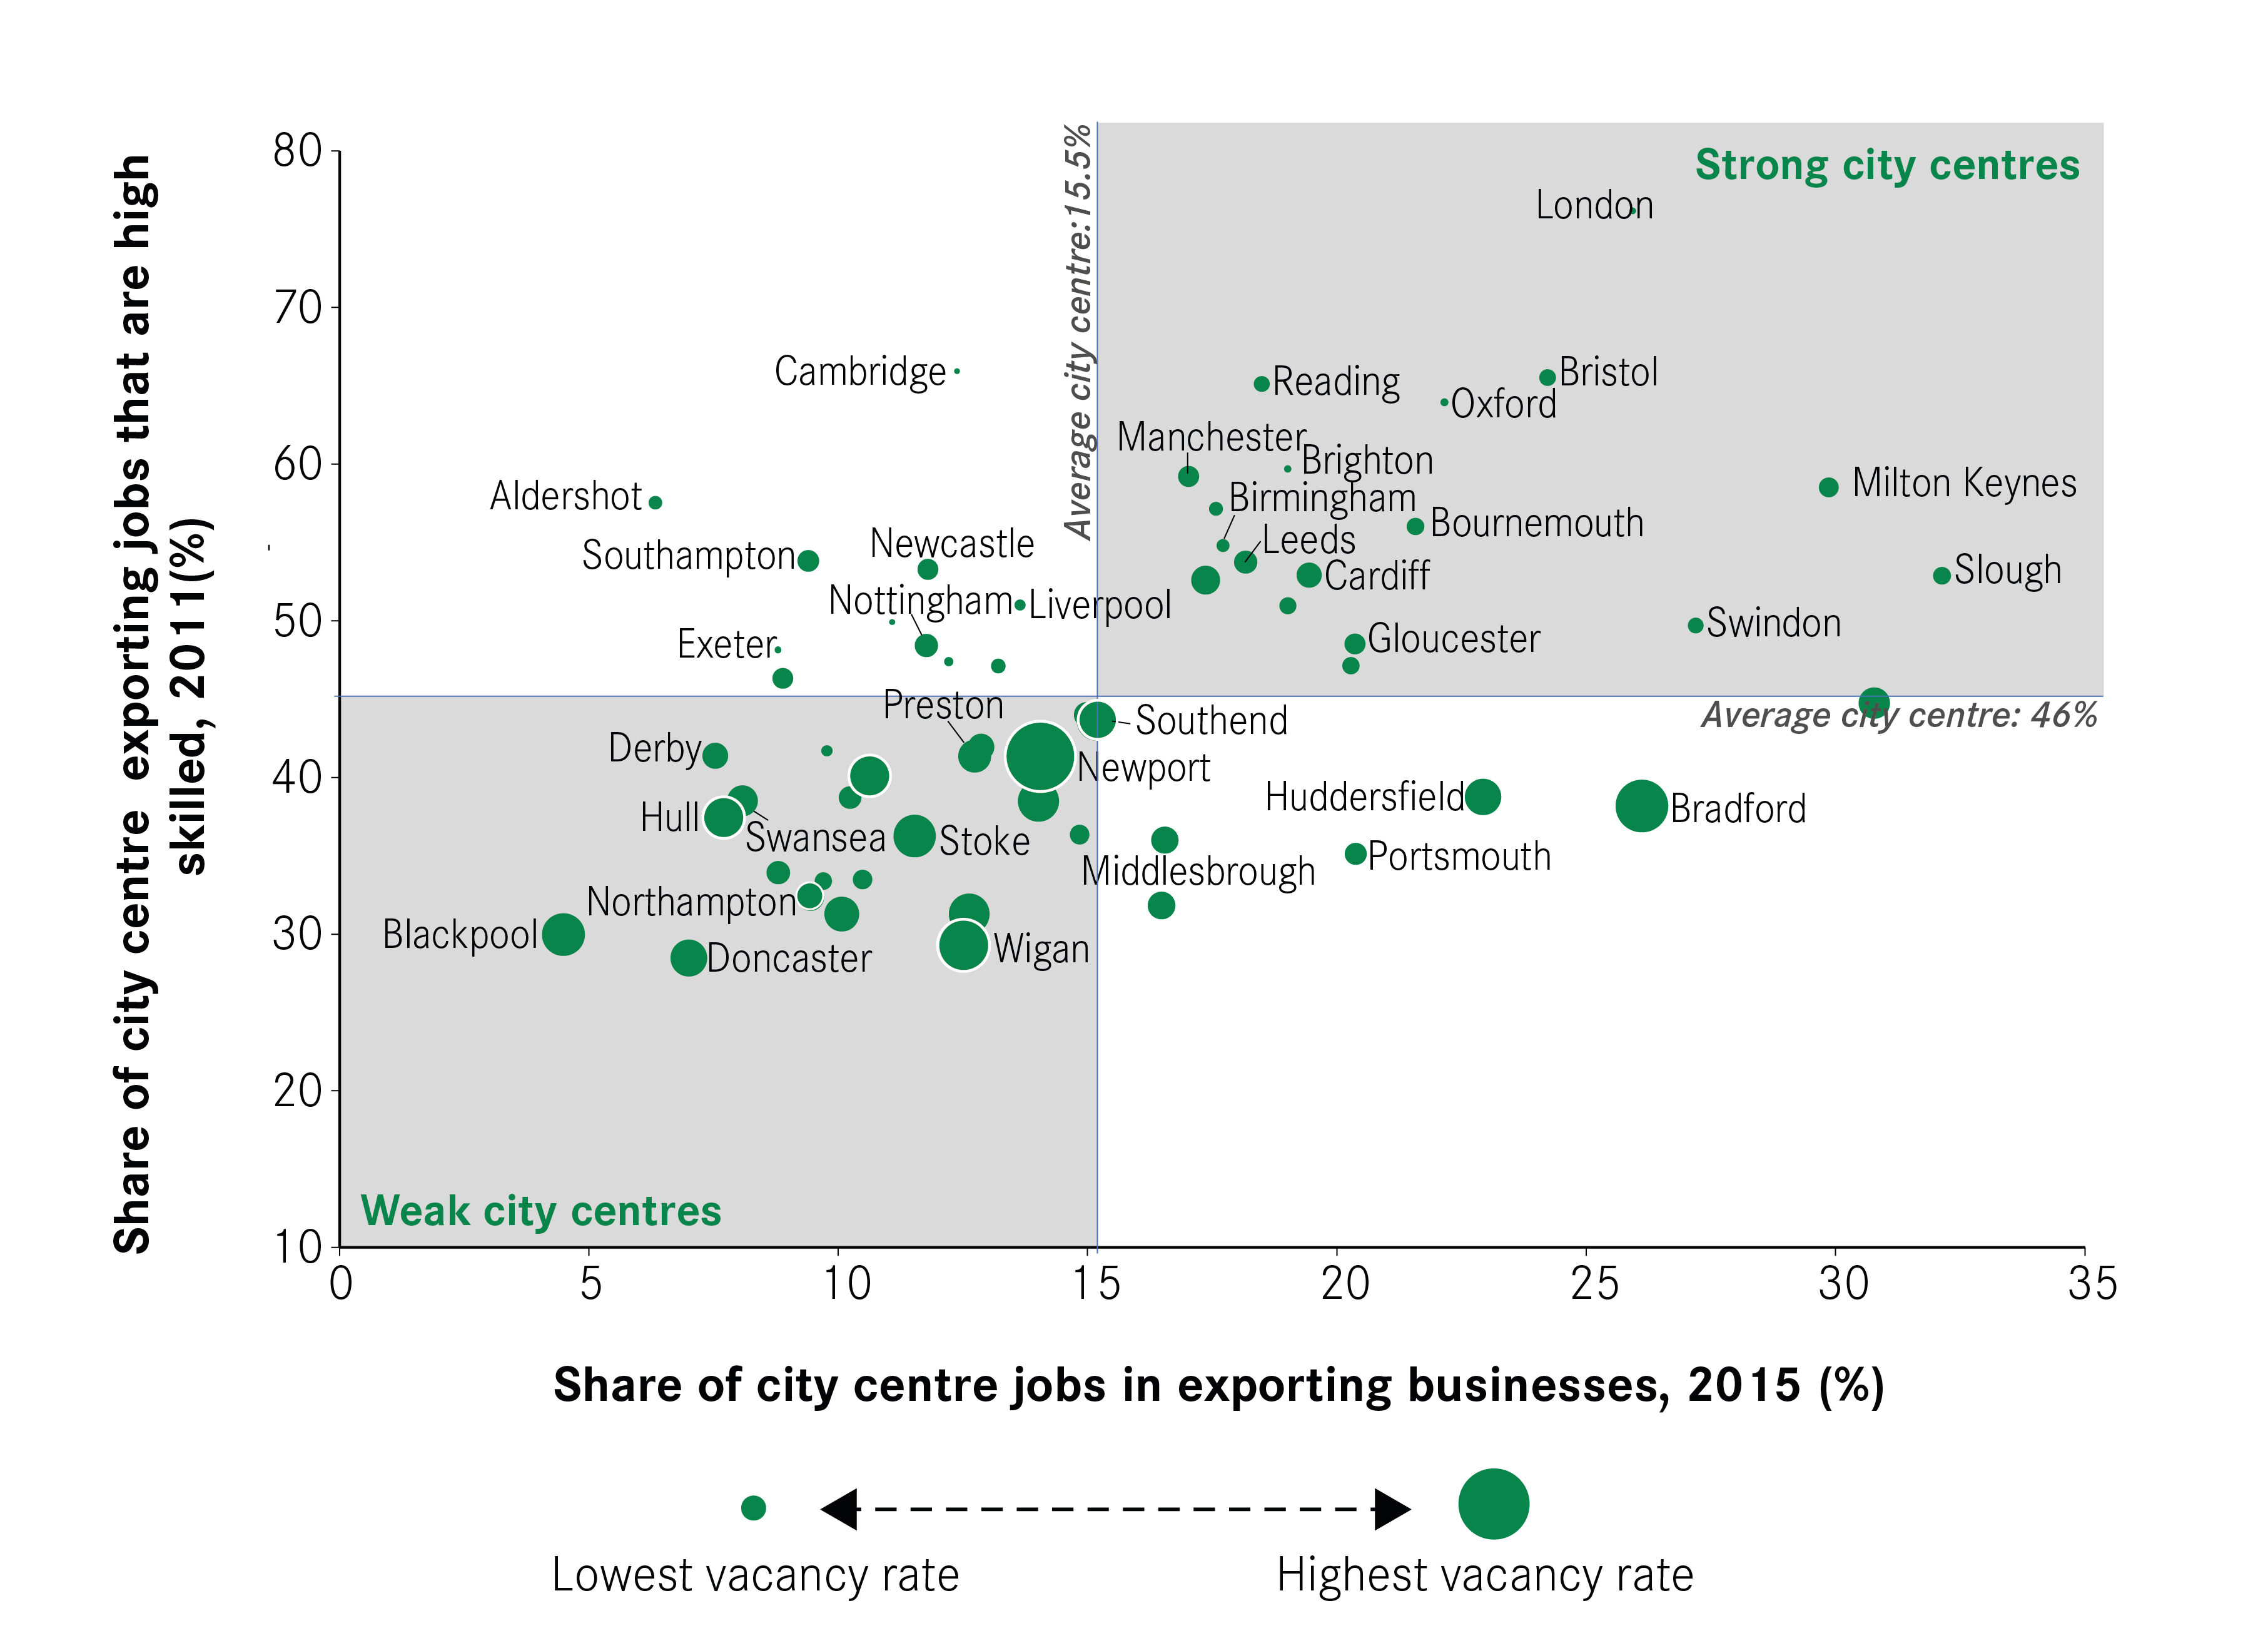
These vacancy rates are closely related to the strength of each city centre economy, as Figure 7 shows. This is the same chart as Figure 4, but the size of the circles now indicates the vacancy rate in the city centre (the larger the circle, the greater the vacancy rate).
The chart shows how strong city centres (with larger, high-skilled export bases) tend to have lower high street vacancy rates. In contrast, weak city centres have many more empty shops (as shown by the larger circles in the bottom left quadrant). Given the link between exporting and local services activities explained above, this comes as no surprise.
Figure 7: High street services vacancy rate, by type of city centre
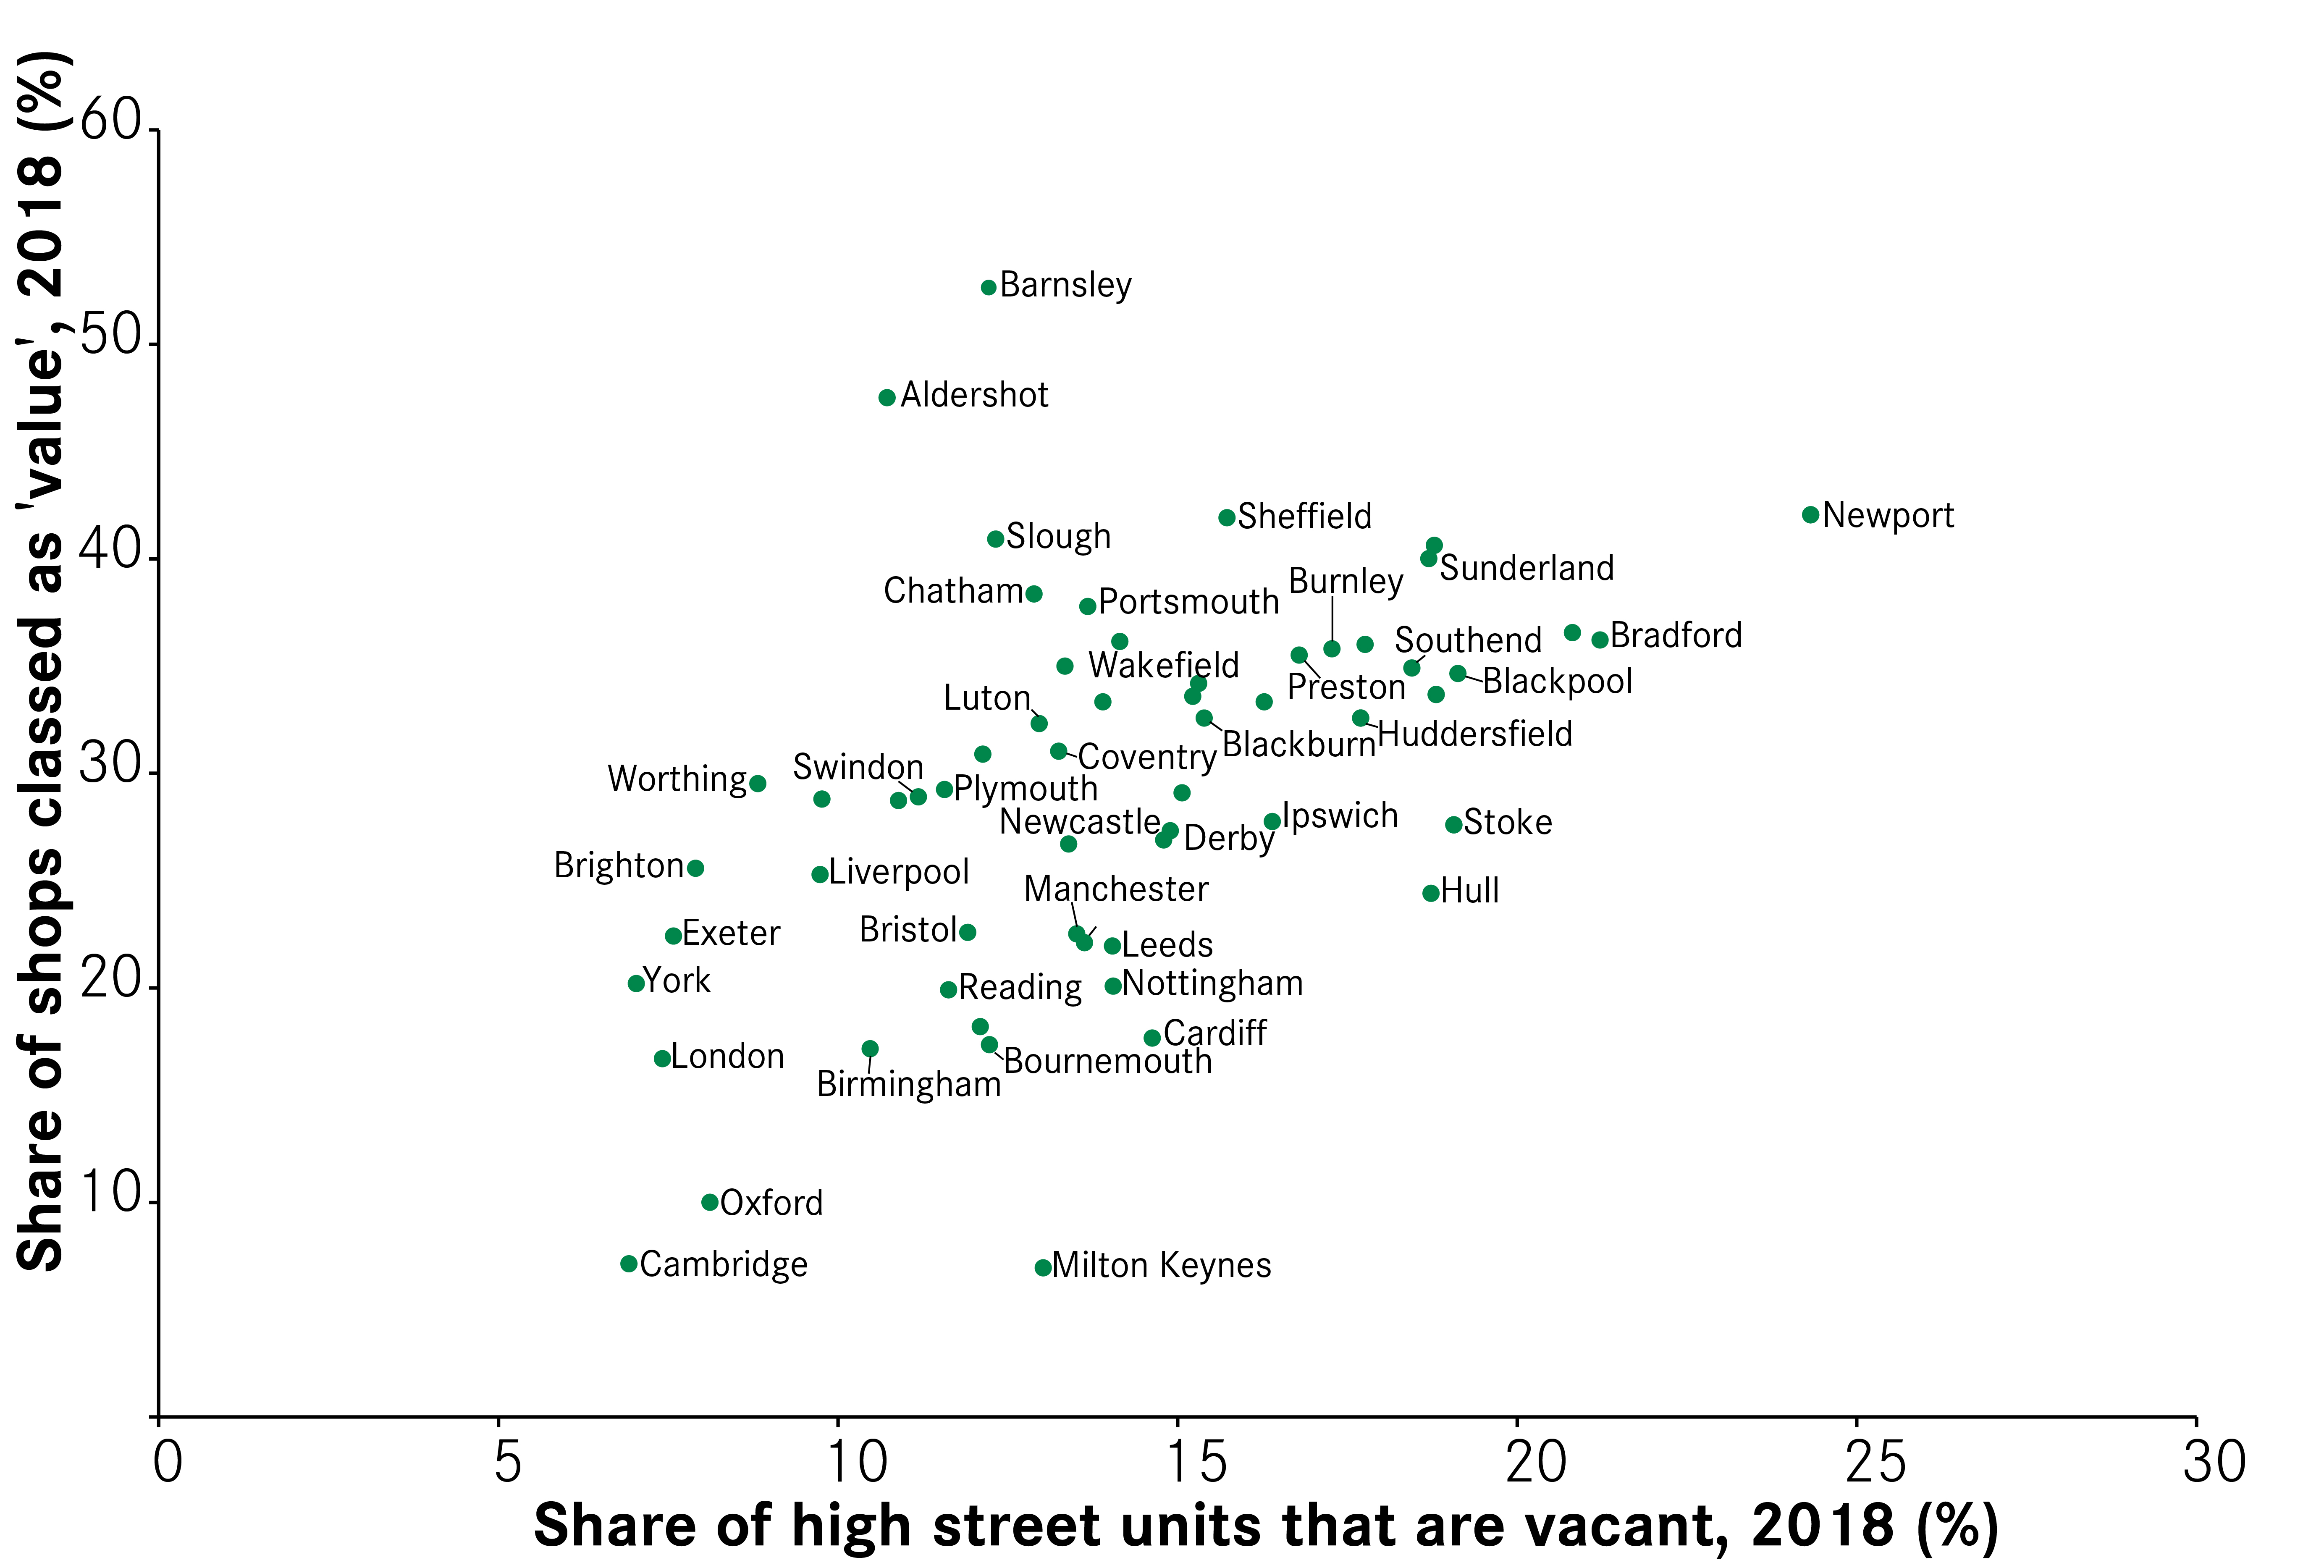
Of course, vacancies only tell part of the story. An occupied unit in itself says nothing of the quality of the activity going on within it. Looking specifically at the quality of retail in a city centre, Figure 8 shows there is a positive relationship between the share of shops that are empty and the share of retail which is ‘value’ (such as discount stores and charity shops) in different city centres. Not only do stronger city centres have fewer vacant shops, they also tend to have a higher quality offer.
Figure 8: The relationship between high street retail vacancies and ‘quality’ of the retail offer, 2018
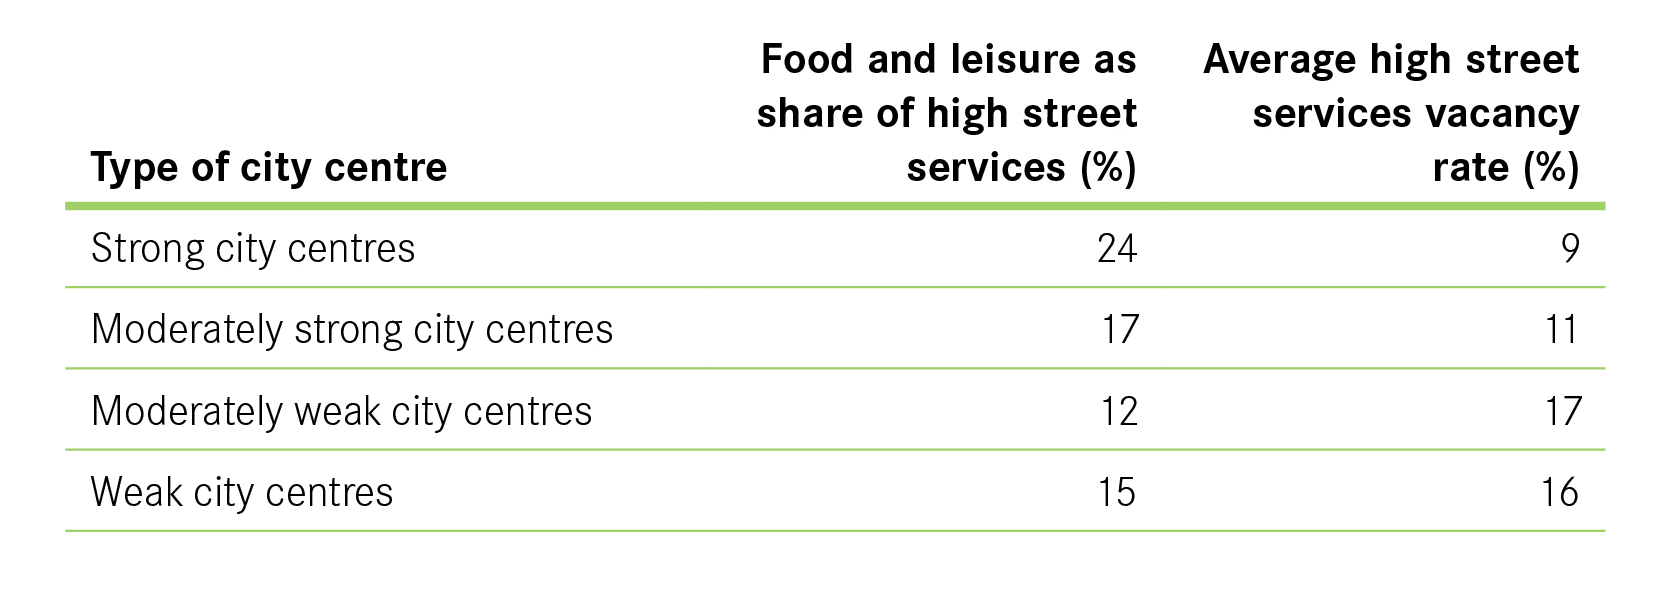
Differences can also be seen in terms of the mix of food and leisure units across different city centres (see Figure 9). Stronger city centres have a higher share of high street units designated for food, drink or leisure (24 per cent on average) than in weak city centres where retail is more dominant and food and leisure accounts for only 15 per cent of units.
Given the ongoing changes in retail, it is likely that the high street will continue to move away from comparison goods towards items that cannot be bought online, such as leisure experiences or a meal out. Stronger city centres appear to be making this transition more successfully than weaker city centres.
Again, this is likely to be an outcome of the performance of the city centre economy. While there may be a move towards a greater amount of retail spend taking place online, the pull of many thousands of people — residents, workers and visitors — into successful city centres still creates a market for business to sell to. It is the nature of what they sell that is changing. The challenge for weaker city centres is not the internet, but that unlike stronger city centres they lack the customer demand to make the shift away from retail.
Figure 9: Supply of food and leisure space in city centres and vacancy rates of high street services, 2017-18
Some city centres have too many shops
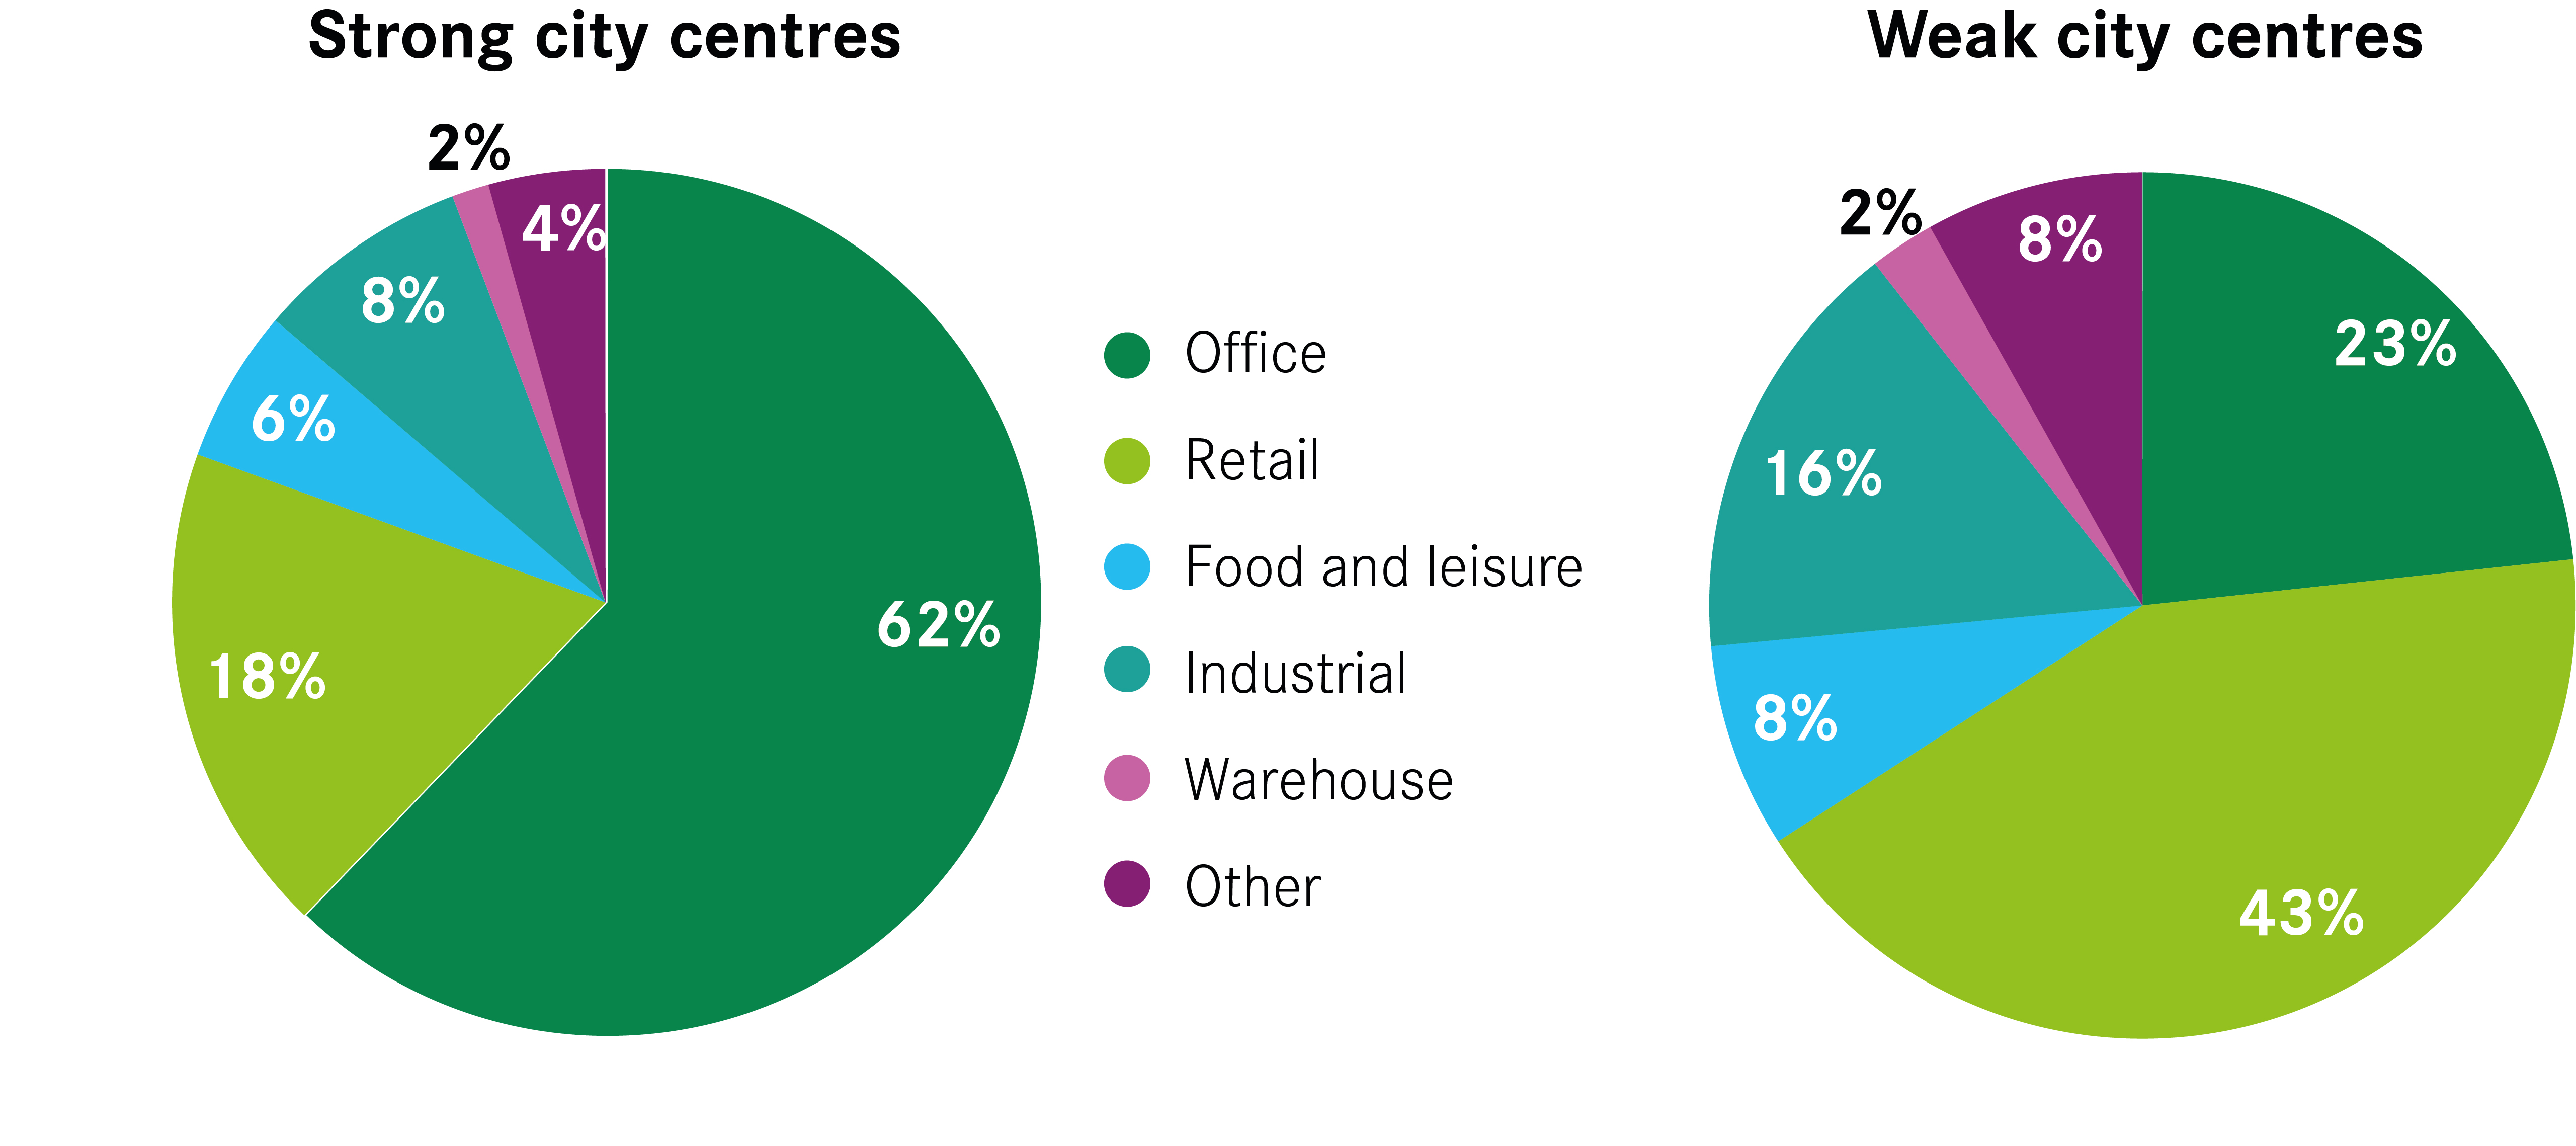
Despite the better performance of retail in strong city centres, shops account for a much smaller share of commercial space than in weak city centres. In strong city centres, 62 per cent of all commercial space is occupied by offices, as Figure 10 shows. This is almost three times as much as the share of space given over to offices in weak city centres.
In contrast, retail space is much more dominant within weak city centres than strong ones, accounting for 43 per cent of floor space compared to 18 per cent, as shown in Figure 10. This means that the ratio of office to retail space changes dramatically between these different types of city centre economy. For every square metre of retail space, there are 3.4 square metres of office space in city centres like London and Bristol. In weaker city centres like Doncaster and Sunderland, for every square metre of retail, there is only half a square metre of office space.
The dominance of retail leaves weak city centres particularly exposed to the struggles of high street retailers and the likelihood of store closures. But the national story about retail’s troubles ignores how some cities will be hit more than others. Not only do current retail vacancies already show their city centres are struggling, but ongoing structural changes in retail leave them vulnerable, considering how much of their city centre is given over to shops. They currently do not have the demand to sustain all their retail units, and this is only likely to worsen.
Figure 10: Composition of commercial floorspace in different types of city centre, 2017
Office quality varies across city centres too
As with retail, the quality as well as quantity of office space is important. Not only do more successful city centres have a higher share of commercial space given over to offices, but the quality of that office stock tends to be higher too (see Figure 11).
The amount and quality of office space in weak city centres are likely to represent the lack of investment in their office market in recent decades. The low rents these offices command (due to low business demand and poor quality) rule out speculative development by the private sector. This has meant the ability of the commercial property market to improve the office sector has been very limited in such city centres. In contrast, the higher demand for office space in more successful centres has led to an expansion of office supply to accommodate the growth shown earlier in Figure 1. These new developments have tended to be higher quality, helping to reinforce the attractiveness of these city centres to high-skilled exporting businesses.
This poses a particular challenge in weaker city centres. While the quality of office stock is not the only reason they struggle to attract in businesses, it is no doubt a factor. But with rental values well below the level required for private sector development, the public sector will need to de-risk investment by addressing the oversupply of retail and bringing forward new office space if the make-up of commercial space in their city centres is to change.
Figure 11: Office stock quality and quantity by city centre, 2017

Box 4: Energy Performance Certificate Data
Energy Performance Certificates (EPCs) grade commercial property on their energy efficiency and these grades can be used as a proxy for buildings that have been built or refurbished recently. Using the Non-Domestic Energy Performance Register, the number of offices that are high quality in city centres can be estimated by looking at properties with EPCs A, B and C. These are the most energy-efficient buildings in the B1 building class and are presumably the newest and therefore highest quality office space.
Unfortunately, EPC data is more limited than the VOA data. Most notably, it grades the entire building (so, for example, the entire floor space of Wakefield One, the council headquarters, library, and museum, is counted as an office building when only a small amount is let out for commercial use). Also, the B1 building class combines office buildings with workshops which tend to have larger floorplates while not existing in the same market as conventional office space. As a result, the office quality data in Figure 11 looks at units rather than floorplates as a whole, unlike the rest of the report.
Permitted Development Rights pose a risk to the ongoing growth of city centre economies
The challenge for stronger city centres comes not from the lack of demand to build new space, but from the competing demands to use space for commercial and residential purposes. Strong growth in demand from both business and residents within the small areas of land covered by city centres means that decisions are required as to how to allocate land.
This has been made more difficult by the introduction of new Permitted Development Rights (PDR) in 2013, within which the requirement for planning permission to convert certain types of commercial space into residential (but not the conversion of residential to commercial) was removed.
One of the aims was to help struggling high streets by making it easier to convert empty offices into homes. The problem with this approach is that there is little demand to live in struggling city centres, as shown above, because they struggle to offer the benefits that people look for from city centre living. This means that this policy has little impact in these areas. Between 2014 and 2017, there were just six conversions across the whole of Barnsley (not just the city centre), while in Blackburn only one took place.
Instead, PDR has impacted successful city centres where there are competing demands for both commercial and residential space. For example, part of Manchester city centre is exempted from PDR, but it’s interesting to note that a number of conversions have occurred on the fringe of this zone elsewhere in Manchester city centre.8 Meanwhile, much of central London has been fully exempted to stop any conversions.
Not only does PDR have the potential to squeeze the amount of commercial space available – a key ingredient in the rebirth of a number of city centres – but it does so without taking spatial planning into account. Individual developers are able to convert specific properties without due consideration to the wider balance of commercial and residential space in a city centre.
Making sure that buildings remain relevant to the economy and continue to serve a purpose is a good thing. This is why allowing conversions through PDR in suburbs, which have seen shifts in the demand for land use within them in recent decades, is on balance a good thing. But given the changing role of city centres in the national economy, any conversions undertaken should be done in the context of a wider strategy for the city centre. All cities that would like one should be allowed to exempt their city centres from PDR, if they would like to.