
01Covid and levelling up
Just over a year ago, the Government was elected on a promise to ‘level up’ the economy. Government agendas are frequently derailed, but few have faced disruption on the scale of the pandemic. To make matters worse, Covid and the economic impact of associated restrictions have disproportionately affected the UK’s largest urban areas, the places that are most likely to deliver on levelling up.
Levelling up should be about reducing the inequalities between different parts of the UK by supporting places outside London and the South East to be more successful economically. It should also aim to reduce the inequalities that exist between people within more successful places by making sure more people can take up the opportunities available to them.
While not perfect, the only indicator that captures both the emerging picture and the likely effect on inequalities within and between places is the claimant count. Centre for Cities’ analysis has shown that claimant count tends to fluctuate in line with more lagged indicators of prosperity, such as those for productivity, income and employment.
Each month, the claimant count measures the number of people claiming benefits primarily for the reason of being unemployed. It is the most timely and reliable means currently available to understand the economic impact of the pandemic on local labour markets (see Box 1).
This chapter analyses claimant count data to set out the size of the levelling- up challenge going into the pandemic, the Covid-recovery challenge, how they overlap and what needs to change as a result.
Box 1: Methodology: who is included in the claimant count?
According to the Office for National Statistics, the claimant count is: “a measure of the number of people claiming benefits principally for the reason of being unemployed, based on administrative data from the benefits system.”6 It is an experimental statistic that combines the number of people claiming Jobseeker’s Allowance with those who are claiming Universal Credit and are required to seek work and to be available to work (the ‘work component’).
The claimant count is not an official measure of unemployment. Not all people who are unemployed are eligible to claim these benefits and therefore the claimant count only represents a subset of the whole group of people who are unemployed.
In addition, some people are not classified as unemployed but would nevertheless like to be in work. They are normally classified as economically inactive and therefore do not appear in the unemployment statistics but can be thought of as hidden from unemployment counts. Previous work by Centre for Cities and the OECD produced estimates of this ‘hidden unemployment’ around the country.7 Up-to-date figures on economic inactivity during the pandemic are not yet available.
At the same time, the criteria for the work component of Universal Credit mean that some people may be eligible because they have a low income from work rather than being unemployed. Also, changes to Universal Credit as part of the Government’s response to Covid mean that the number of people who are working and eligible is currently higher than it would have been under previous rules.8
Nevertheless, the claimant count is the only near real-time measure available to assess what is happening on the ground in different local labour markets. It is timelier and more accurate than other official measures of unemployment at the local level, such as the Annual Population Survey.
Box 2: Defining cities
The analysis undertaken in this report compares Primary Urban Areas (PUAs) — a measure of the built-up areas of a city, rather than individual local authority districts or combined authorities. A PUA is the city-level definition first used in the Department for Communities and Local Government’s State of the Cities report. The definition was created by Newcastle University and updated in 2016 to reflect changes from the 2011 Census.
The PUA provides a consistent measure to compare concentrations of economic activity across the UK. This makes PUAs distinct from city-region or Combined Authority geographies. You can find the full definitions table at centreforcities.org/city-by-city/puas.
Before the pandemic, the UK’s north-south divide was unmistakable
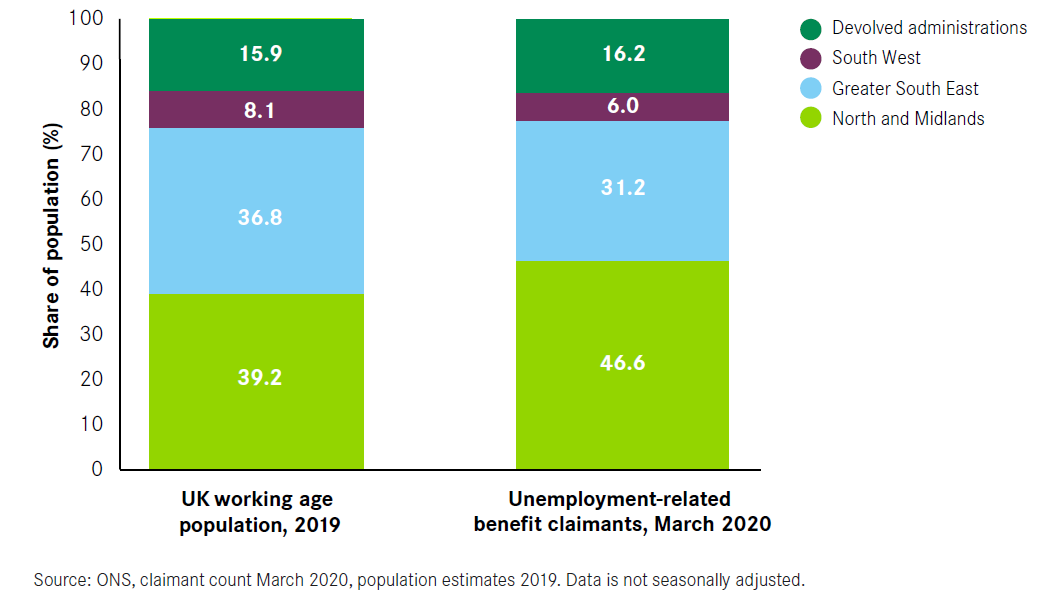
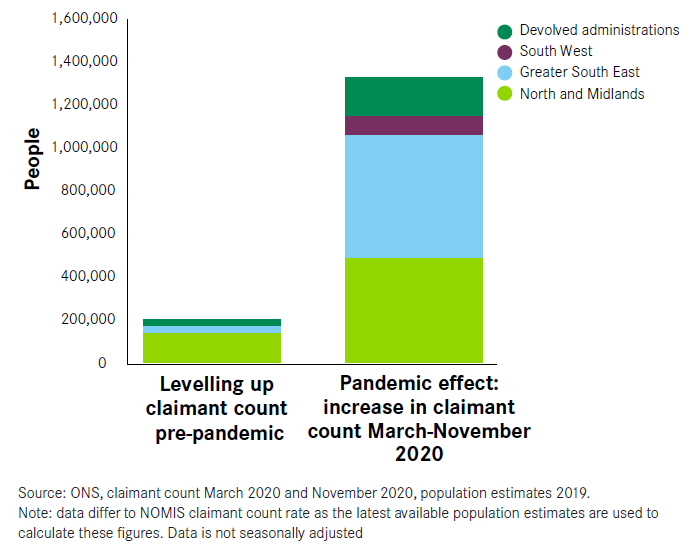
Before the pandemic, there were stark inequalities in job opportunities across the country.9 In March 2020, approximately 1.3 million people in the UK were claiming benefits primarily for the reason of being unemployed. That is equivalent to 3 per cent of the working age population. While this was one of the lowest levels since the new benefit system was introduced in 2013, it hid significant local variations.
People claiming unemployment-related benefits were much more likely to live in the North and Midlands (see Figure 5). Of all the people claiming these benefits in the UK in March 2020, 47 per cent lived in the North and Midlands, despite these areas having only 39 per cent of the UK’s working age population. In contrast, only 31 per cent of benefit claimants lived in the Greater South East of England (a region comprising London, the South East and the East), where 37 per cent of the UK’s working age population live. The claimant count rate in Hull, Birmingham and Blackpool was more than four times higher than in Aldershot and Cambridge.
Figure 5: People claiming unemployment-related benefits were much more likely to live in the North and Midlands
Cities made up 80 per cent of the pre-pandemic levelling-up task
Reducing the claimant count rate of these weaker performing parts of the country to the national average would be a big step towards achieving a more levelled-up Britain. It would mean more people were in work and that more people in lower-paid jobs were earning more from work.
Looking at the task of levelling up in this way – reducing the claimant count to the national average – allows for an assessment in each place of the size of the challenge as it existed before the pandemic.
Back in March, this would have meant finding jobs for at least 200,000 people nationwide. This includes finding jobs for all the people currently out of work and being paid unemployment-related benefits as well as improving job opportunities for the people who are already in work but receiving the work component of Universal Credit.
And, as explained in Box 1, the claimant count captures only part of the overall challenge – including all people who are unemployed and those in ‘hidden unemployment’ would undoubtedly give a much larger figure.
On this basis, before the pandemic, four-fifths of the task of levelling up was in cities and large towns. Some 36 cities and large towns – 25 of which are located in the North and Midlands – had an above average claimant count rate in March 2020. Bringing them in line with the national average would have meant almost 170,000 fewer people claiming unemployment-related benefits. This is illustrated in Figure 6 where dark green bars show how far above the national average for claimant count each place was.
Figure 6: To level up pre-Covid, the claimant count rate of the weaker performing parts of the UK needed to be brought in line with the national average
Claimant count rate, March 2020
Of the 200,000 people that needed to find jobs across the UK, almost 80,000 lived in just four places: Birmingham, Manchester, Glasgow and Newcastle.
Addressing the shortfall in these four cities alone would have dealt with 40 per cent of the overall levelling-up challenge.
The economic impact of the pandemic has not followed traditional north-south patterns
Covid has left no corner of the UK unaffected. The pandemic and the economic impact of associated restrictions have meant the number of people claiming unemployment-related benefits has dramatically increased everywhere since March 2020.
Some 2.6 million people are now claiming either Job Seeker’s Allowance or the work component of Universal Credit. That is equivalent to 6.3 per cent of the UK’s working age population, an increase of 1.3 million people in just eight months.
If the long-term levelling-up task is predominantly a challenge for the North and Midlands, the same cannot be said about dealing with the economic impact of the pandemic. Covid has created a new challenge in the South and added significantly to the scale of the existing challenge in the North and Midlands – meaning that, as of November 2020 (the latest month for which data is available), the north-south divide on claimant count is less clear cut (see Figure 7).
Figure 7: The north-south divide is no longer so clear cut
Claimant count rate, March and November 2020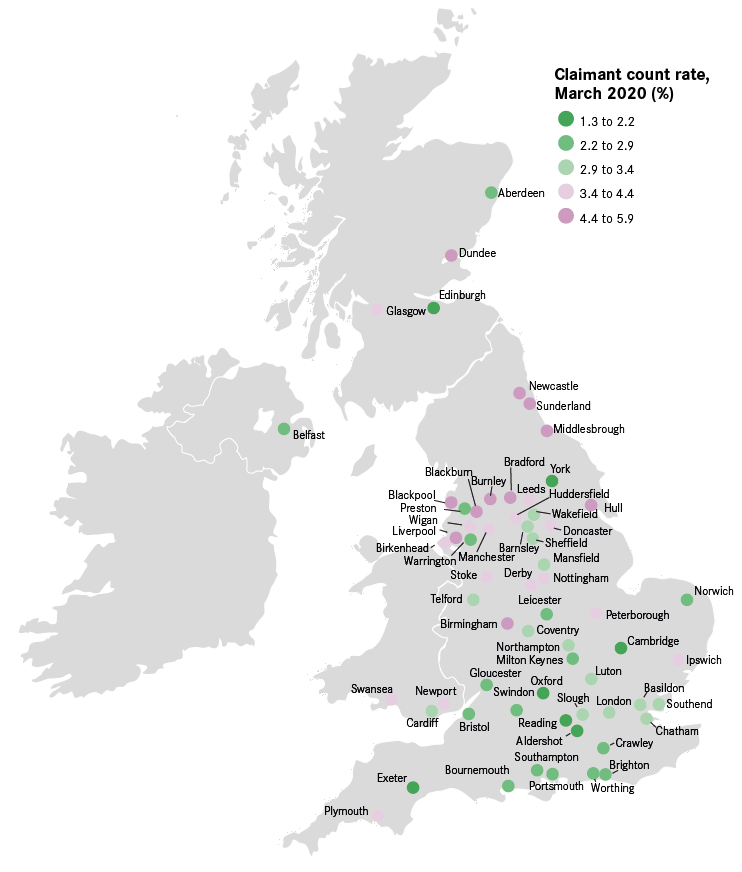

In the areas needing levelling up before the pandemic, the challenge is much bigger
In the places that already had an above average claimant count in March, the situation is now five times more challenging (see Figure 8). An additional 740,000 people in these areas are now claiming unemployment-related benefits, bringing the total number of people that would need to find or improve their job situation to level up the UK to just below one million.
Focusing specifically on areas outside the Greater South East, where levelling up was a big challenge before the pandemic, the task would now be four times bigger. Indeed, over two-thirds of all the people that would need to find jobs to level up the UK, approximately 630,000 people, live in these areas outside the Greater South East of England.
Figure 8: Covid has made the levelling-up challenge much bigger
People claiming unemployment related benefits that would need to find or improve their job opportunities to level up the economically weaker parts of the UK
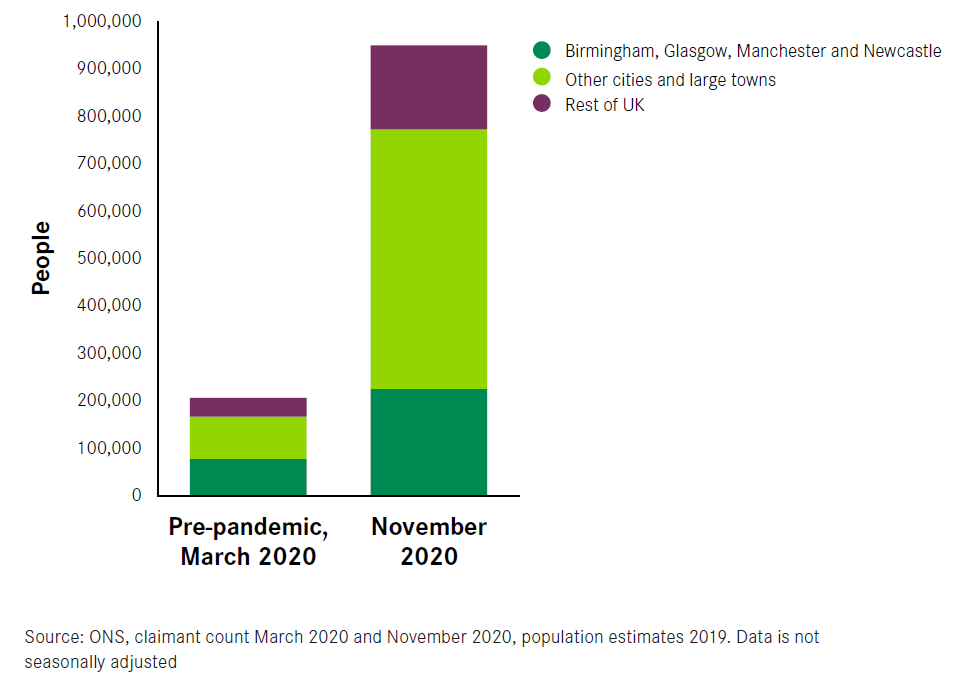
Cities and large towns continue to account for 80 per cent of this bigger challenge (see Figure 8). The 36 cities and large towns with an above-average claimant count rate before the pandemic have seen a combined increase of 600,000 people claiming unemployment-related benefits since March. While roughly 80,000 residents of Birmingham, Glasgow, Newcastle, and Manchester needed to find a job or a higher-paying job to bring the claimant count down to the national average before the pandemic, that figure has now risen to over 200,000 people.
If the end of furlough leads to unemployment, the task is even bigger
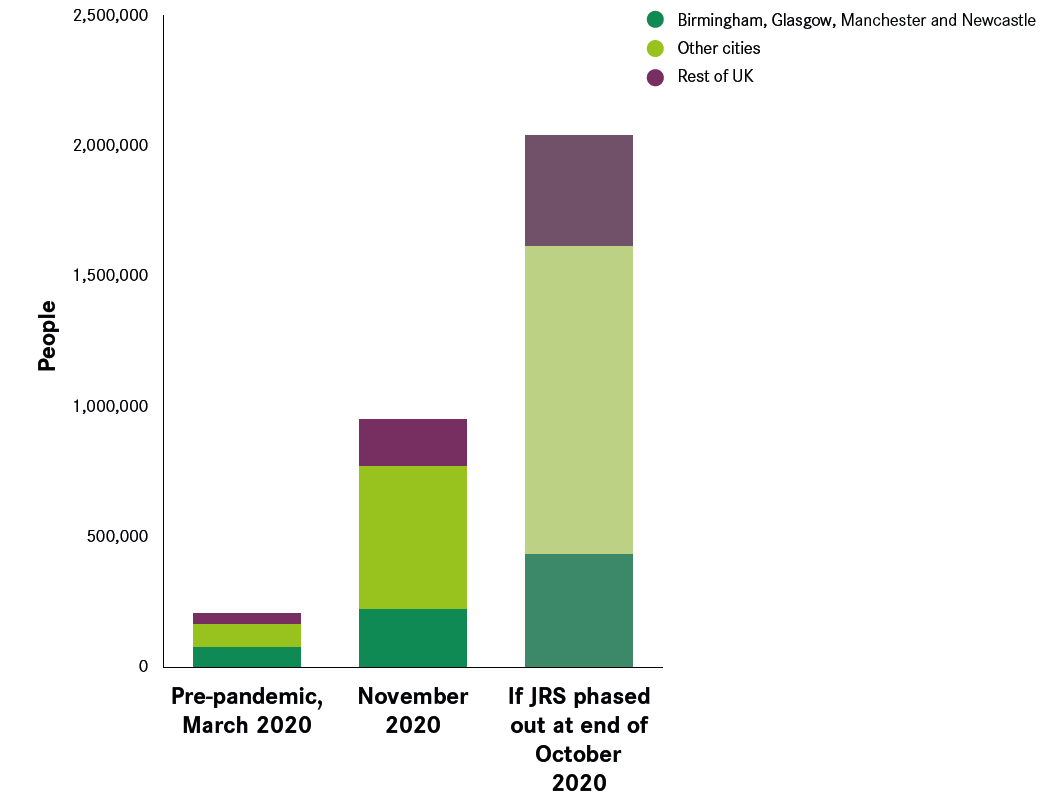
These increases would have been even higher had the Government not introduced its support schemes. Over 9.6 million workers – approximately 30 per cent of those eligible – have benefitted from the Coronavirus Job Retention Scheme (CJRS), better known as ‘furlough’, for at least a three-week period since the beginning of the first national lockdown, and a further 2.7 million have applied for support through the Self-Employment Income Support Scheme.10 Of these, some 2.4 million workers, or approximately 8 per cent of those eligible, were still reliant on the CJRS at the end of October 2020 – the original date for its phase out. This would suggest that an additional 2.4 million workers would have been at real risk of losing their jobs had the Chancellor not extended support until April 2021. Assuming a worst-case scenario in which all those people still on the CJRS at the end of October lost their job, levelling up for those places with above average benefits claims before the pandemic would be 10 times more
challenging than in March 2020. More than two million people would need to find work.
Focusing specifically on the areas in need of levelling up outside the Greater South East would make the challenge slightly smaller but still eight times greater than before the pandemic. This is because, as outlined above and further explained in the next section, some areas of southern England have been particularly hard hit by the pandemic, even more so than areas elsewhere
in the UK with weaker performance before the pandemic. Once again, 80 per cent of these people live in cities and large towns (see Figure 9). And in Birmingham, Glasgow, Manchester and Newcastle the total number of people in need of support would be close to half a million.
Box 3: The interaction between the Coronavirus Job Retention Scheme and the claimant count
As discussed in Box 1, some of the people in receipt of unemployment- related benefits are working. This is because they are working fewer hours or have earnings below a set threshold meaning they still qualify for the work component of Universal Credit.
By covering 80 per cent of the salary of people currently in work, the CJRS provides support during the pandemic for many workers, but a 20 per cent reduction in earnings can mean that people also become eligible for Universal Credit. In these instances, people may appear both in the claimant count statistics and in the CJRS figures. At the moment, there is no way to determine the size of this group.
Figure 9: Without the furlough scheme the levelling-up challenge could be 10 times larger
People claiming unemployment-related benefits or on the CJRS at the end of October that would need to find or improve their job situation to level up the economically weaker performing parts of the UK
The extension of the CJRS until April 2021 has so far prevented this from happening, but unemployment is still predicted to rise once support is phased out in the spring.11 The extent to which it will increase will ultimately depend on the future trajectory of the pandemic, the ongoing restrictions needed to deal with it and the economic support provided by the Government.
The pandemic has created new problems in otherwise strongly performing places
In addition to making levelling up more challenging, the pandemic has led to an unprecedented rise in the number of people claiming unemployment-related benefits in some otherwise economically successful cities and large towns.
London and the Greater South East of England appear to be among the areas hardest hit. Despite having 37 per cent of the UK’s population and 31 per cent of unemployment-related benefits claims before the pandemic, these areas account for almost half (43 per cent) the increase in the claimant count since March 2020. While levelling up is predominantly a North and Midlands challenge, Covid has left no corner of the UK unaffected, and in terms of claimant count it is predominantly a Greater South East challenge (see Figure 10 and Box 4).
Figure 10: Levelling up is a North and Midlands challenge while Covid has affected every place
Comparison and distribution of the levelling-up and pandemic challenges across the UK
Box 4: The impact of Covid in London’s PUA
The uneven effect of the pandemic is not only visible between cities, but within cities too.
London is one of the places hardest hit by Covid and some of its boroughs have been particularly badly affected. When looking at the claimant count rate by local authorities across the UK, nine of the 10 local authorities with the highest percentage point increase since March 2020 are within the capital.
These include Newham, Haringey and Brent, with percentage point increases in claimant count of 7.2, 7.2 and 7.0 respectively. In contrast, the City of London, Elmbridge, and Epsom and Ewell are much lower down towards the middle of the ranking, with percentage point increases in claimant count of 2.4, 3.0 and 3.3 respectively.
Figure 11: The uneven effects of the pandemic are also visible within cities
Percentage point change in claimant count rate since March in London

How the Covid and levelling-up challenges interact
As a result, Figure 12 shows that, among the UK’s 63 largest cities and towns, the places hardest hit by the pandemic are a mix of stronger local economies (top left quadrant) and areas with weaker local economies that were in need of levelling up before the pandemic (top right quadrant). Despite their past strong economic performance, Slough, Crawley and London are now together with weaker economies such as Birmingham and Bradford in the top 10 places hardest hit economically by Covid.
Figure 12: Even economically strong places before the pandemic have been hard hit by Covid
The relationship between the levelling-up challenge and the pandemic
challenge in the UK largest cities and towns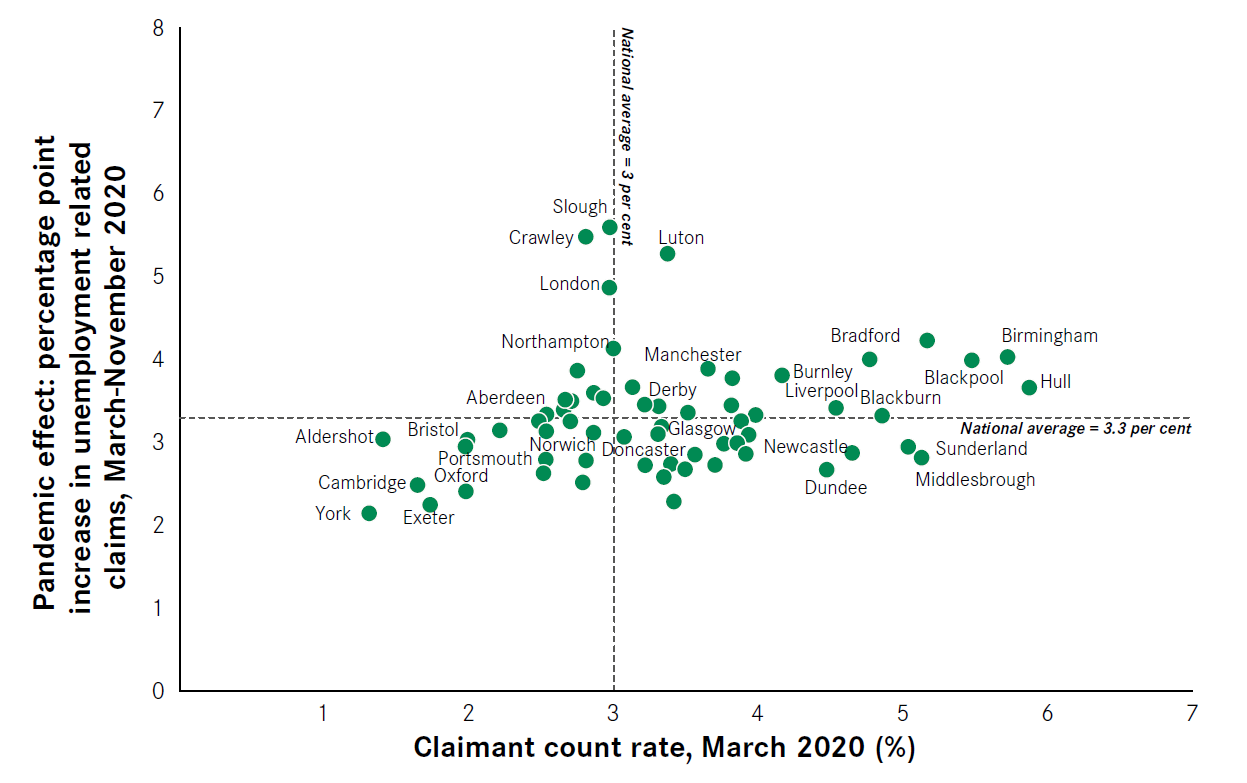
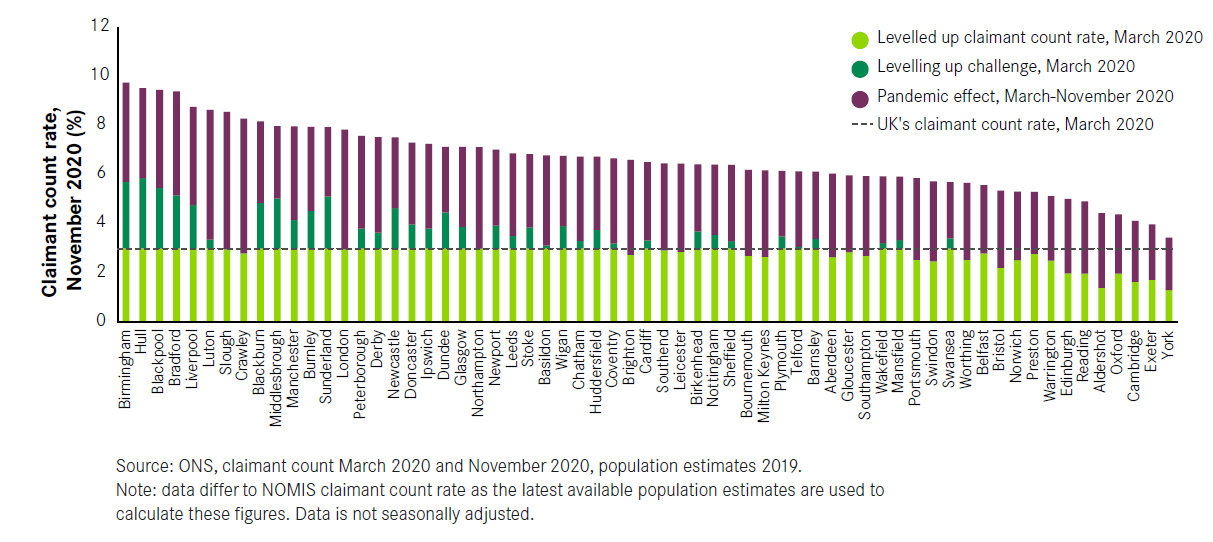
The widespread geographic impact of the pandemic has blurred the north- south divide in claimant count (see Figure 13). The top 10 places with the highest claimant count rate in November 2020 are no longer the same as the top 10 places in March (Figure 6). Cities and large towns no longer have a claimant count rate based solely on their levelling-up challenge – represented by the dark green bars in the figure – rather, some of the strongly performing places before the pandemic now appear to have the biggest challenges ahead, because of the large effect Covid has had on their economies.
In contrast, some of the places that did need to level up pre-pandemic such as Swansea, Plymouth and Mansfield are now much lower down in the ranking, well below the new, higher national average. Their task has in no way diminished, but it is now smaller in comparison to other places that have been much more adversely affected by the pandemic.
Figure 13: In some strong economies the scale of the challenge is now similar to that of places in need of levelling up
Claimant count rate, November 2020
Levelling up is a decades-long challenge, Covid recovery may not be
In absolute terms, the challenge of recovering from Covid appears to be much bigger than the initial, pre-pandemic task of levelling up. But it is not just the quantity of jobs lost that will determine the ability of places to bounce back.
The main reason why parts of the country needed to level up before the pandemic was because they lacked the exporting base that characterises strong economies.
Broadly speaking, it is possible to split jobs in two categories: those in exporting businesses and those in local services. The first category, which includes manufacturing, financial and professional services businesses, drive a place’s growth because they trade in regional, national and international markets and bring money into the local economy. This in turn creates demand for the second category, the local services businesses, such as those on the high street where people spend their money – shops, restaurants and hairdressers.
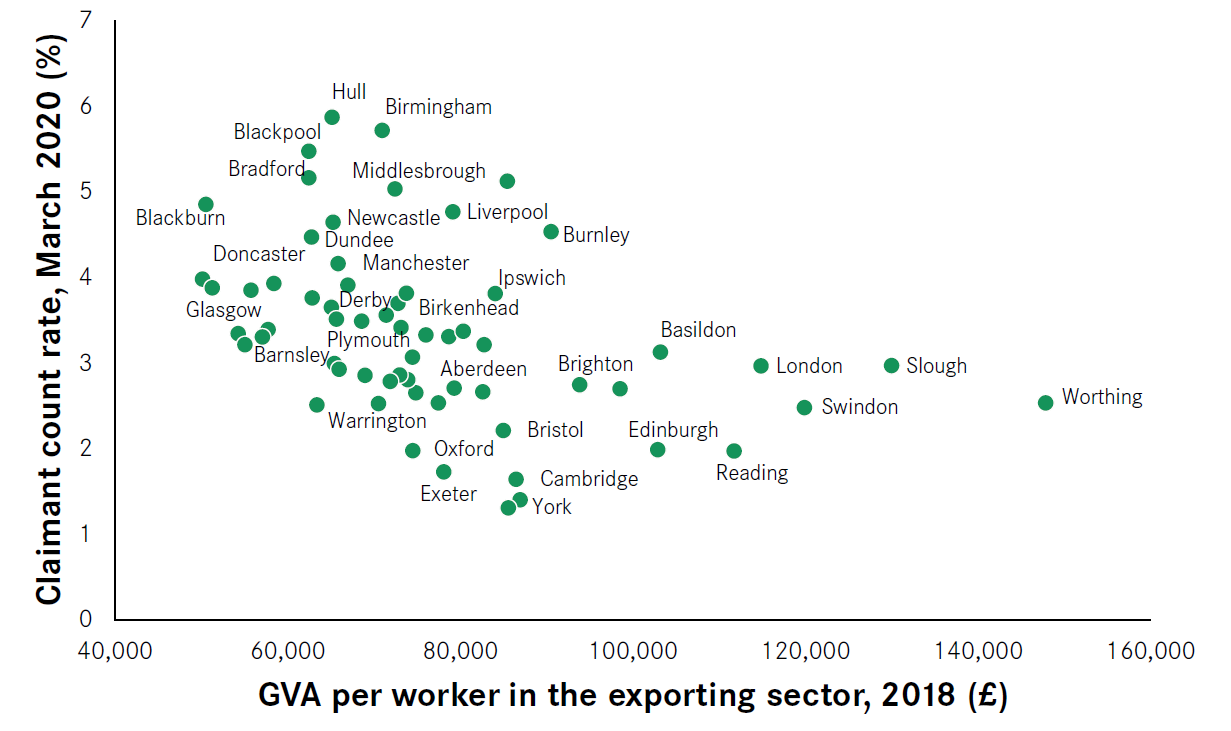
The more exporting jobs a place has, and the more productive these exporting jobs are, the more vibrant is its local labour market, with more job opportunities and consequently fewer people in need of unemployment-related benefits (see Figure 14). Places like London, Reading, Brighton or Cambridge have more exporting jobs, while places that needed to level up before the pandemic like Middlesbrough, Blackpool and Birmingham have a weaker exporting base and consequently fewer higher-paying employment opportunities. As Figure 14 shows, pre- pandemic this was reflected in a higher claimant count rate in those places.
Figure 14: To truly level up, places need stronger performing exporting sectors
The relationship between productivity of the exporting sector and the claimant count pre-pandemic
While ‘levelling up’ itself is a recent term, government efforts to improve the economic performance of areas outside the Greater South East go back decades. Over the past century, successive governments have introduced a range of policies aimed at levelling up opportunities in the North of England – from the 1934 Special Areas Act12 to the more recent Regional Growth Fund and Industrial Strategy – but, rather than focusing on broadening the exporting base of these places, they have focused on replicating their existing economies. The result has been little improvement for the people living in these areas.
Increasing economic prosperity in places that are struggling is a decades-long challenge that requires interventions on multiple fronts. To strengthen their export base, places need to attract more high-value businesses to their area and to do this they – and national government – need a set of policies aimed at improving the skills local people have to offer, stimulating innovation, providing adequate office space and improving transport connections within their areas.13
Unlike levelling up, bouncing back from Covid is likely to be a shorter-term challenge for many places
Coming back from Covid is different from the levelling-up challenge, as most of its economic impact has been on local services and on a few specific exporting sectors. Local services are found wherever there are people to sell to and so they are spread out fairly evenly across the country. That means places have generally been affected in proportion to the size of their economies.
Covid has had a larger but shorter-lived effect on most exporting sectors than the last economic crisis. During the first national lockdown the Gross Domestic Product (GDP) of exporting sectors fell much more sharply than in the 2008 financial crisis. But unlike the last recession, GDP bounced back quickly. While ongoing restrictions may slow the pace of this recovery, it is likely that they will recover much more quickly than the more drawn-out recovery just over a decade ago.
The drop in local services’ output has been more dramatic, especially for food and accommodation and arts and entertainment – sectors most typically found on high streets and most affected by Covid restrictions (see Figure 15). But, given the likely stronger performance of the export sectors and ongoing government support from the furlough scheme, underlying demand for these sectors is likely to be strong when these restrictions are finally lifted. This suggests that, Brexit impacts notwithstanding, the economy should bounce back much more quickly than it did from the previous recession.
Figure 15: Covid has hit local services jobs, especially those on the high street, harder than the financial crisis
Impact of GDP on export and local services during the financial crisis and Covid

While this holds at the national level, the ability of a place to bounce back depends on how exposed its export sector has been to the crisis. Data is not available to look at this issue directly, but figures from the CJRS combined with estimates on home working provide some insights.
Given that local services businesses are present in every local economy, and that they are all subject to similar restrictions and offered the same support, it is reasonable to assume a baseline level of people still on the furlough scheme at the end of October 2020 were employed in local services. If places had a take-up rate at or below this baseline, it would suggest that it was mostly local services activities that have been affected by the pandemic. In addition, the shift to working from home means that many local services businesses in the centres of big cities continue to suffer from the absence of office workers. For places like London and Manchester, it is likely that an above average number of people employed in local services were still on the furlough scheme at the end of October, due to the lack of demand from city centre office workers pushing the number of furloughed jobs in these sectors above the baseline.
Setting this baseline at 7.1 per cent for October 2020,14 Figure 13 shows that 26 cities had a furlough take-up rate above this threshold. This suggests that, for the majority of places, their export base has not been adversely affected by the pandemic and that, once restrictions are removed, local services should be well placed to bounce back relatively quickly. Of the 26 places above the baseline, nine cities (such as Manchester, Edinburgh and Brighton in the top right corner of Figure 16) have above average levels of home working. It is likely that their higher rates of home working in part explain higher rates of furloughing of local services jobs in their respective city centres. And overall, as expressed by the colour, they have lower levels of claimant count than other cities and large towns, suggesting that these places too are well placed to bounce back once office workers return.15
Figure 16: In most places, Covid has mostly affected local services, but for some it has had a negative effect on their exporting base
Ability to work from home and take-up rate for the CJRS as of the end of October 2020
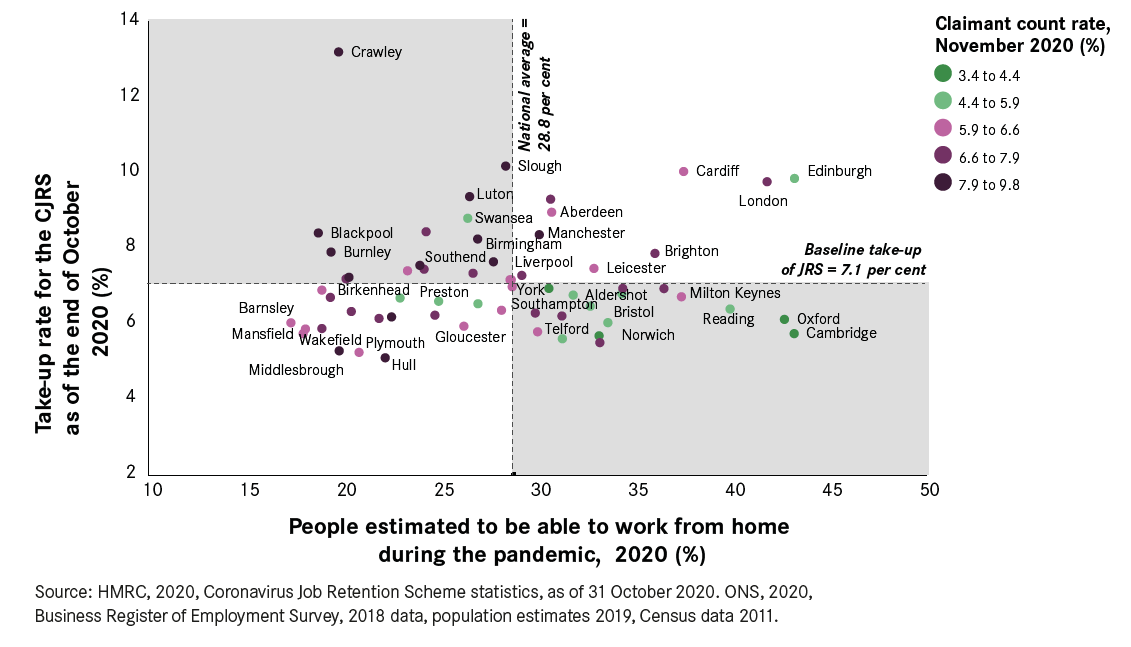
The situation is not so positive for the remaining 17 cities and large towns with a take-up of CJRS above the baseline but with fewer than average people working from home (see top left quadrant in Figure 16). While for some places, like Scottish and Welsh cities in this category, this may be due to further restrictions introduced to fight the virus in October, the data overall suggests that in places in this group the exporting base has been significantly affected as fewer people can work from home and the claimant count rate is higher.
This group includes Crawley and Slough, where the collapse of the international travel industry is having a large effect on the exporting bases of both towns.
In these places, the flow of money coming into the economy has been negatively affected by the pandemic. As such, even when restrictions are completely lifted, given the uncertainty of the speed and strength of recovery of the airline industry, returning to normal will require not just the lifting of restrictions on local services businesses, but repairing their export base too.
What does this mean for cities and large towns?
Bringing together insights from the levelling-up challenge and Covid, it is possible to group cities in five different categories based on the economic challenges they will face after the pandemic (see Figure 17).
Of the 36 cities and large towns that went into the pandemic in need of levelling up, 15 are likely to find economic recovery from Covid particularly difficult, as the pandemic further undermined their already weak economic performance.
For the remaining 21 cities in this group, the data suggests that they are better placed to come back. But their longer-term challenge is that even a full recovery to where they were before the pandemic will return them only to a position of relatively weak economic performance, something which levelling- up policies will need to tackle.
The cities and large towns that entered the pandemic in a stronger economic position can be split into two categories based on how they have been affected by Covid.
For a minority of cities and large towns with a strong economy, Covid has had a strong negative effect on their economy. The pandemic has either affected a larger share of their local services businesses or their exporting base, meaning they will find it harder than other strong economies to bounce back from the pandemic. That said, their strong economic performance entering the pandemic means they are in a better position to recover faster than places who entered the pandemic with weaker economic performance.
For the remaining cities and large towns with a strong economy, Covid is likely to have only a short-term effect on their economies, given that the economic impact was felt mostly in their local services businesses and the impacts were relatively small compared to other places.
Figure 17: Different places need different policy responses
Summary table of the challenges affecting different groups of cities and large towns
Details of challenge |
Cities and large towns |
|
| Levelling- up + Covid challenges | In need of levelling up pre- pandemic and export base further affected by Covid. | Basildon, Birmingham, Blackburn, Blackpool, Bradford, Burnley, Cardiff, Dundee, Glasgow, Huddersfield, Liverpool, Luton, Newport, Sheffield and Swansea. |
| Levelling-up challenge | In need of levelling up pre- pandemic but export base relatively sheltered from Covid. | Barnsley, Birkenhead, Chatham, Coventry, Derby, Doncaster, Hull, Ipswich, Leeds, Manchester, Mansfield, Middlesbrough, Newcastle, Nottingham, Peterborough, Plymouth, Stoke, Sunderland, Telford, Wakefield and Wigan. |
| Covid challenge | Strong economies hard hit by Covid. | Aberdeen, Bournemouth, Brighton, Crawley, Edinburgh, Leicester, London, Slough and Southend. |
| Strong economies | Strong economies who have only been marginally affected by Covid. | Aldershot, Bristol, Cambridge, Exeter, Gloucester, Milton Keynes, Northampton, Norwich, Oxford, Portsmouth, Preston, Reading, Southampton, Swindon, Warrington, Worthing and York. |
Note: Belfast not included in this list as estimates of the share of workers able to work from home are not available.
Figure 18: Different places need different policy responses
Summary map of the challenges affecting different groups of cities and large towns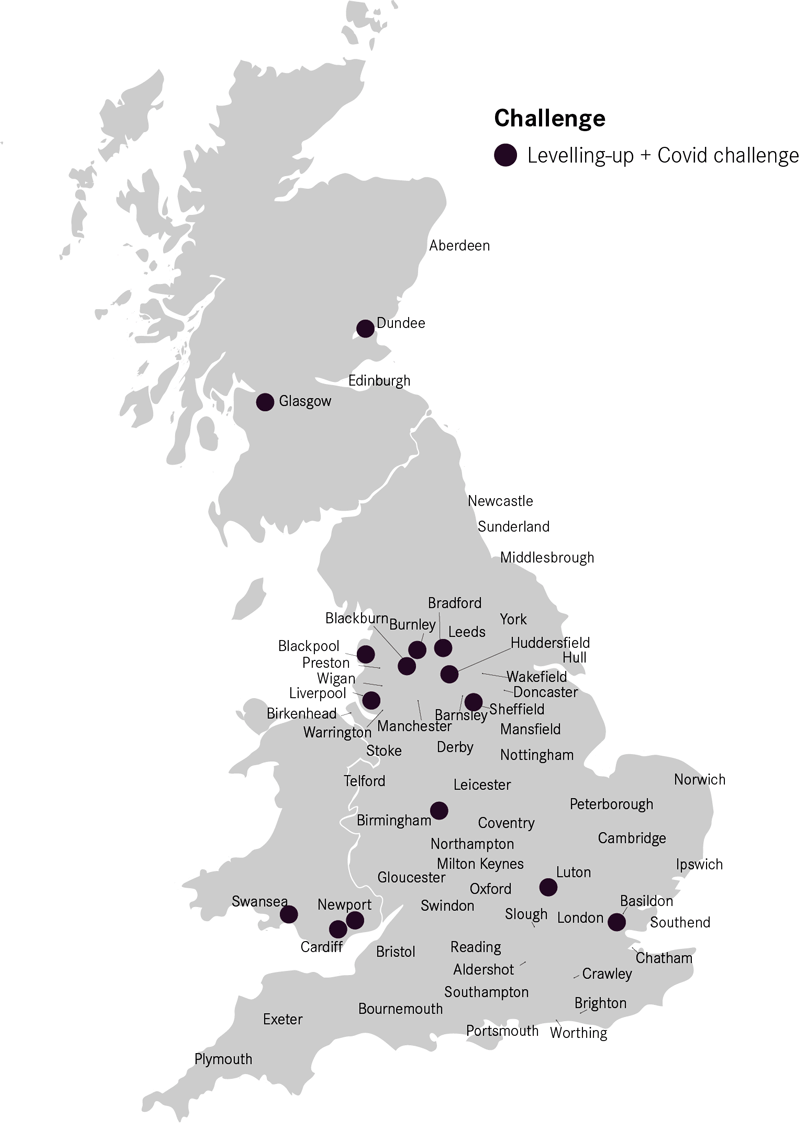
What needs to change
The labour market in January 2021 differs dramatically to a year ago. In addition to the historically stark inequalities between different parts of the country, the pandemic has worsened opportunities in every corner of the UK. And that is before the economic impacts of Brexit, which are likely to further affect the prospects for those places already struggling.16
While vaccines offer hope for recovery from Covid, there is no comparable ‘shot in the arm’ for levelling up. It requires long-term, substantial interventions. This spring, the Government should put local government on a strong, sustainable financial footing, ready for the task ahead, and address both the challenges identified in this research in a new Economic Recovery Strategy.
It should have a mix of short-term and long-term policies, that can be tailored to different local needs.
The Government should support places to bounce back from Covid by:
1. Boosting Universal Credit: As people are made redundant and lose income they cut their spending, reducing even further the amount of money circulating in local economies. This has a knock-on negative effect for the economy, putting even more jobs at risk. To minimise this, the Government should make permanent the temporary £20 uplift to Universal Credit and consider increasing it to be in line with other welfare states in Europe.
2. Supporting workers until social restrictions are lifted: The CJRS has been crucial in supporting workers since March 2020, preventing even higher rises in unemployment and ensuring money kept circulating in the economy. As such, as long as lockdowns and other forms of social distancing restrictions such as the tier system continue to be in place, the Government should continue to offer the current furlough scheme to workers.
3. Supporting people who have lost their job to retrain: The complete shutdown of certain sectors of the economy makes it even more difficult for the people who have lost their job to find new opportunities. While it is welcome to see that the recently introduced Life Skills Guarantee
offers a free college course for anyone without A-levels or equivalent qualifications, the Government should extend this initiative and offer free courses to anyone who has lost their job in the past year, even those who already have A-level or equivalent qualifications.
4. Consider a ‘Spend out to help out’ voucher: Once the vaccine is rolled out, social restrictions lifted and the economy reopens, the Government will need to consider whether additional support is needed to encourage people to go out and spend. If required this could build on the ‘Eat out to help out’ scheme from last summer and offer each adult a ‘Spend out to help out’ voucher of £100 to be used on the high street.
The Government should deliver on levelling up, by:
1. Investing in skills: To level up, economically weaker parts of the country need to become more attractive to high-productivity businesses. The single most important change that can help them achieve this goal is investing in the skills of the people currently living in their local area, in particular those currently without any formal qualifications. To do so, the Government should boost investment in further education and set out how it will stimulate take-up among adults.
2. Creating jobs: While improving skills can open up more opportunities for people, for them to fully utilise their skills in their local area there needs to be adequate The Government should press ahead on supporting the creation of jobs in the green economy, for example via retrofitting homes. In addition, the Government should look at supporting the creation of more jobs in sectors of high demand such as social care and education, which are spread across the country.
3. Improving city centres: Alongside these jobs, cities and large towns in need of levelling up need more high-skilled, well-paid jobs and high- productivity businesses. Notwithstanding the pandemic, these types of jobs and businesses tend to locate in city As such Government should support cities and large towns that need to level up to improve their city centres’ offer post-Covid by creating a City Centre Productivity Fund for places to access.
4. Investing in transport: Congestion is increasingly a barrier to further growth in the largest cities outside London. As previous work by Centre for Cities has found, improving investment in the transport infrastructure of these places would help create job opportunities in the short term and tackle congestion and pollution challenges and stimulate economic growth in the longer-term. This will require both investment from national government and action from local government, such as the introduction of congestion charges in city centres.
5. Investing in innovation: Innovation plays a central role in the creation of strong The Government has signalled that it is to increase spending on R&D outside of the Greater South East – in 2021 it should set out exactly how it is going to do this, and what results it expects to achieve.
6. Pressing ahead with devolution: Ultimately, each place has its own specific challenges which are best addressed at the local level. As such, the Government should press ahead with devolution, hand powers related to economic growth to local areas and give them the opportunity to raise their own taxes.