
01Holding our breath — How poor air quality blights cities
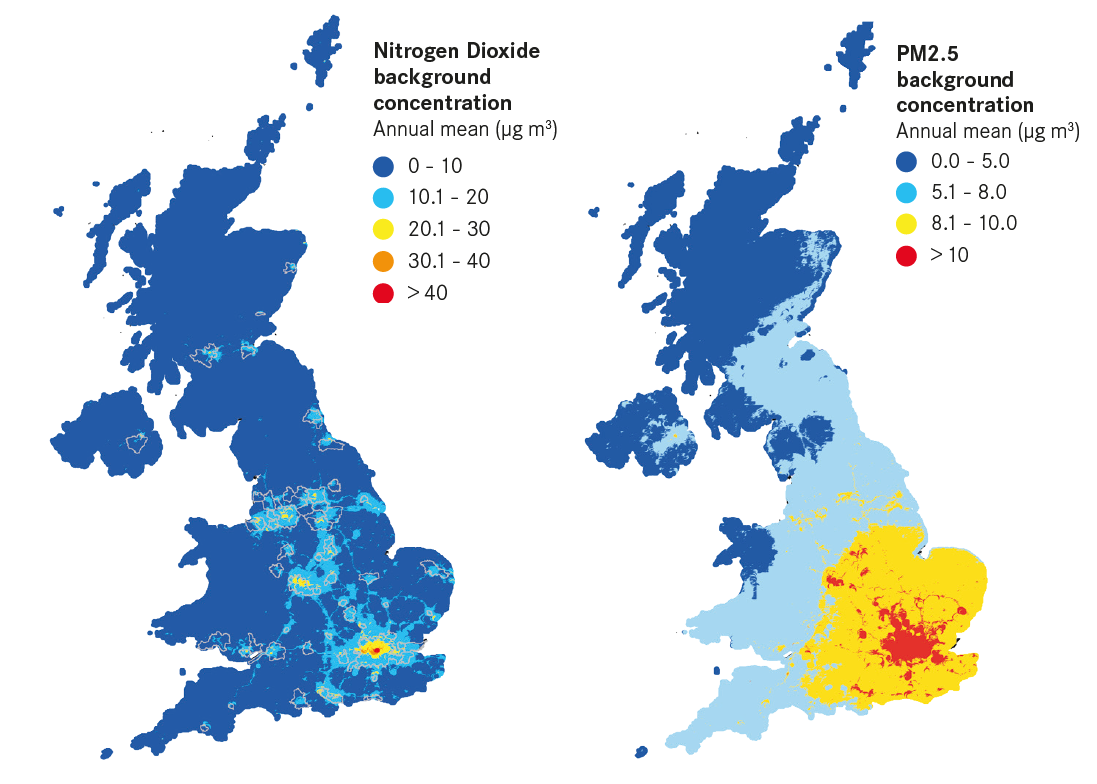
Air quality tends to be worse in cities than elsewhere in the country. Figure 2 shows the geography of background concentration levels of two major pollutants – nitrogen dioxide (NO2) and fine particulate matter 2.5 (PM2.5)6 – across the UK.
NO2 has a clear local pattern and is mostly concentrated where it is emitted: in urban areas and by busy roads. NO2 values are particularly high in the areas around London, but all urban areas have high levels.
PM2.5, which includes soot and dust generated by the burning of fuels and from brake pads being applied to tyres, is more widely spread. Despite this there is still a clear geography — levels are higher in cities than their surrounding areas, and particularly high in cities in the Greater South East.7 The higher levels seen across the Greater South East as a whole result partly from emissions from London and from contributions from continental Europe.
Figure 2: UK ambient air quality: NO2 and PM2.5 annual mean concentration
Box 1: Methodology box: how to measure air pollution?
Air pollution is difficult to measure and there is not one single way to present pollution or to assess the quality of air. While some work focuses on the pollution stemming from specific pollutants such as NO2 or particulate matter, other methods look at several different pollutants within one index.
It is important to differentiate between emissions and concentration data. Emissions data is mostly used for the identification of the source and its origin (such as transport or domestic combustion). But, as local emissions are only part of the story, it is the concentrations of pollution that give an indication of how polluted a place is. Concentration levels are measured at monitoring sites, located either nearby (roadside) or further away (background) from roads.8
To give a comprehensive, comparative picture of air quality across the UK, this chapter uses different approaches to measure air pollution. It uses data from the Met Office’s Daily Air Quality Index, which uses five different pollutants9 to give an overview of air pollution in the UK, and complements this by looking in more detail at nitrogen dioxide and particulate matter 2.5.
For nitrogen dioxide concentration, the UK is not currently meeting the legally-binding target of an annual mean of 40 micrograms per cubic metre (µg/m3). And, while legal limits for PM2.5 (set at 25 µg/m3) are not being breached, they do exceed World Health Organisation guidelines of 10 µg/m3.
Box 2: Defining cities
The analysis undertaken in this report compares Primary Urban Areas (PUAs) – a measure of the built-up areas of a city, rather than individual local authority districts or combined authorities. A PUA is the city-level definition first used in the Department for Communities and Local Government’s State of the Cities report. The definition was created by Newcastle University and updated in 2016 to reflect changes from the 2011 Census.
The PUA provides a consistent measure to compare concentrations of economic activity across the UK. This makes PUAs distinct from city region or combined authority geographies. You can find the full definitions table and a methodological note on the recent PUA update at this page: www.centreforcities.org/puas.
Poor air quality is a particular problem in southern cities
While cities generally show higher levels of pollution compared to non-urban areas, not all cities experience the same levels of air pollution.
The Daily Air Quality Index (DAQI) measures daily air quality in a place on a scale from 1 (low) to 10 (very high), and is made up of a basket of five pollutants. A score of 4 or above can affect adults and children with lung or heart problems, while values equal to 7 or above are likely to have immediate impacts even on those without existing health issues.10 In the UK, average daily values are usually between 2 and 4, but these mask spikes in pollution in specific areas.11
Figure 3: Number of days the maximum modelled DAQI was equal to or above 4 in 2018
Figure 3 shows the number of days during 2018 when the maximum DAQI in one place in a city was equal or above 4 in a year, i.e. the number of days where air quality was poor enough to affect those with pre-existing health issues.
Cities in the South saw scores of 4 or above most frequently in 2018. Bournemouth had the highest number, with DAQI measuring 4 or above on 62 separate days of the year. It was followed by London and Southampton, which had over 50 days where this score was met or exceeded.12
Edinburgh and Belfast had the lowest number, with just seven days at or above 4. They were followed by two other Scottish cities, Aberdeen and Dundee, with respectively 9 and 11 days.
Of the basket of pollutants in the DAQI, two are of particular concern for human health. The first, nitrogen dioxide (NO2), is the only pollutant for which the UK breaches existing legal limits. And, while the UK complies with the law for the second, particulate matter 2.5 (PM2.5), it is well above the guidelines recommended by the World Health Organisation (WHO).
For NO2, there are two measures to consider – the number of roads that breach legal limits (shown by the colours in Figure 4) and by how much the worst performing roads breach this limit (shown by the size of the circles). The map shows that 38 of 63 cities had monitored roads which record excessive NO2 concentrations and 15 cities had 10 per cent or more of their roads above legal limits. They are relatively spread across the country, but London had the highest proportion with nearly 40 per cent of monitored roads on average above the legal limit. The capital was followed by Aldershot, Coventry and Basildon.
London also had the road with the highest reading of NO2 in the country, which was more than twice the legal limit, followed by roads in Birmingham, Southampton and Middlesbrough.
Figure 4: Share of roads breaching NO2 legal limits and the maximum concentration reached
Turning to PM2.5, data shows that around 62 per cent of monitored roads13 in UK cities exceed the WHO guidelines for annual levels of PM2.5 (10 micrograms per cubic metre (µg/m3)) as illustrated by the large share of purple circles in Figure 5. If the WHO guidelines were law in the UK, all the monitored roads in 19 cities would breach this limit.
The geography of cities exceeding the WHO guidelines for PM2.5 is more clear cut than that of those breaching legal limits for NO2. Cities in the South of England tend to perform more poorly on this measure, with Scottish cities having amongst the fewest breaches. In terms of highest concentration reached, the worst monitored road was once again located in London (17 µg/m3), followed by other cities in the South East of England: Portsmouth, Aldershot, Chatham and Reading, which all have a maximum recorded value of around 15 µg/m3.
Figure 5: Share of roads breaching PM2.5 WHO guidelines and the maximum concentration reached, 2018
Not all air pollution in a city is generated by that city
Air quality in a city is not only determined by the activities in a city itself. Some air pollution is blown in from elsewhere. For example, high levels of PM2.5 in the Greater South East, as shown earlier, are partly explained by pollution coming across the Channel from the continent. There is little cities can do about this and addressing it will require international agreements and action.
But national and local policy has much more control over locally-generated air pollution and looking at the data on emissions shows the size of this problem. In absolute terms, London, Birmingham and Manchester emit the highest tonnages of emissions, both for PM2.5 and NO2. London particularly stands out, as it emits more than 6,000 tonnes of PM2.5, and 51,000 tonnes of NO2, which is as much as three times the tonnage emitted in the other two.
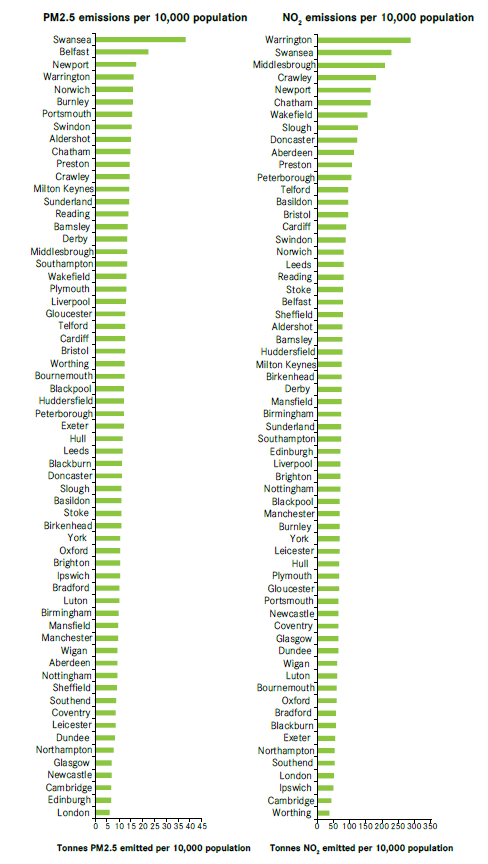
On a per-capita basis, Swansea and Belfast have the highest PM2.5 emissions per 10,000 inhabitants, while London has the lowest (see Figure 6). For NO2, Warrington, Swansea and Middlesbrough have the highest emissions per 10,000 inhabitants.
Figure 6: PM2.5 and NO2 emissions per 10,000 population across UK cities
The sources of air pollution vary across cities, and road transport is just one of a number of causes
Transport is the main source of NO2 emissions but not the only one. At a national level, road transport accounts for 34 per cent of all NO2 emissions,14 and this rises to 42 per cent in cities – it represents the biggest source of local NO2 in 54 cities (see Figure 7).
But transport plays a smaller role in PM2.5 emissions, accounting for 12 per cent of these emissions at a national level, with similar levels in UK cities. Instead, it is domestic combustion (for example, through coal or wood fires) that is the biggest contributor. Around 38 per cent of PM2.5 levels in the UK can be explained by domestic wood and coal burning.15 In cities, this rises to 50 per cent, and is the largest source of PM2.5 in 57 UK cities. Some of this is to do with the rise in the use of wood stoves. The industry body HETAS estimated that the number of wood stove registrations increased 10-fold between 2004 and 2014.16
The sources of air pollution vary significantly between cities, both for NO2 and PM2.5. Figure 7 shows, for instance, that in Slough a relatively large part of NO2 comes from combustion in energy production, whereas in Middlesbrough, Warrington and Swansea, industrial processes contribute more to NO2 emissions. Meanwhile, in places like Chatham or Worthing, PM2.5 is almost exclusively driven by combustion in commercial, institutional and domestic activities. In Aberdeen and Crawley, non-road transport (such as shipping or air transport) contributes a larger share of PM2.5 emissions.
Figure 7: NO2 and PM2.5 sector breakdown for UK cities

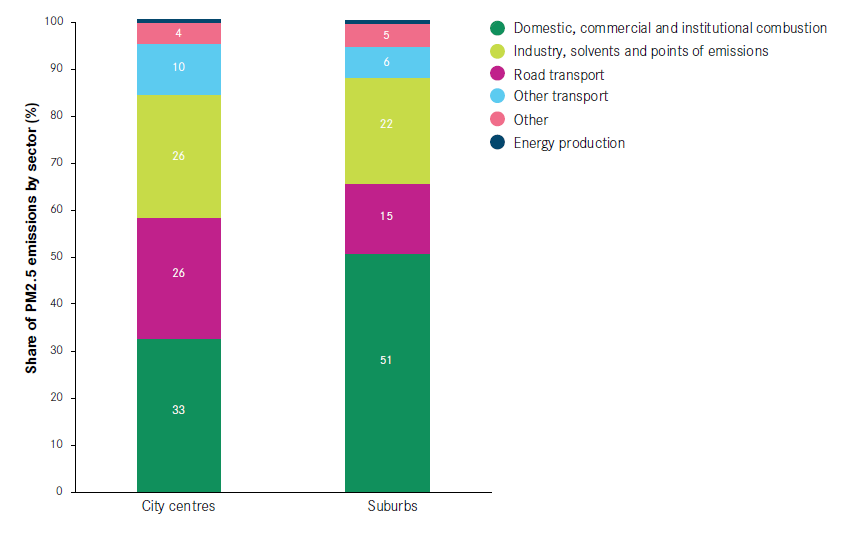
Even looking at the level of a city hides variation in the sources of air pollution within them. Figure 8 shows a sector breakdown of PM2.5 emissions in city centres and suburbs. While road transport’s contribution is much higher in city centres, in suburbs more than half of PM2.5 emissions come from domestic and commercial combustion. Such a difference can be explained in part by higher congestion rates and traffic flows in city centres, and residential wood burning in less central areas. This shows that in tackling air pollution, different approaches will be required even within a city.
Figure 8: The composition of sources of PM2.5 emissions for city centres and suburbs
Air pollution kills thousands of people each year, and affects the health of many more
Local data on the number of people whose health is affected by poor air quality is limited – asthma attacks brought on by poor air quality, for example, are difficult to record in a systematic way. Box 3 looks at the broader health impacts in more detail.
What can be estimated are the deaths attributable to one pollutant, PM2.5, in cities across the UK. These estimates show that, even on this very limited measure, poor air quality is a killer.17
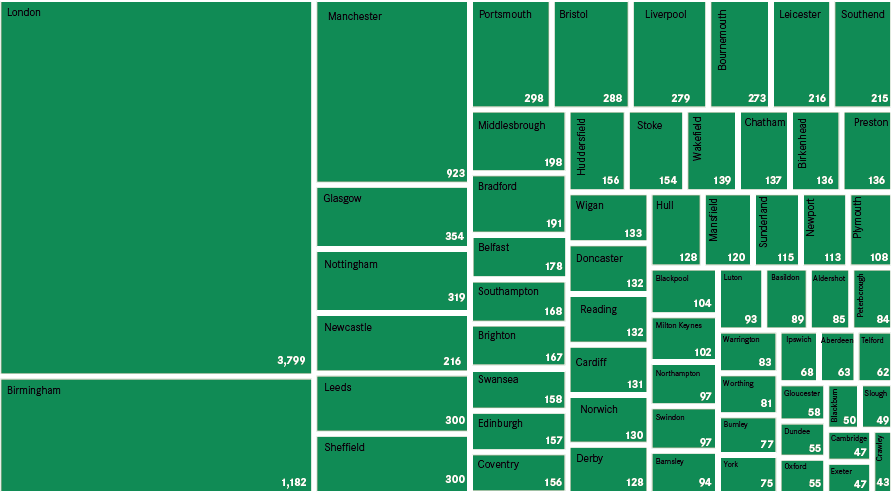
This one pollutant is estimated to have caused just over 14,400 deaths of those aged 25 or older in UK cities in 2017 (see Figure 9). In absolute terms, large cities had the largest number of residents estimated to have died due to PM2.5. London had the highest number, followed by Birmingham and Manchester.
Figure 9: stimated absolute number of attributable deaths caused by PM2.5, 2017
Box 3: What are the health impacts of air pollution?
The Royal College of Physicians has estimated that air pollution is responsible for more than 20,000 hospital admissions a year due to respiratory or cardiovascular diseases.18 There is no comprehensive local data on the various health impacts of air pollution. However, research conducted by King’s College London and UK 10019 has estimated the following effects on nine UK cities:
- Living near a busy road in London may contribute to 230 hospital admissions for strokes every
- Living near a busy road may stunt lung growth in children by 5 per cent in London and 14.1 per cent in Oxford.
- In Birmingham, the risk of outside-hospital cardiac arrest is 2.3 per cent higher on high pollution days.
- Higher air pollution days are responsible for 43 more people going to hospital for respiratory disease in Southampton, 68 in Bristol, 98 in Liverpool.
Public Health England20 estimates that there could be around 2.5 million new cases of coronary heart disease, stroke, lung cancer and other health conditions by 2035 if pollution levels remain the same.
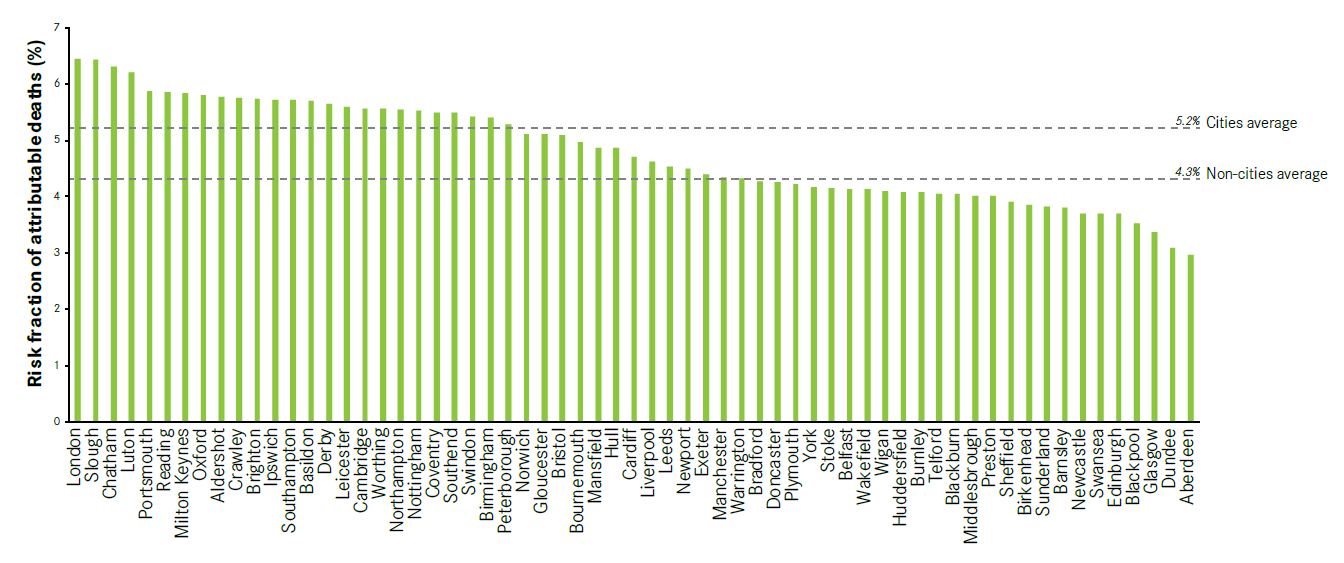
When looking at the proportion of local deaths that can be attributed to long- term exposure to PM2.5, the rank of cities changes as illustrated in Figure 10. London as the biggest city in the UK still tops the list but it is followed by a number of smaller cities — Slough, Chatham and Luton. For these cities, around one in 16 deaths is attributed to PM2.5 pollution (more than 6 per cent).21
This is in contrast to cities like Dundee and Aberdeen, where around one in 33 deaths is related to PM2.5 exposure (around 3 per cent). This echoes the outcomes of the DAQI index: the five worst cities in Figure 10 all had more than 30 days a year when DAQI was 4 or above, while the Scottish cities with the lowest share are ranked at the bottom of the DAQI index.
Figure 11: Proportion of local deaths that can be attributed to long-term exposure to PM2.5, 2017
These deaths occur in spite of the UK meeting current legal limits. Local authorities in Scotland follow the stricter WHO guideline for PM2.5,22 after the Scottish Parliament published its Clean Air Strategy in 2015 in which the annual concentration objectives were set at 10 µg/m3. But this is not the case elsewhere in the UK.
Cities have not responded sufficiently to the impact of air pollution on their residents and workers
Local policy aimed at limiting air pollution in recent years has at best been slow and at worst absent. The rush to declare Climate Emergencies by local authorities in the last year – a global issue over which they have very little direct control – strongly contrasts with action on air pollution, an issue where their actions can more clearly make a difference.
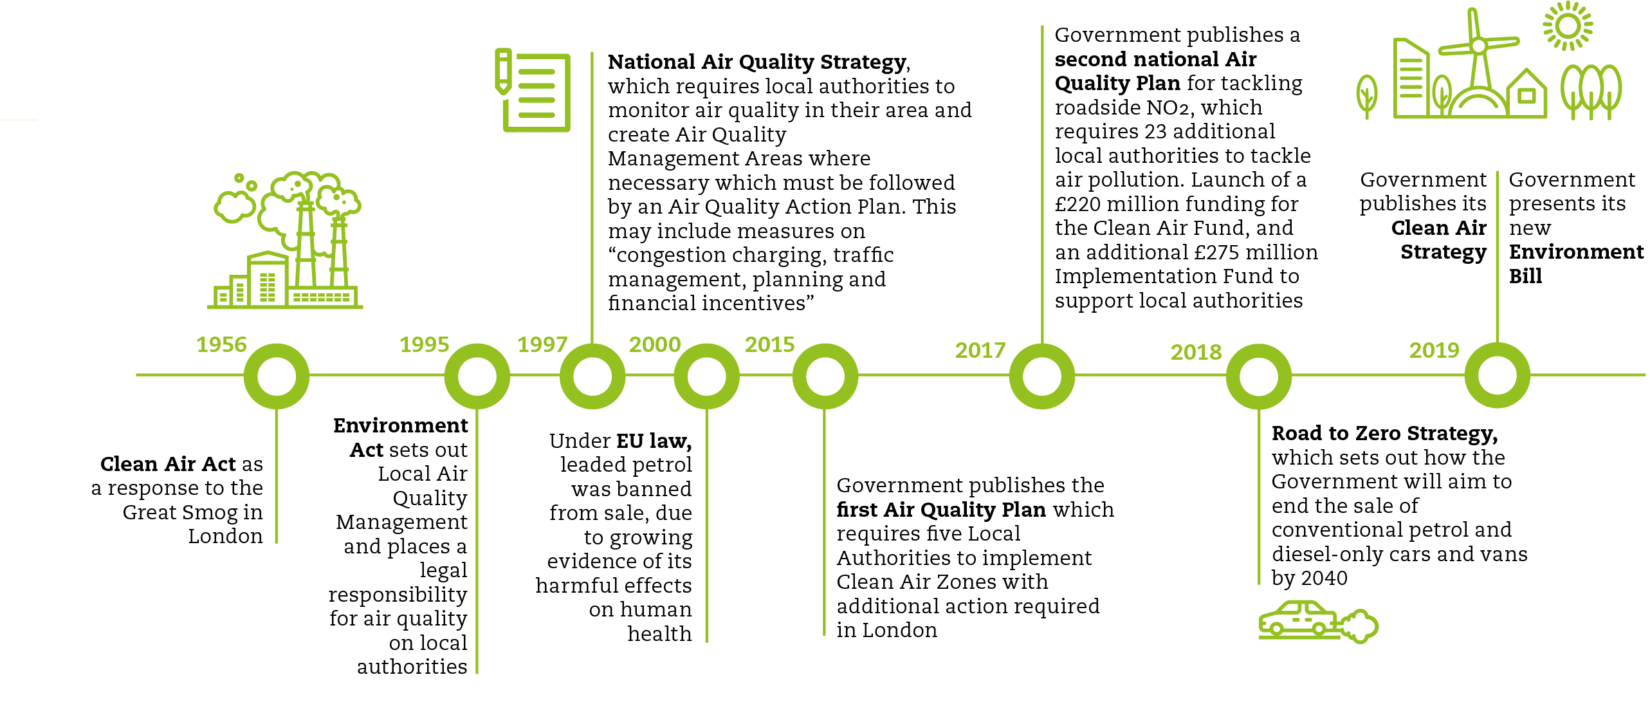
National policies addressing air pollution have a long history in the UK and have been successful when concrete action was undertaken. In 1956, the first national policy to target air pollution – the Clean Air Act – was introduced in response to the ‘Great Smog’ in London. Box 4 sets out a timeline of national policies in this area since the 1950s.
Box 4: Timeline of air pollution policies
More recently, two place-based policies have been introduced at the local level – Air Quality Management Areas (1995) and Clean Air Zones (2015).
Air Quality Management Areas
Air Quality Management Areas (AQMAs) were first introduced by the 1995 Environment Act. They are areas designated by local authorities that face air quality challenges, and vary in size, from one street to, in Liverpool’s case, the whole city centre. When national air quality standards and objectives have been met, and will continue to be, an AQMA can be revoked.23
Since their implementation, a total of 902 AQMAs have been introduced by 285 local authorities. Despite the concentration of air pollution in UK cities, 56 per cent of currently-active AQMAs are located outside cities.
The main issue of AQMAs is that, on the whole, they have been ineffective. Of the 902 AQMAs established in the last two decades, 670 are still active today, as illustrated in Figure 11. And 29 cities have not revoked any of their AQMAs. This suggests that a significant number of areas have so far failed to sufficiently address their local air quality issues.
This perhaps is not surprising given that local authorities are not legally obliged to meet the objectives set by their action plans.24 There is, then, little incentive to do anything about poor air quality within them.
In addition, most AQMAs are focused only on NO2. But, as shown above, although important, NO2 is just one of a number of pollutants contributing to poor air quality.
Figure 11: Creation and revocation of AQMAs

Clean Air Zones
The successive legal challenges brought by the environmental law charity ClientEarth against the UK Government for breaching its duty to meet the legal limit for NO2 have sparked more recent action on air pollution. As set out in the Air Quality Plan,25 Clean Air Zones (CAZs) are the Government’s preferred policy tool. CAZs can either be ‘charging’ zones, where they involve a fee on vehicles that do not meet the emission standards,26 or ‘non-charging’: where they do not impose fees, but rely on other measures to improve air quality. These include developing cycle lanes, improving public transport or introducing traffic-flow management.
The UK Government has mandated a number of areas to tackle their levels of NO2:
- Six ‘first wave’ local authorities in 2015 — London, Birmingham, Nottingham, Southampton, Leeds and Derby – with the Government suggesting that CAZs were the preferred action to
- A further 23 English local authorities in 2017 to carry out feasibility studies on ways to reduce NO
- Another 33 were designated to do the same in 2018, including eight where NO concentration projections were worse than27
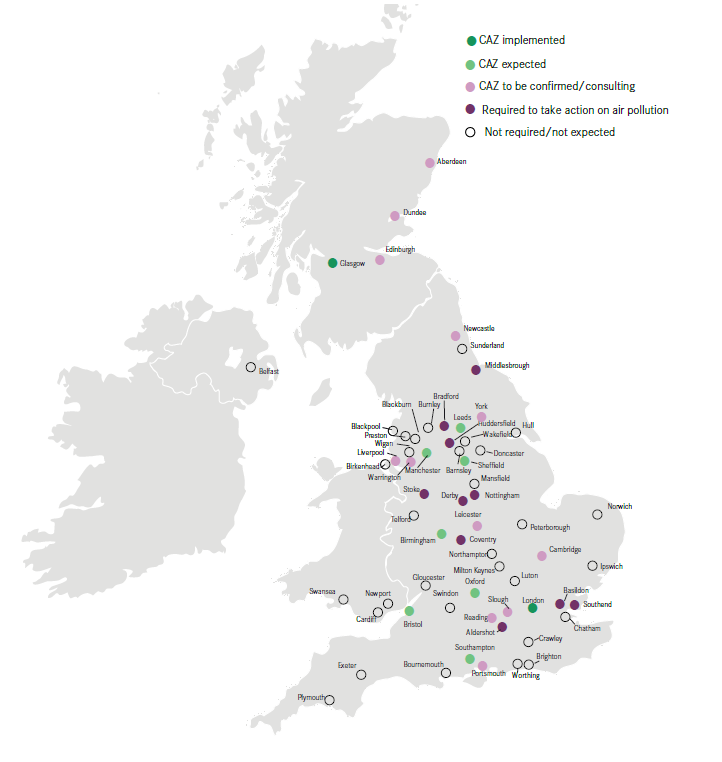
Despite the requirement from Government, the local response has largely been disappointingly slow. Figure 12 shows the current implementation of Clean Air Zones in the UK. Just two CAZs have been put in place, in London and Glasgow.28 The lack of action is more frustrating because the evidence from London suggests that CAZs have an impact on reducing NO2 emissions (see Box 5). While there are plans to introduce CAZs of various forms elsewhere, none of the other ‘first wave’ cities, that were required to put a CAZ in place by 2020, have not yet done so, nor do they have they have sufficient alternative arrangements. Despite the problems of air pollution illustrated above, most cities have either delayed the introduction of a CAZ, or have decided against implementing it.
Figure 12: Clean Air Zones in the UK
Of those that have developed proposals, some go further than others. For example, while Birmingham has taken the politically-courageous decision to charge non-compliant private cars, Greater Manchester and Leeds have not, and Southampton will not charge at all, implementing a ‘non-charging’ CAZ. After some delay, Bristol recently approved its plan, which will not charge private cars but will ban all diesel vehicles in the city centre from 2021, and York has recently decided to ban all private cars from its city centre by 2023.
One argument made against introducing charging zones is that charges will disproportionally affect poorer people, but poorer households are less likely to own a car. In addition, toxic air harms low-income households more, for example, because they are more likely to live near a busy road. This means that charges that effectively reduce local air pollution should disproportionately benefit poorer households.29
Box 5: How London’s Ultra Low Emission Zone has reduced air pollution
In April 2019, London launched its first Ultra Low Emission Zone (ULEZ), which operates in the existing central London Congestion Charge Zone. By implementing stricter emission standards, the aim of the ULEZ is to reduce the number of old, polluting vehicles circulating in the central zone, and therefore improve air quality. The evaluation of the first six months of the zone showed significant progress30 (although some improvements reflect the impact of the Toxicity Charge introduced in 2017):
- Increase of the average compliance rate with ULEZ standards from 39 per cent in February 2019 to 77 per cent in September
- Reduction of 36 per cent of NO2 concentration in central London between February 2017 and September
- Reduction of NO2 concentration equivalent to 29 per cent in central London, compared to a scenario with no ULEZ , based on average data between July and September
- Reduction of nitrogen oxides emissions from road transport in the central zone by 31 per
- Reduction in the number of polluting and non-compliant vehicles in the zone by 38 per cent, which corresponds to 13,000 fewer on an average
London has also introduced a near £50 million scrappage scheme to incentivise people to switch to cleaner vehicles, allocating £25 million for low-income motorists, in addition to an existing £23 million scrappage scheme for micro-businesses, sole traders and charities.
What needs to change
Laudable environmental concerns in relation to climate change need to be mirrored in action on the linked issue of air pollution, on which progress has been frustratingly patchy and, in places, too slow. Politically, it is difficult given the strength of the motoring and other lobbies but it is by no means impossible as London has shown.
After all, this is an issue that is affecting the health of people living and working in cities, that increases the number of sick days taken in workplaces and in the most extreme cases kills residents. It is difficult to think of a more compelling case for action.
So this is what needs to change. In the UK’s largest cities and towns:
- Those cities with poor quality air should ‘level up’ to London-style CAZs, charging the most environmentally-damaging vehicles to enter their centres.
- Expand their policy action to have a broader focus than just transport:
- Set tighter minimum emission standards for burning stoves and ban domestic burning in areas with high 5 levels.
- Work on raising public awareness on the effect of domestic combustion.
- Restrict the sale of polluting
- Advocate collectively to central government for more powers and resources to clean up their air.
To support this, the UK Government should:
- Triple the size of the Clean Air Fund, which currently is £220 million for the period 2018/19 to 2020/21 to help cities introduce policies to improve air A share of the budget should be specifically used to fight cross- boundary air pollution by funding authorities to make interventions that improve the air quality of their neighbours.
- Introduce Environmental Improvement Bonds, based on the current Social Impact Bond model, allowing cities to keep some of the savings made from reduction in NHS treatment of air quality-related
- Expedite passing its Environment Bill, which should legislate to:
- Adopt the WHO’s stricter guidelines on 5 as a target to be met by 2030.
- Give local authorities greater powers to declare and enforce smoke control
- Establish an independent body to hold the Government to account on environmental issues after the UK leaves the
Secure an international agreement with the EU to tackle trans-boundary air pollution coming from the continent.