
01A decade of austerity
Austerity does not play out evenly across the country, with cities hit especially hard. The end of austerity must signal both more money and more freedoms for cities.
Prior to Brexit, austerity – the reduction in government spending to bring down the amount the public sector borrows – has been the most politically contentious issue of recent times.
Last October the prime minister announced at the Conservative party conference that austerity is over, bringing to an end the policy of cutting public spending that has been in place since 2010. What exactly this means though will only become clear when departments have their budgets set in the forthcoming Spending Review.
This will be a big moment for local government. It has been hard hit by this period of austerity, shouldering a greater share of the cuts than any other area of public spending. A sustained reprieve from these cuts will be a welcome relief.
In light of both the Spending Review and Fair Funding Review (which will recommend how funding should be allocated across local government), this chapter looks at how cuts to local government budgets have played out across the country. It shows that, despite the high profile coverage of the struggles of county councils in recent years (most notably Northamptonshire), it is actually cities, and especially those in the north of England, that have been hit hardest by austerity.
The combination of cuts to budgets and the increase in demand for social care mean that local authorities in these cities, in particular, are increasingly becoming the providers of social care only. If they are to continue to play a role as custodians of their places then a change in the amount and structure of funding they receive will need to be addressed in both reviews.
Box 2: Methodology
This work builds on the research undertaken by researchers at the National Endowment for Science, Technology and the Arts (Nesta) and Oxford Martin.
In The future of skills: employment in 2030 report, Nesta used an innovative mixed-methods approach, combining expert human judgement with machine learning to estimate how technological and non-technological trends will affect the demand for different bundles of skills, and so employment in the future.
The probabilities estimated by Nesta of the likely increase in demand for minor occupation groups (SOC 3 digits) were then combined with labour market information for each city, to make estimates about jobs likely to increase and decrease in different parts of the country.
The composition of the labour market in each city was built using data from the 2011 Census and the Business Register of Employment Survey (BRES). Data from the Census provides a detailed breakdown of minor occupation groups that is not available in BRES. In order to have the most recent data possible, estimates on the 2016 workforce in each minor occupation group were created by combining data in the Census with the most updated information on broad occupation groups available in BRES.
Box 3: Where does local government get its money from?
There are a number of sources from which local government gets its funding. The main one is grant from central government. It also gets to keep all council tax and a share of business rates raised within each authority’s area. And it also earns money from income from ‘external trading’ such as rents from property it owns. Together these streams cover ‘net expenditure’. Each authority must balance its spending with income each year, and either builds up or draws down its reserves if they are not aligned.
Two other sources of income are used to pay for additional service provision. One is money from charging for services, such as use of local authority owned leisure centres or theatres. And the other is grant from non-central government bodies, such as the NHS or the National Lottery. Adding these two sources to net expenditure gives total expenditure spent on day-to-day services in an authority.
Local government, particularly in urban areas, has been hardest hit by austerity
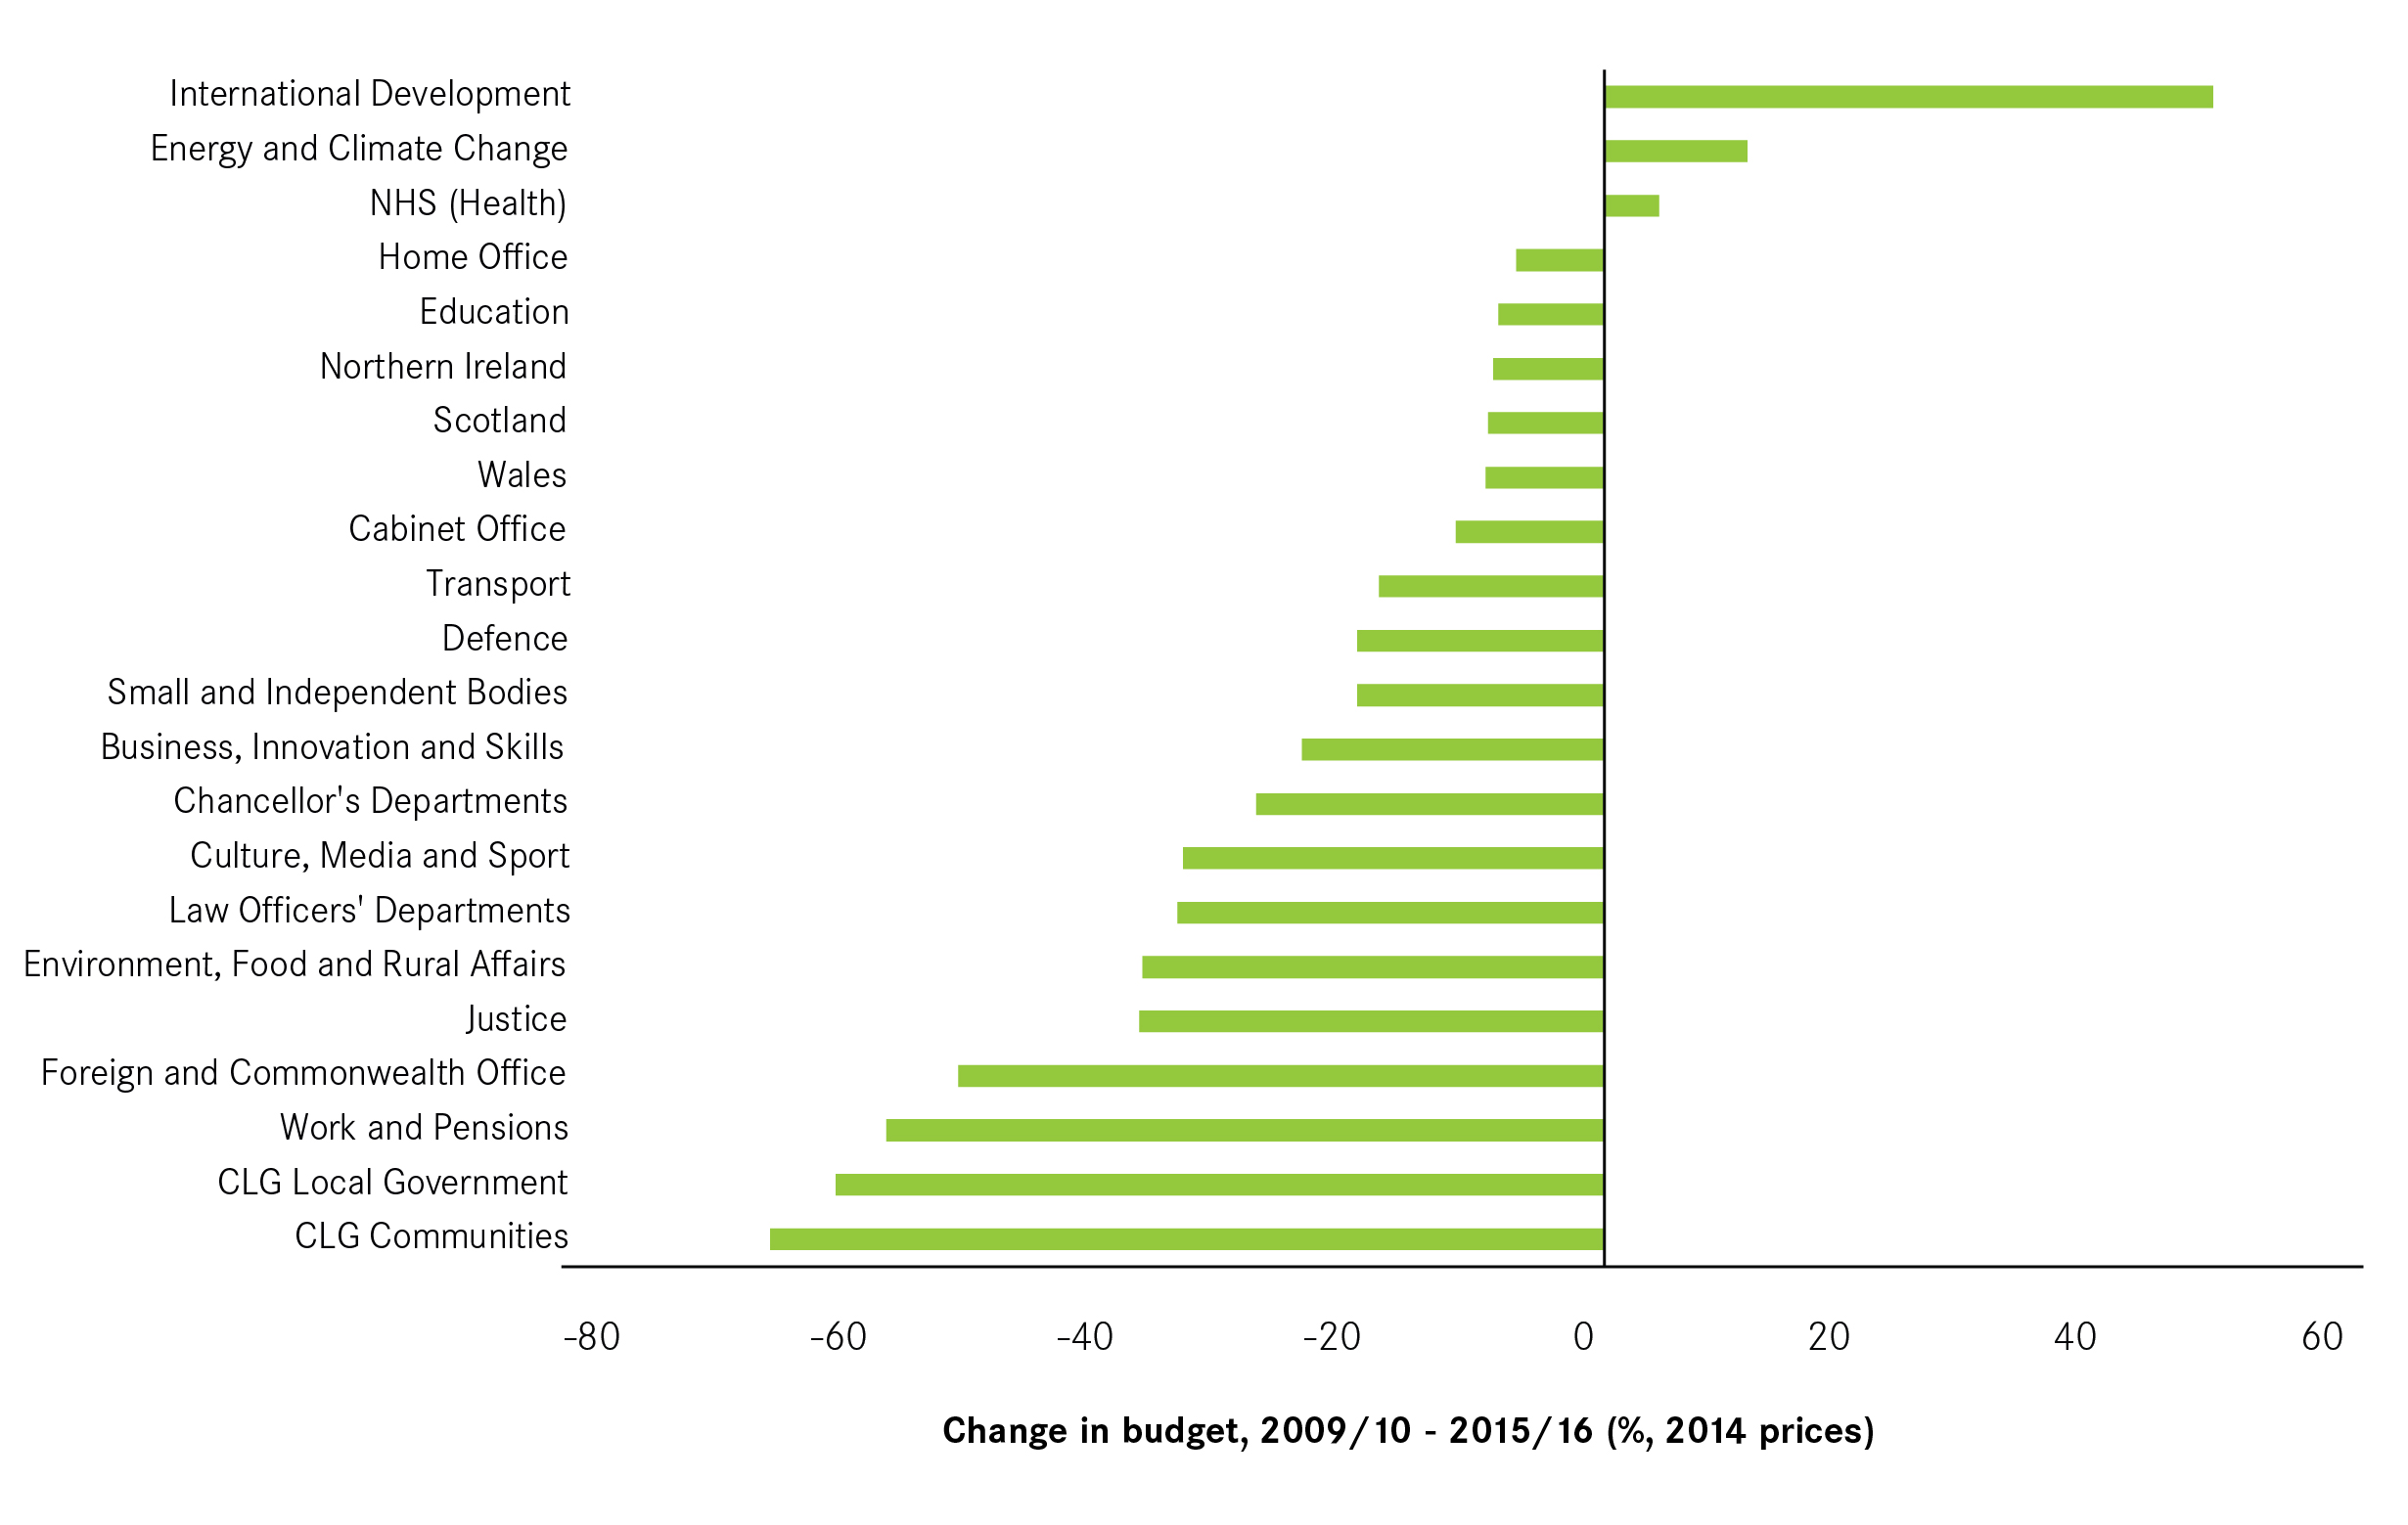
The period of austerity brought about by the financial crisis at the end of the last decade has not been equally shared out across government. As Figure 3 shows, it has been local government in England that has borne the biggest burden, with its budget being cut by more than half between its peak in 2009/10 and 2015/16.4
Reflecting the variation across government departments, there has also been a great deal of variation within local government as to the severity of these cuts. Looking at how these cuts to government funding have translated through to spending on day-to-day services shows that cities have tended to see the deepest cuts. As a whole, there has been an 18 per cent fall in the day-to-day spending by local government in cities between 2009/10 and 2017/18, compared to a 9 per cent fall elsewhere.
Figure 3: Spending changes by department, 2009/10-2015/16
This meant that British cities – home to 55 per cent of the population – have shouldered 74 per cent of the total cuts to local government’s day-to-day spending. On a per capita basis, this equates to cuts of £386 per person in cities compared to £172 per person elsewhere in Britain.
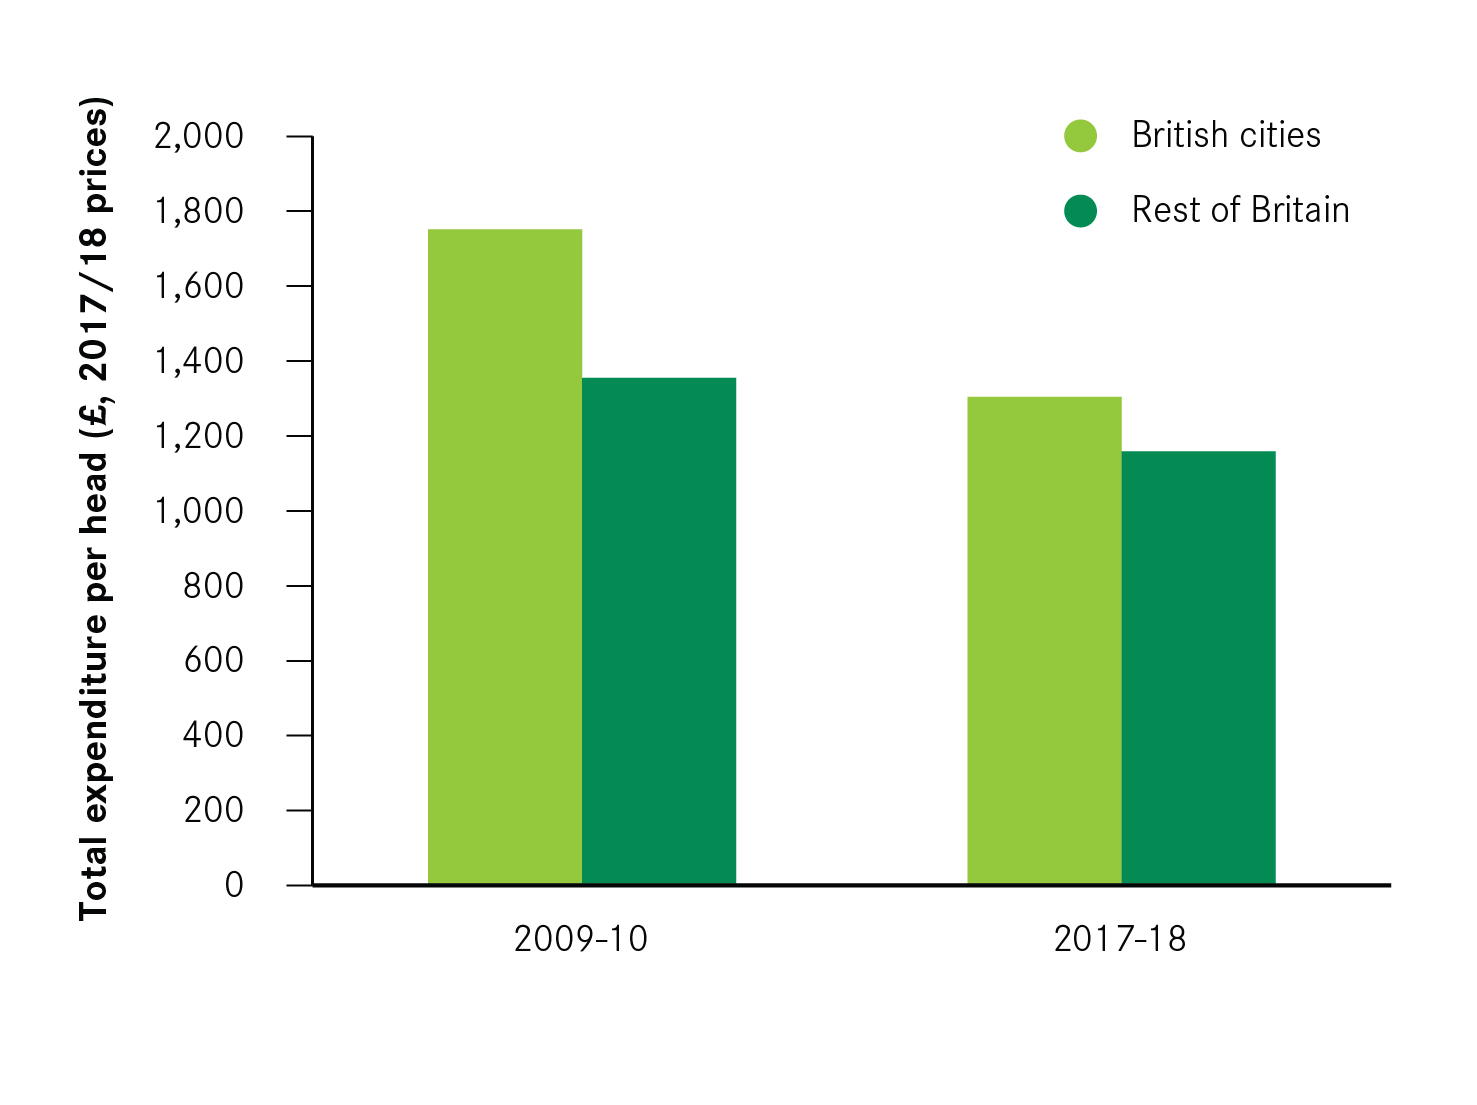
The result is that while spending in cities was much higher than elsewhere in 2009/10 (£1,659 per person in cities compared to £1,293 elsewhere), it is now very similar (£1,273 in the former compared to £1,121 in the latter, see Figure 4). This is despite need on average being higher in cities than in non-urban authorities, as discussed in Box 4.
Box 4: Levels of need in cities
Estimating need is not a straightforward task. What we do know is that poorer households tend to be more reliant on public services, and that these poorer households are concentrated in cities. For example, 62 per cent of people in social housing live in British cities; 62 per cent of people claiming unemployment benefit live in UK cities; and four-fifths of people living in the 10 per cent most deprived areas of England are in cities. By comparison, of the 10 per cent least deprived communities, just 40 per cent of residents live in cities.
Figure 4: Change in total spending on a per capita basis, 2009/10-2017/18 (2017/18 prices)
Northern English cities have been hardest hit by austerity
Cities in the north of England were much harder hit than those elsewhere in Britain (see Figure 5). Seven of the 10 cities with the largest cuts are in the North East, North West or Yorkshire, and on average northern cities saw a cut of 20 per cent to their spending. This contrasted to a cut of 9 per cent for cities in the East, South East and South West (excluding London).
Barnsley has been the city hardest hit by austerity on this measure, with a reduction of 40 per cent in its day-to-day spending on services. This was a fall of around £145 million, which equated to a cut of £688 for every resident in the city.
On a per capita basis, Liverpool has seen the largest cut. Its £441 million reduction in spending equates to £816 fall for every resident in the city.
In terms of absolute cuts, London has been by far the hardest hit. The capital has had a total of £3.9 billion removed from services spending. This meant that London accounted for 30 per cent of all cuts in Britain, despite accounting for 16 per cent of the population.
Not all cities have seen reductions in spending. Two cities – Oxford and Luton – have seen increases in overall spending. These cities have seen a real terms increase of 15 per cent and 21 per cent respectively in their day-to-day spending.6
Cuts have been achieved mainly through services that councils aren’t legally obliged to deliver
Services that local authorities do not have to deliver by law have mostly been hit by the cuts. As Figure 6 shows, services such as planning, libraries and culture activities have seen the deepest cuts in cities and non-urban areas alike, with spending on planning and development falling by 41 per cent in urban areas. Meanwhile, children’s and adult social care, both being statutory services, have been relatively protected. This is especially the case outside of cities, which have seen an increase in spending in this area.
Figure 5: Change in total spending, 2009/10-2017/18 (2017/18 prices)

Figure 6: Change in total spending on different areas in British cities and elsewhere in Britain, 2009/10-17/18 (2017/18 prices)

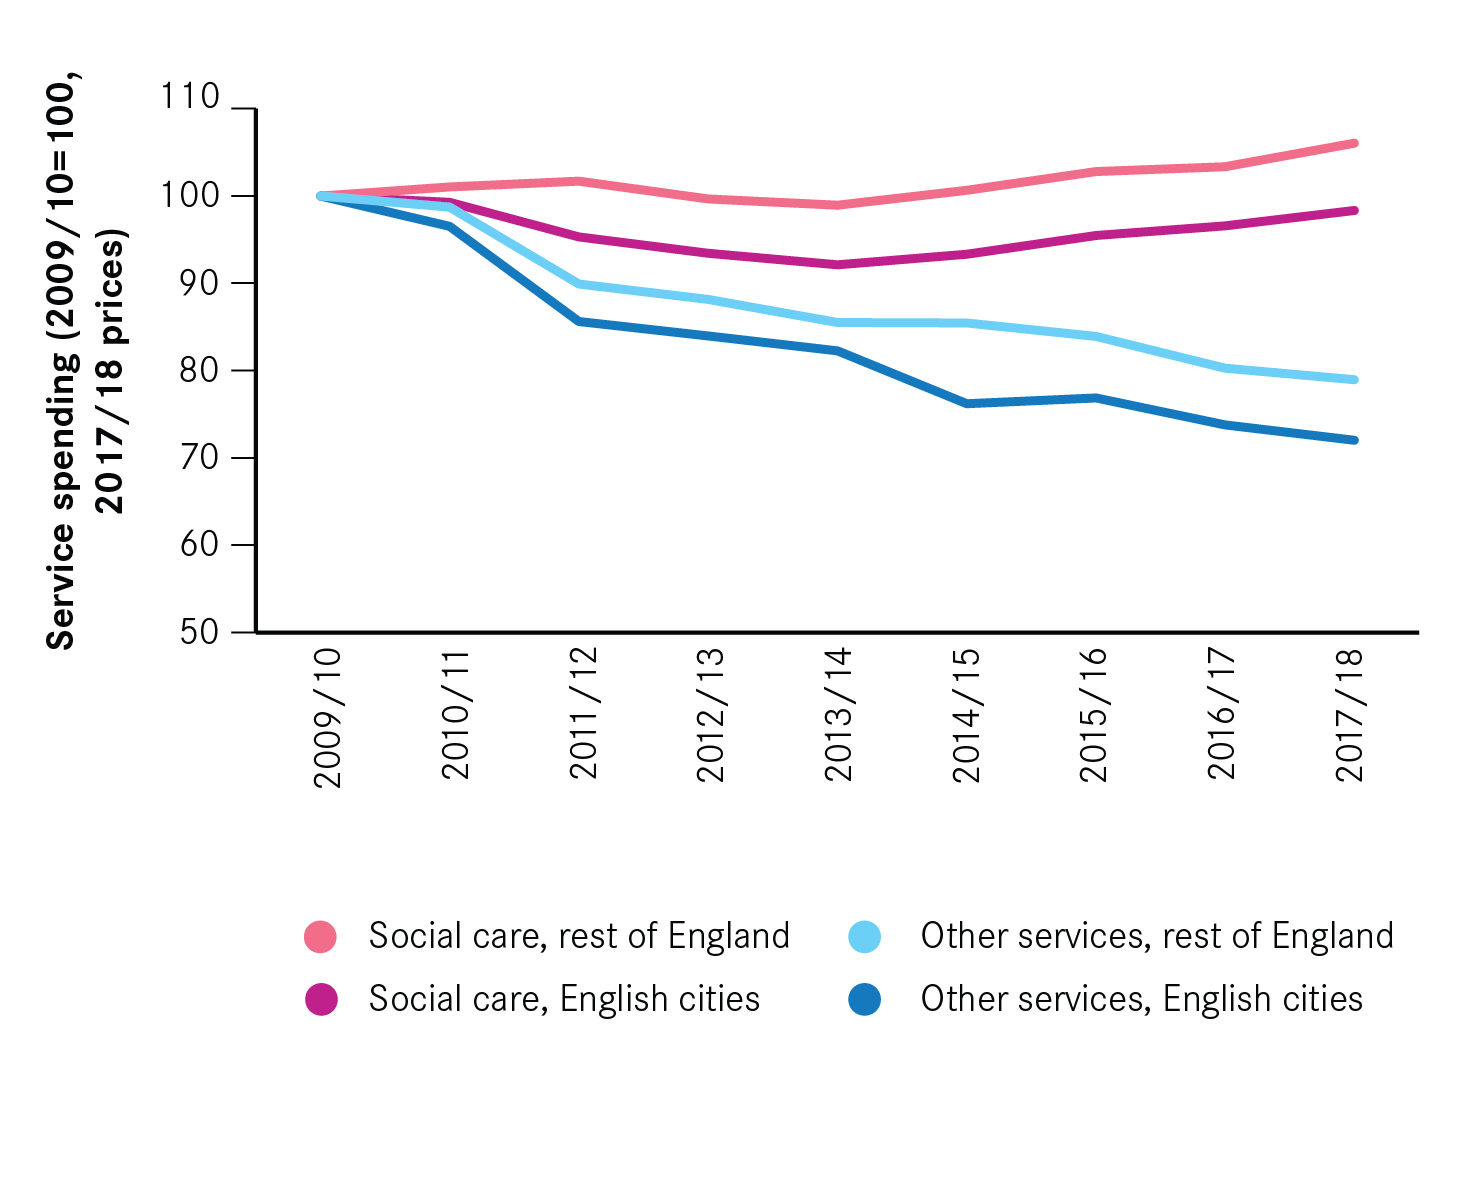
Reflecting the larger cuts overall, cuts across service areas have been deeper in cities than elsewhere. As Figure 7 shows, this has meant that cuts to all spending areas minus social care have been deeper in English cities. Street cleaning and economic development are two areas that have fallen particularly in urban areas. Street cleaning spending is down 30 per cent in cities (compared to 18 per cent elsewhere), while economic development spending is down 43 per cent (compared to 24 per cent elsewhere).
This means that social care has taken up a growing share of overall spending, rising from 38 per cent of spending in cities in 2009/10 to 46 per cent in 2017/18. At the start of the period four cities spent more than half of their budgets on social care. By 2017/18 half of all cities did so.
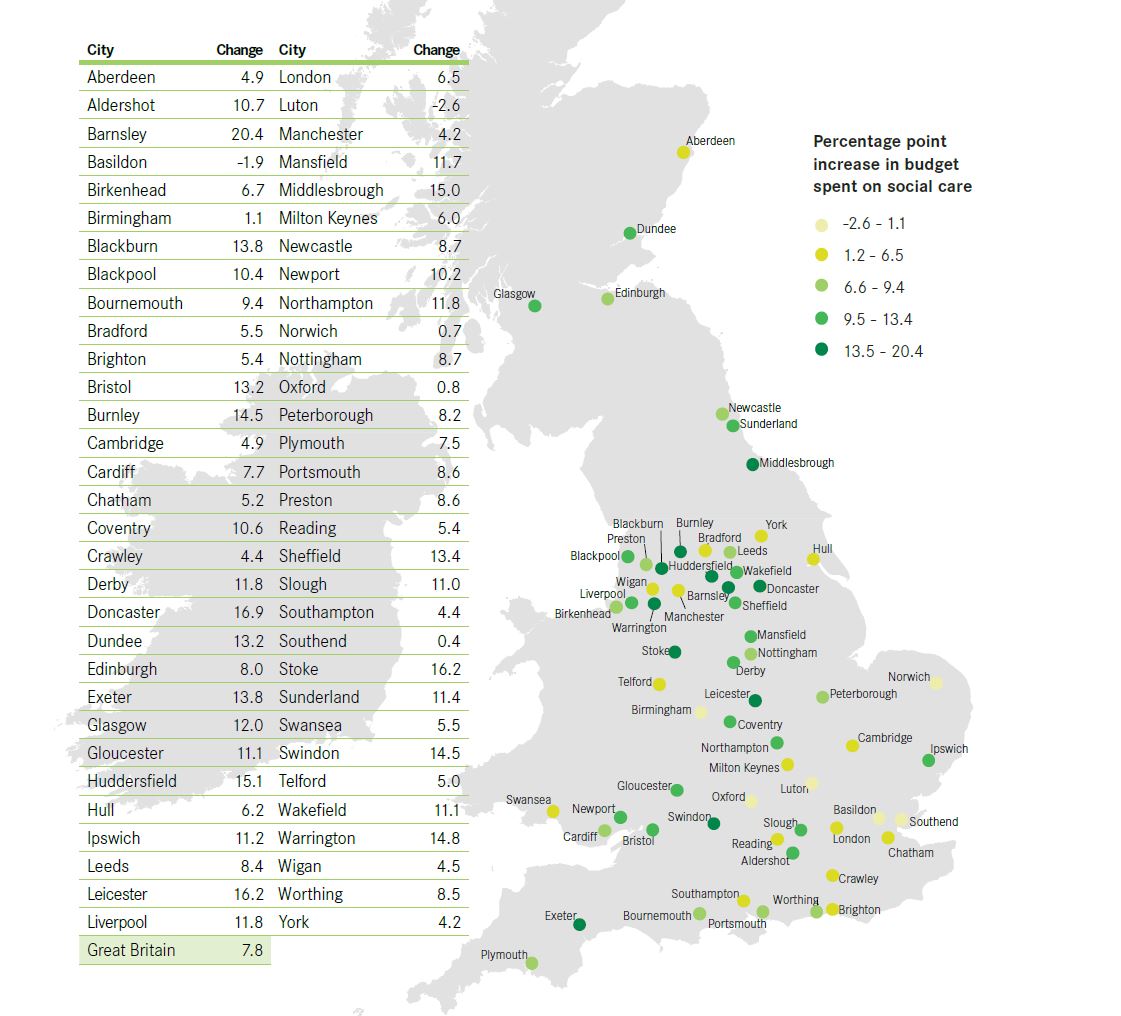
At 62 per cent, Barnsley committed the largest share of its overall spend to social care. It also saw the largest increase in the share of its budget being spent on social care, rising 20 percentage points. As Figure 8 shows, reflecting the cuts to overall budgets, it has tended to be cities outside of the Greater South East where social care has made up the largest increases in overall budgets.
Figure 7: Change in spending on social care and other services in England since 2009/10 (2017/18 prices)
These increases are concerning given both the current state of social care and the likely future increase in demand for it. The National Audit Office notes that there have been significant increases in the demand for social care in recent years, both in terms of the number of children in local authority care and over 65s requiring support.7 In their Performance Tracker, the Institute for Government and CIPFA identify social care alongside prisons and neighbourhood services as the service that it has the biggest concern over future performance due to both further increases in demand and the ability to make future efficiency savings.8
This, in turn, raises important questions about the future role of local authorities in a city. Are they primarily to be providers of social care? Or are they also the shapers and custodians of their place?
Figure 8: Change in social care spending, 2009-10 – 2017/18
Cities most reliant on grant have seen the largest cuts to this grant
The main driver of the cuts to local government spending has been cuts to central government grant. How these cuts have been implemented has shaped the geography of spending cuts set out above.
When austerity measures were first introduced, the cuts to the main grant in England were broadly similar in percentage terms across all local authorities. But the varying dependence on grants of different authorities meant that these cuts played out very differently across the country. This is because a 10 per cent cut to Hull, say, where around half of its income came from grant, is a much larger cut to overall income than a 10 per cent cut in Worthing, where around a fifth of income came from grant. Added to this, a number of specific grants were scrapped completely in England. One example is area based grants, of which 65 per cent were given to cities in 2009/10.
Figure 9: Reliance on grants and change in public spending
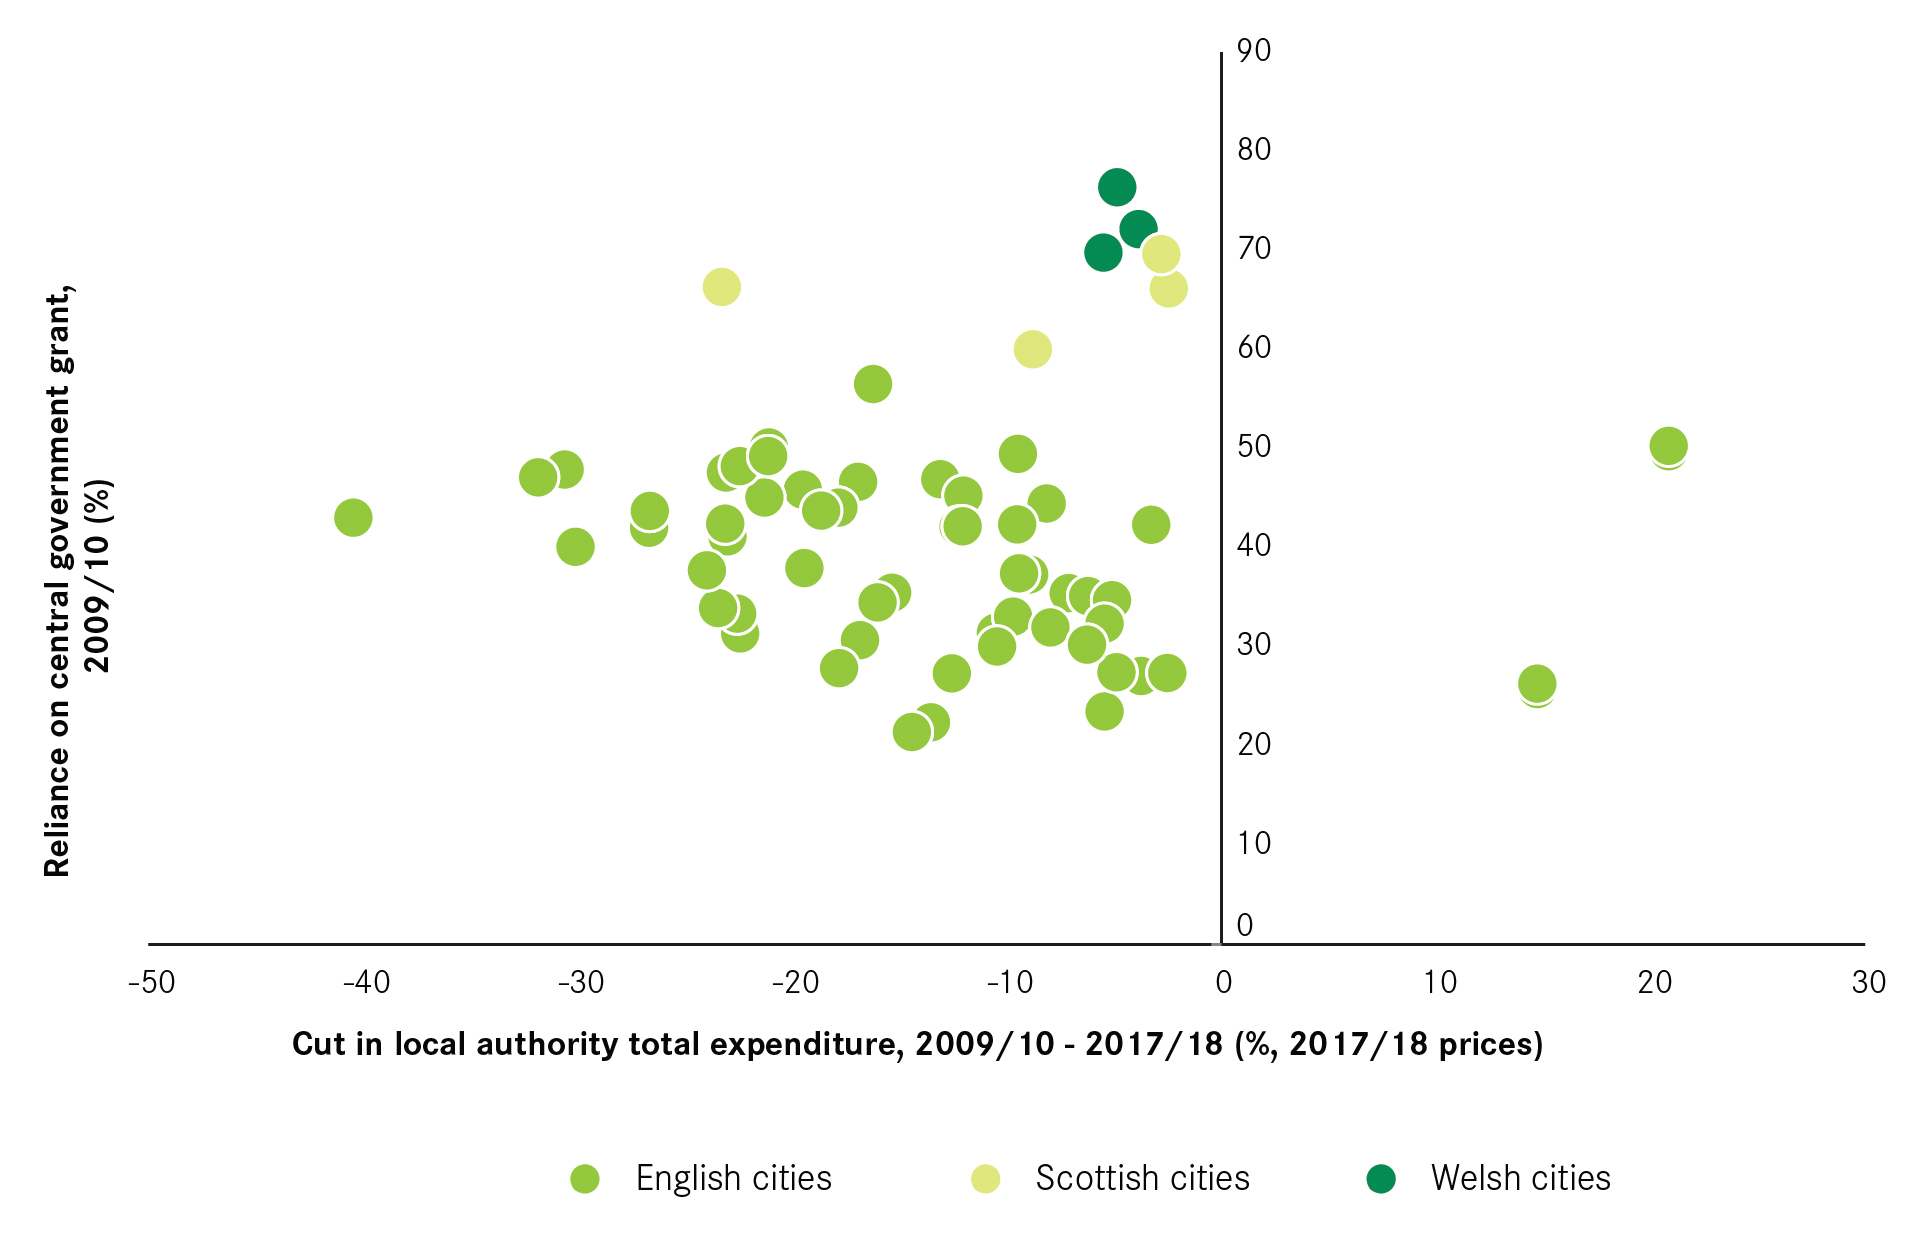
As Figure 9 shows, the outcome was that those English cities most reliant on grant saw the largest cuts in their spending. This resulted from their higher spending requirements which was due to the make-up of their resident populations and their more limited ability to raise money locally through council tax and charging for services. A change in approach since 2016/17 has partially addressed this, and there is now much less of a link between dependence on government grant and spending cuts. But this has not reversed the unequal cuts applied between 2009/10 and 2014/15. In Scotland and Wales reforms to local government finance have been more limited, which explains why cuts in grants have been relatively moderate.
As well as cutting grant, the government has also shifted the way that local government is funded through the part localisation of business rates. While this has in no way offset the scale of cuts imposed, it does reduce local authorities’ reliance on central government grant and allows them to grow their incomes by increasing the size of their economies. In Scotland and Wales, local authorities are still considerably more reliant on grants than their English counterparts. As seen in Figure 9, this was the case in 2009/10, and because no major reform to local finance has been implemented since then, grants still account for more than two-thirds of local government revenues.
Enabling authorities to benefit from the growth in their areas is a positive move. But the shift to larger shares of income being generated locally does pose a particular challenge for those places that have weaker economies and so are likely to struggle to expand their tax base to offset decreases in grant. As Figure 10 shows, with the exception of London and Slough, those English cities with the weakest economies in 2010 are the ones that have seen the largest reduction in spending. This suggests that those cities that have seen the largest cuts to their grant are least able to offset this through economic growth.
Figure 10: Economic performance and change in total spending

How cities have responded to cuts in grant
Central government revenue support isn’t the only source of income for local authorities, and they have responded in three main ways to these cuts – through changing taxes, drawing down their levels of reserves, and becoming more entrepreneurial.
1. Government restrictions have constrained council tax rises
The first way to offset grant cuts is to increase the size of the local tax base. In terms of council tax, there are two ways cities can do this – by increasing council tax rates, and by increasing the number of homes in their area.
But councils have been restricted from increasing council tax bills by central government. This has taken three forms:
- Encouraging council tax freezes. In England, this took the form of offering those setting a freeze extra grant, which was in place between 2011/12 and 2015/16. In Scotland, bills have been frozen since 2008/09, but there has been no freeze in Wales.
- In England, limiting the increases in council tax unless approved via a local referendum. From 2012, councils could only increase council tax by more than 2 per cent (in cash terms) if this increase was approved via a referendum. This has since been increased to 3 per cent, with an additional 3 per cent levy to pay for social care now also permitted. Only one authority – the Bedfordshire Police and Crime Commissioner – has actually run such a referendum, in which the tax increase was rejected.9
- Reforms to council tax relief, which abolished Council Tax Benefit and devolved the decisions about how to give support to low-income families to councils through the new Council Tax Support grant. The impact of this has been to reduce council tax take.
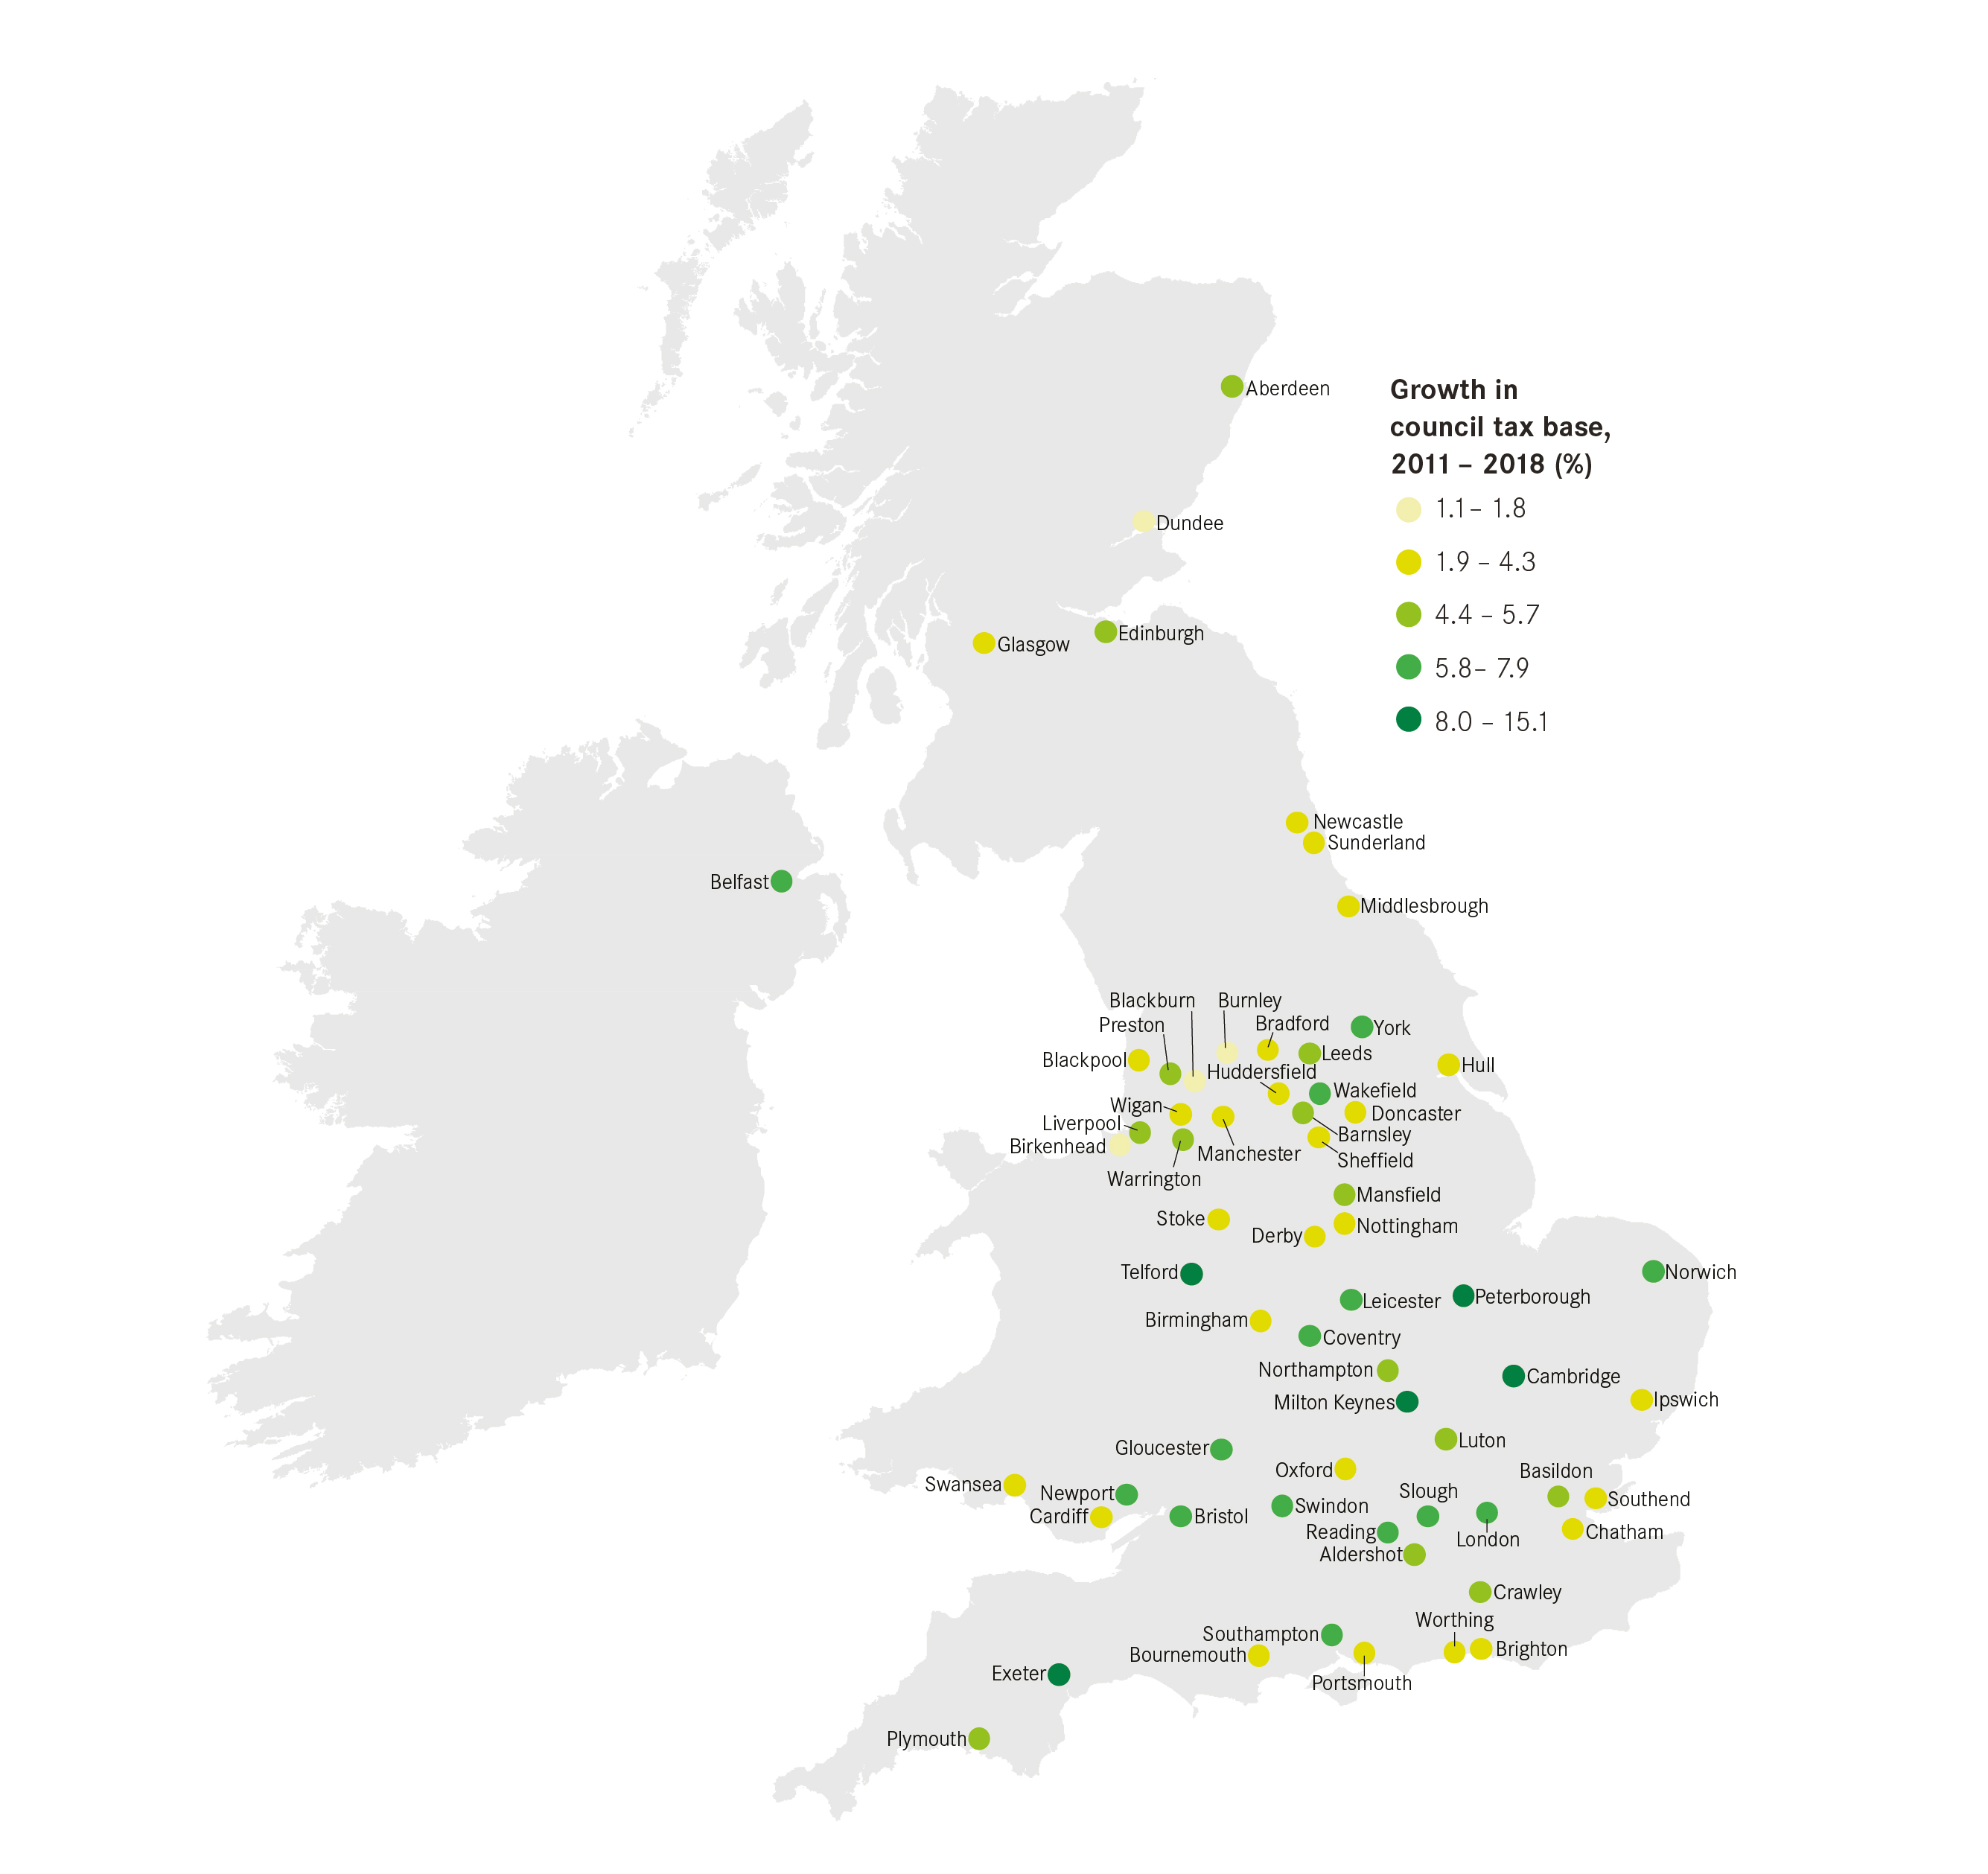
Some have been able to increase their council tax base as a result of house building. Reflecting differences in demand for new homes across the country, there is a clear geography to this (see Figure 11). Cambridge leads this list, with a growth of 15 per cent in the number of taxable homes. And eight of the top 10 are in the south of England.
Figure 11: Growth in the council tax base, 2011-18
2. Councils have increased reserves, removing more money from the system
It may be expected that cuts to grant would lead to authorities using their reserves to cover any shortfall that results. But there is no clear pattern of this happening, and overall there has been an increase in the amount of reserves that local authorities hold.
Figure 12: Change in reserves 2009/10-17/18 (2017/18 prices)
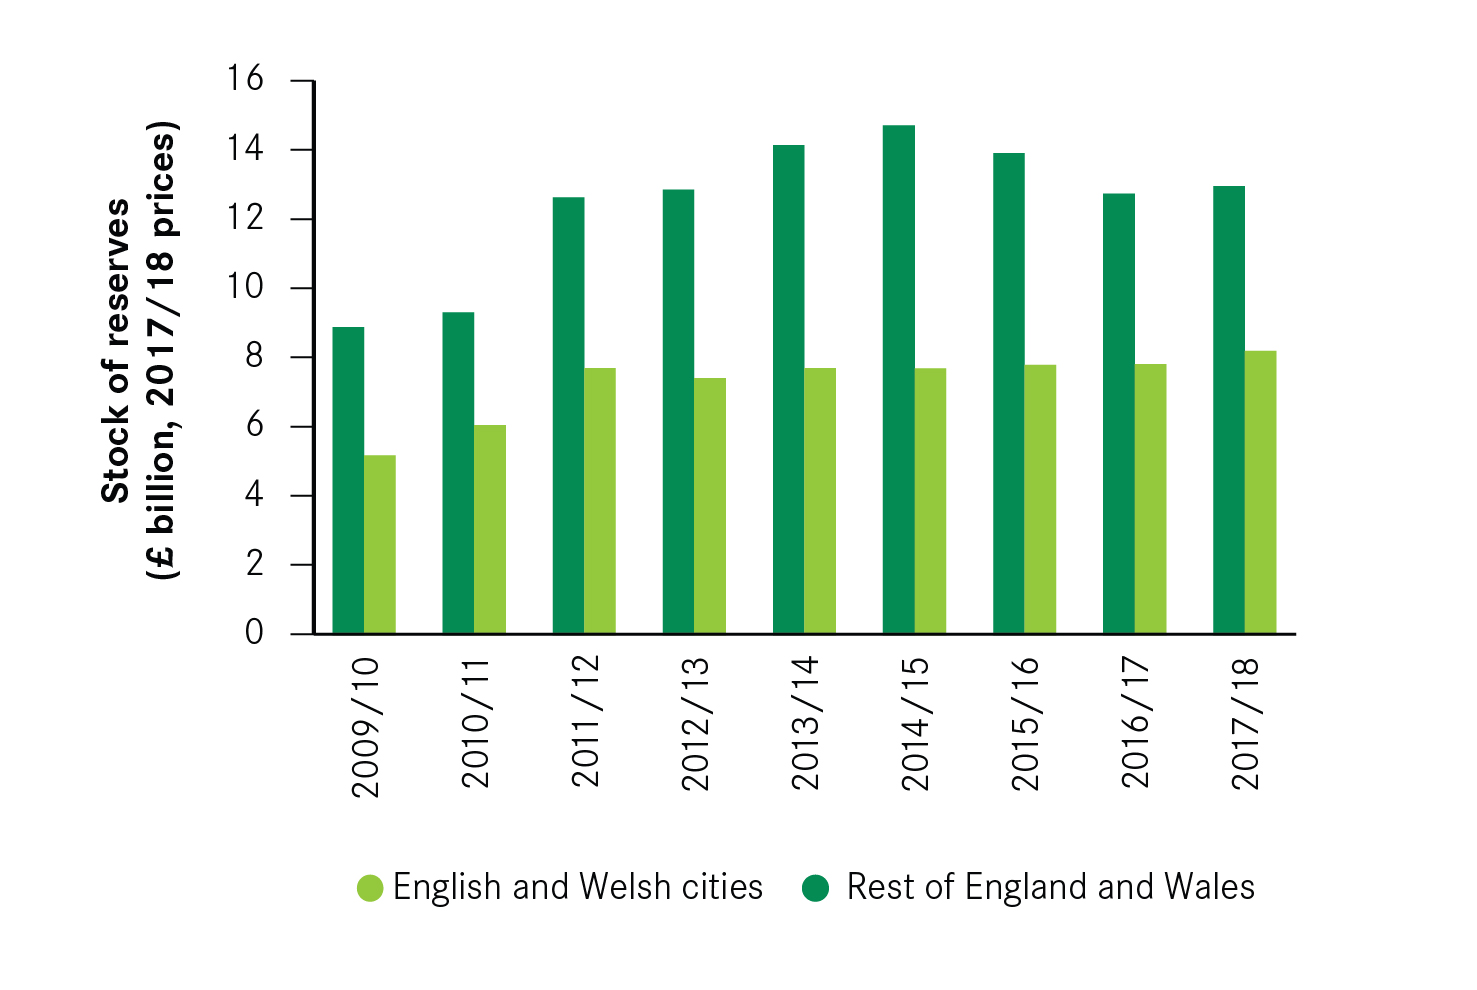
As Figure 12 shows, between 2009/10 and 2014/15, there was a sharp increase in the reserves held by urban and non-urban authorities alike in the expectation that these reserves would be needed to supplement spending in the future.7 These reserves did begin to be used up between 2014/15 and 2016/17, but they have once again increased more recently and are expected to continue to increase in the coming years.11
There is a great deal of variation across English cities within this. Milton Keynes and Coventry have seen the greatest increases in reserves, more than tripling them over the period. But six cities – Bournemouth, Brighton, Chatham, Hull, Stoke and Sunderland – have actually drawn down their reserves. In Chatham and Hull’s case, in particular, this leaves them little cushion against further cuts. Their reserves as a share of total expenditure in 2017/18 were just 6 and 8 per cent respectively – the lowest of any English city.
There is an argument that local authorities as a group have been too cautious in safeguarding reserves, and they should have instead in part been used to fund service spending. But there are two things to note here though. The first is that spending reserves is not a sustainable way of sustaining services as it is not an on-going revenue stream – they will run out. For the majority of cities, the reserves they hold are less than half of their authorities’ spend in 2017/18.
Secondly, this behaviour is the result of a system that sets one year budgets for local authorities and requires them to balance the books each year. This reduces the flexibility that authorities have to manage their budgets and encourages the accumulation of reserves to guard against not being able to balance the books in the future.
3. Some councils have become more entrepreneurial
In response to both the cuts in grant and constraints on the ability to increase council tax, a number of councils have turned to raising money by other means.
One way has been through profit earned from companies owned by councils, which has increased from £86 million in England in 2009 to £412 million in 2017/18. Just over 70 per cent of this increase was from city authorities. Another has been property investment, with a number of cities converting cheap borrowing from the Public Works Loan Board into a revenue stream from the investment. Income from investments rose by £290 million to £1.2 billion in 2017/18. All of this growth was a result of the activities of city authorities.
This growth has been relatively modest though in light of the cuts to funding. Combined these increases equated to around 5 per cent of the cuts to total spending that English local authorities have implemented since 2009/10. Box 5 looks at the investment activities of Portsmouth City Council.
There has also been a modest shift to charging for access to services. Sales, fees and charges funded 16 per cent of all spending in English and Welsh cities in 2017/18 (around £6.7 billion), rising from 14 per cent in 2009/10. Planning and development is the area that has seen the largest increase in its spending coming from this income source, with a 15 percentage point increase (see Figure 13).
Figure 13: Increase in the share of income from sales, fees and charges in English and Welsh cities, 2009/10-2017/18

That said, some cities have seen relatively large increases. York has seen the largest increase in sales, fees and charges as a share of overall spending of any English city, with an increase of 12 percentage points. This meant that a quarter of its spending was raised from this source in 2017/18, more than any other city. York though was somewhat of an outlier for northern cities: eight of the 10 cities that saw sales, fees and charges increase their share the most were in the south (see Figure 14).
How this money is spent is restricted, with most of it having to be spent in the area that it has been raised. For example, most money raised from parking charges must be spent on transport.12 In Manchester, for example, this means that the £35 million raised through parking in 2017/18 could not be used to ease pressure on other service lines. This blunts the usefulness of being able to raise money to support service provision.
There are questions about whether it is advisable for the public sector to be moving into property investment or charging for a greater share of the services they provide. What is clear though is that constraints elsewhere have encouraged a number of them to adopt such an approach.
Figure 14: Increase in the share of income from sales, fees and charges in English and Welsh cities, 2009/10-2017/18

Box 5: Commercial property investment by Portsmouth City Council
Portsmouth City Council developed a commercialisation strategy that could provide extra revenues in the face of cuts to its budget. The aim of the strategy is to stop the authority becoming a ‘hollowed out shell of a council’. This strategy has seen the council take a number of actions, including taking over a shipping company and selling the naming rights of the Spinnaker Tower for £3.5 million.
Investment in commercial property outside of the local authority has been the strategy’s most significant element. Since 2015 the council’s Property Investment Fund has borrowed £108 million from the Public Works Loan Board to purchase 11 assets. These have been chosen purely to provide a financial return without any direct aim to support the local economy. The investments range from a £12.4 million DHL Warehouse in Warwickshire to a £13.2 million Waitrose in Somerset. In 2016/17, the fund made a net revenue contribution of £4.3 million to the city’s budget.
Policy implications
In recent years local government as a whole has had the twin pressures of managing cuts to overall spending and growing demand for social care. The result has been that social care accounts for an ever larger share of day-to-day spending, crowding out other areas of spending. As the National Audit Office notes, this means that increasingly local government will only be able to deliver a narrow core of services focused on social care.13
This is especially the case for cities. While the financial troubles of counties have grabbed much of the attention in recent years, most clearly seen through the high profile problems of Northamptonshire, it is cities in the north of England in particular that have shouldered the largest share of the large cuts that have been imposed on local government.
Most agree that the cuts have improved local government efficiency (despite recent declines, almost two-thirds of people remain satisfied with their council).14 But the scale of these cuts, combined with the lack of flexibility for councils to respond to them and the rise in demand for social care, have put significant pressure on service provision. This is especially the case in northern English cities, which have both been hardest hit by the cuts and have found themselves least able to respond to them because of weaknesses in their economies.
Fairer funding for local government should, therefore, mean additional funding for cities such as these.
But addressing the situation is not just about giving local government more money. There also needs to be a change in the way that local government is funded. There are a number of choices available to central government that go beyond setting the spending envelope in the Spending Review or looking at how this funding is allocated through the Fair Funding Review:
- Reform the way social care is funded. Local authorities should be more than just providers of social care. It is clear that the current model of funding social care is unsustainable, given the current pressures on it, the likely growth in demand and its crowding out of spending on other local government responsibilities. The status quo – particularly in cities such as Sunderland and Blackpool, cannot continue if we want local authorities to provide a range of services and support economic prosperity.
- Give local authorities greater freedom in how they raise funding. The most obvious way is to remove caps on increasing council tax and introducing new bands, allowing local authorities to set tax rates to match the service needs of their areas. Another way is to allow authorities to levy additional taxes, such as a tourist tax.
- Set multiyear budgets. Currently, local authorities are given year by year budgets and must balance the books each year. This creates uncertainty and makes future planning more difficult, as illustrated by the recent delay in announcing the local government finance settlement for 2019/20 as a result of Brexit. Setting longer term budgets, with three or five year time horizons, both gives greater certainty and gives authorities more flexibility in how they manage their budgets between years.
- Allow sales fees and charges raised in one service area to be spent on any service area. Having the ability to raise money in one area, for example parking charges, does next to nothing to address shortfalls in funding in other areas because it can’t be transferred. Councils should have the freedom to make their own decisions about how to best allocate this spending to improve the overall level of service provision in their areas.