
05Potential urban drivers behind London’s productivity slowdown
The previous sections suggest London is becoming less competitive in the global economy as its productivity growth has stagnated. There are two main categories of reasons that likely explain this underperformance in the past decade.
The first is macroeconomic factors, such as monetary policy and Brexit. On the former, all developed countries had loose monetary policy over the period, so it seems unlikely that this is a major source of divergence.24 On the latter, this may well have had an impact, but it is difficult to quantify. But as shown above, weak productivity growth in London emerged prior to the Brexit vote, which suggests that it cannot fully explain the underperformance of the Capital.25
The other category is London-specific factors. These drivers are very challenging to disentangle given the data available, but the following section puts forward two that are likely to have impacted the productivity slowdown:
- A shift in investment towards real estate, in an environment of rising commercial property costs.
- A relative decline in attracting and retaining talent, both domestically and internationally, due to housing and other policy constraints, such as migration.
These hypotheses were developed based on existing research into factors behind the UK productivity slowdown and local factors that can hinder innovation around the world. They are supported by trends observed in London over the past two decades.
Potential factor 1: Constraints push real estate costs upwards, which act as a barrier for businesses and crowd out productivity-enhancing investment
Property costs appear to have been taking an ever larger share of output in London at a time when investment in productivity-driving ‘intangible’ investment, as a share of GDP, has stagnated. The former may be increasingly crowding out the latter, with implications for the Capital’s productivity growth. Research in this section supports this hypothesis by showing that higher real estate prices could impact innovation negatively and the lack of intangible investment is one of the drivers of the UK’s low productivity growth.
London remains more expensive than its peers, despite poor productivity growth
The Capital is an expensive place to do business and remains so despite its recent productivity challenges. Figure 10 shows that the cost of prime office space in London – which includes rents and taxes – has been significantly higher than New York and Paris since 2001 (ranging from twice to three times over the period). Pre-crisis, this could in principle have been because of London’s strong performance making it a more attractive place to locate. But the analysis above shows that this cannot explain this gap persisting after the financial crisis.2627
Figure 10: Prime office real estate in London has remained much more expensive than in Paris and New York, despite lower productivity growth

Office real estate prices also grew much faster than in the rest of England and Wales between the financial crisis and the pandemic. Between 2010 and 2017, rateable values – a proxy for real estate prices – rose by 27 per cent in London, which is significantly more than for England and Wales as a whole (3 per cent).28
Given that productivity in London hasn’t grown, increased real estate costs are more likely to reflect an historical shortage of office space rather than an absolute increase in the value of these locations to incumbent firms.
Previous research has pointed to the planning system playing a central part in existing supply issues. Regulatory constraints contribute to higher commercial property costs in London than in its international peers and other UK cities.29 And the case-by-case nature of the planning system distorts incentives. Developers appear to choose ‘trophy architects’ to design tall buildings in an attempt to get more favourable planning permissions. These projects are, on average, 15 per cent more costly because of their design, but an architect’s reputation can mean an extra 14 floors are allowed on a given site. As a consequence, London – unlike other global cities – has a high proportion of skyscrapers designed by trophy architects.30
A second factor could be the Capital’s increasing role as a safe haven for real estate investment in the context of post-financial crisis regulations and low interest rates. In a context of low interest rates (negative in real terms) and political uncertainty, real estate assets in global cities like London are likely to have been perceived as safe and liquid assets, increasing their respective demand.31
These constraints are likely to have driven the relative growth of real estate in the Capital
As London faced a combination of low productivity growth and increasing commercial property prices, real estate became a larger part of its total economy. Real estate (excluding imputed rentals) and rental activities rose from 4.9 per cent of GDP in 2008 to 6.5 per cent in 2019. During the same period, the construction sector remained relatively stable at around 5 per cent, which points to supply (construction) not being able to fully respond to higher property prices. This suggests that rising rents and other costs – in an environment where demand continued rising because of the expansion of London’s economy even as productivity flatlined – fuelled the growth of real estate.
Figure 11: In the past decade, unlike some of its peers, London’s economy moved towards real estate and its high skilled exporting base became relatively smaller

While the real estate sector became larger, London’s knowledge-intensive exporting base – the part of the economy that mostly determines productivity – became comparatively smaller. These services (except for finance) grew, but at a significantly slower pace than the real estate sector. As the figure above shows, this combination is not seen in other global cities where productivity growth was stronger than in the Capital. Since 2014, London has become the city where real estate activities take the largest share of its economy, surpassing New York (Figure 24, Appendix 2).
High real estate costs can hinder innovation and productivity
This pattern of high and increasing real estate costs has at least two implications. Firstly, without increasing profits, it diverts business spending away from other areas. This includes productivity-enhancing investments, which has implications for innovation and productivity growth. The second is that high real estate costs will likely discourage new businesses from locating in London.
Research from other regions supports this. A study of 288 Chinese cities found that when real estate prices (housing) rose above a certain level, it reduced innovation, as measured by patents, due to R&D spending being crowded out and the loss of skilled workers.32 Similar evidence was uncovered in Florida.33 In addition, findings in the US and Spain point to property-owning firms being able to borrow and invest more, as they have collateral.34 This can benefit property-owning incumbent firms – even if they are less productive – and can have a negative long-term impact by blocking the entry of more productive challenger businesses.
Investment in London moved from intangibles towards buildings and structures
There is a strong positive relationship between intangible investment and productivity across the UK (see Box 5), and intangible assets are becoming increasingly important in developed economies.35 This includes software and databases, and R&D.36
For the UK, the recent problem has been that its productivity slowdown has been most notable in more intangible-intensive activities.37 At the same time, growth of London’s intangible investment as a share of GDP has been relatively weak when it should be playing an ever-larger role in the economy as it becomes ever more knowledge-based.38 In the decade after the financial crisis, the Capital’s investment moved towards tangible assets, especially buildings and structures, while intangible investment remained relatively stagnant. Figure 12 shows that investment in London (as a share of GDP) increased slightly but was fully driven by buildings and structures. Two decades ago, £0.65 was spent on intangibles for every £1 invested in buildings and structures. In 2019, it fell to £0.37. This means that while overall investment rose, it declined in other areas (including intangibles), as a share of GDP.
Figure 12: London’s investment growth was entirely driven by buildings and structures

Between 2004 and 2019, while intangible investment remained mostly unchanged in London (as a share of GDP), the rest of the country saw an increase of 0.8 percentage point. Box 5 shows how London declined in relative terms during this period.
Box 5: Geography of intangible investment in the UK at the sub-national level
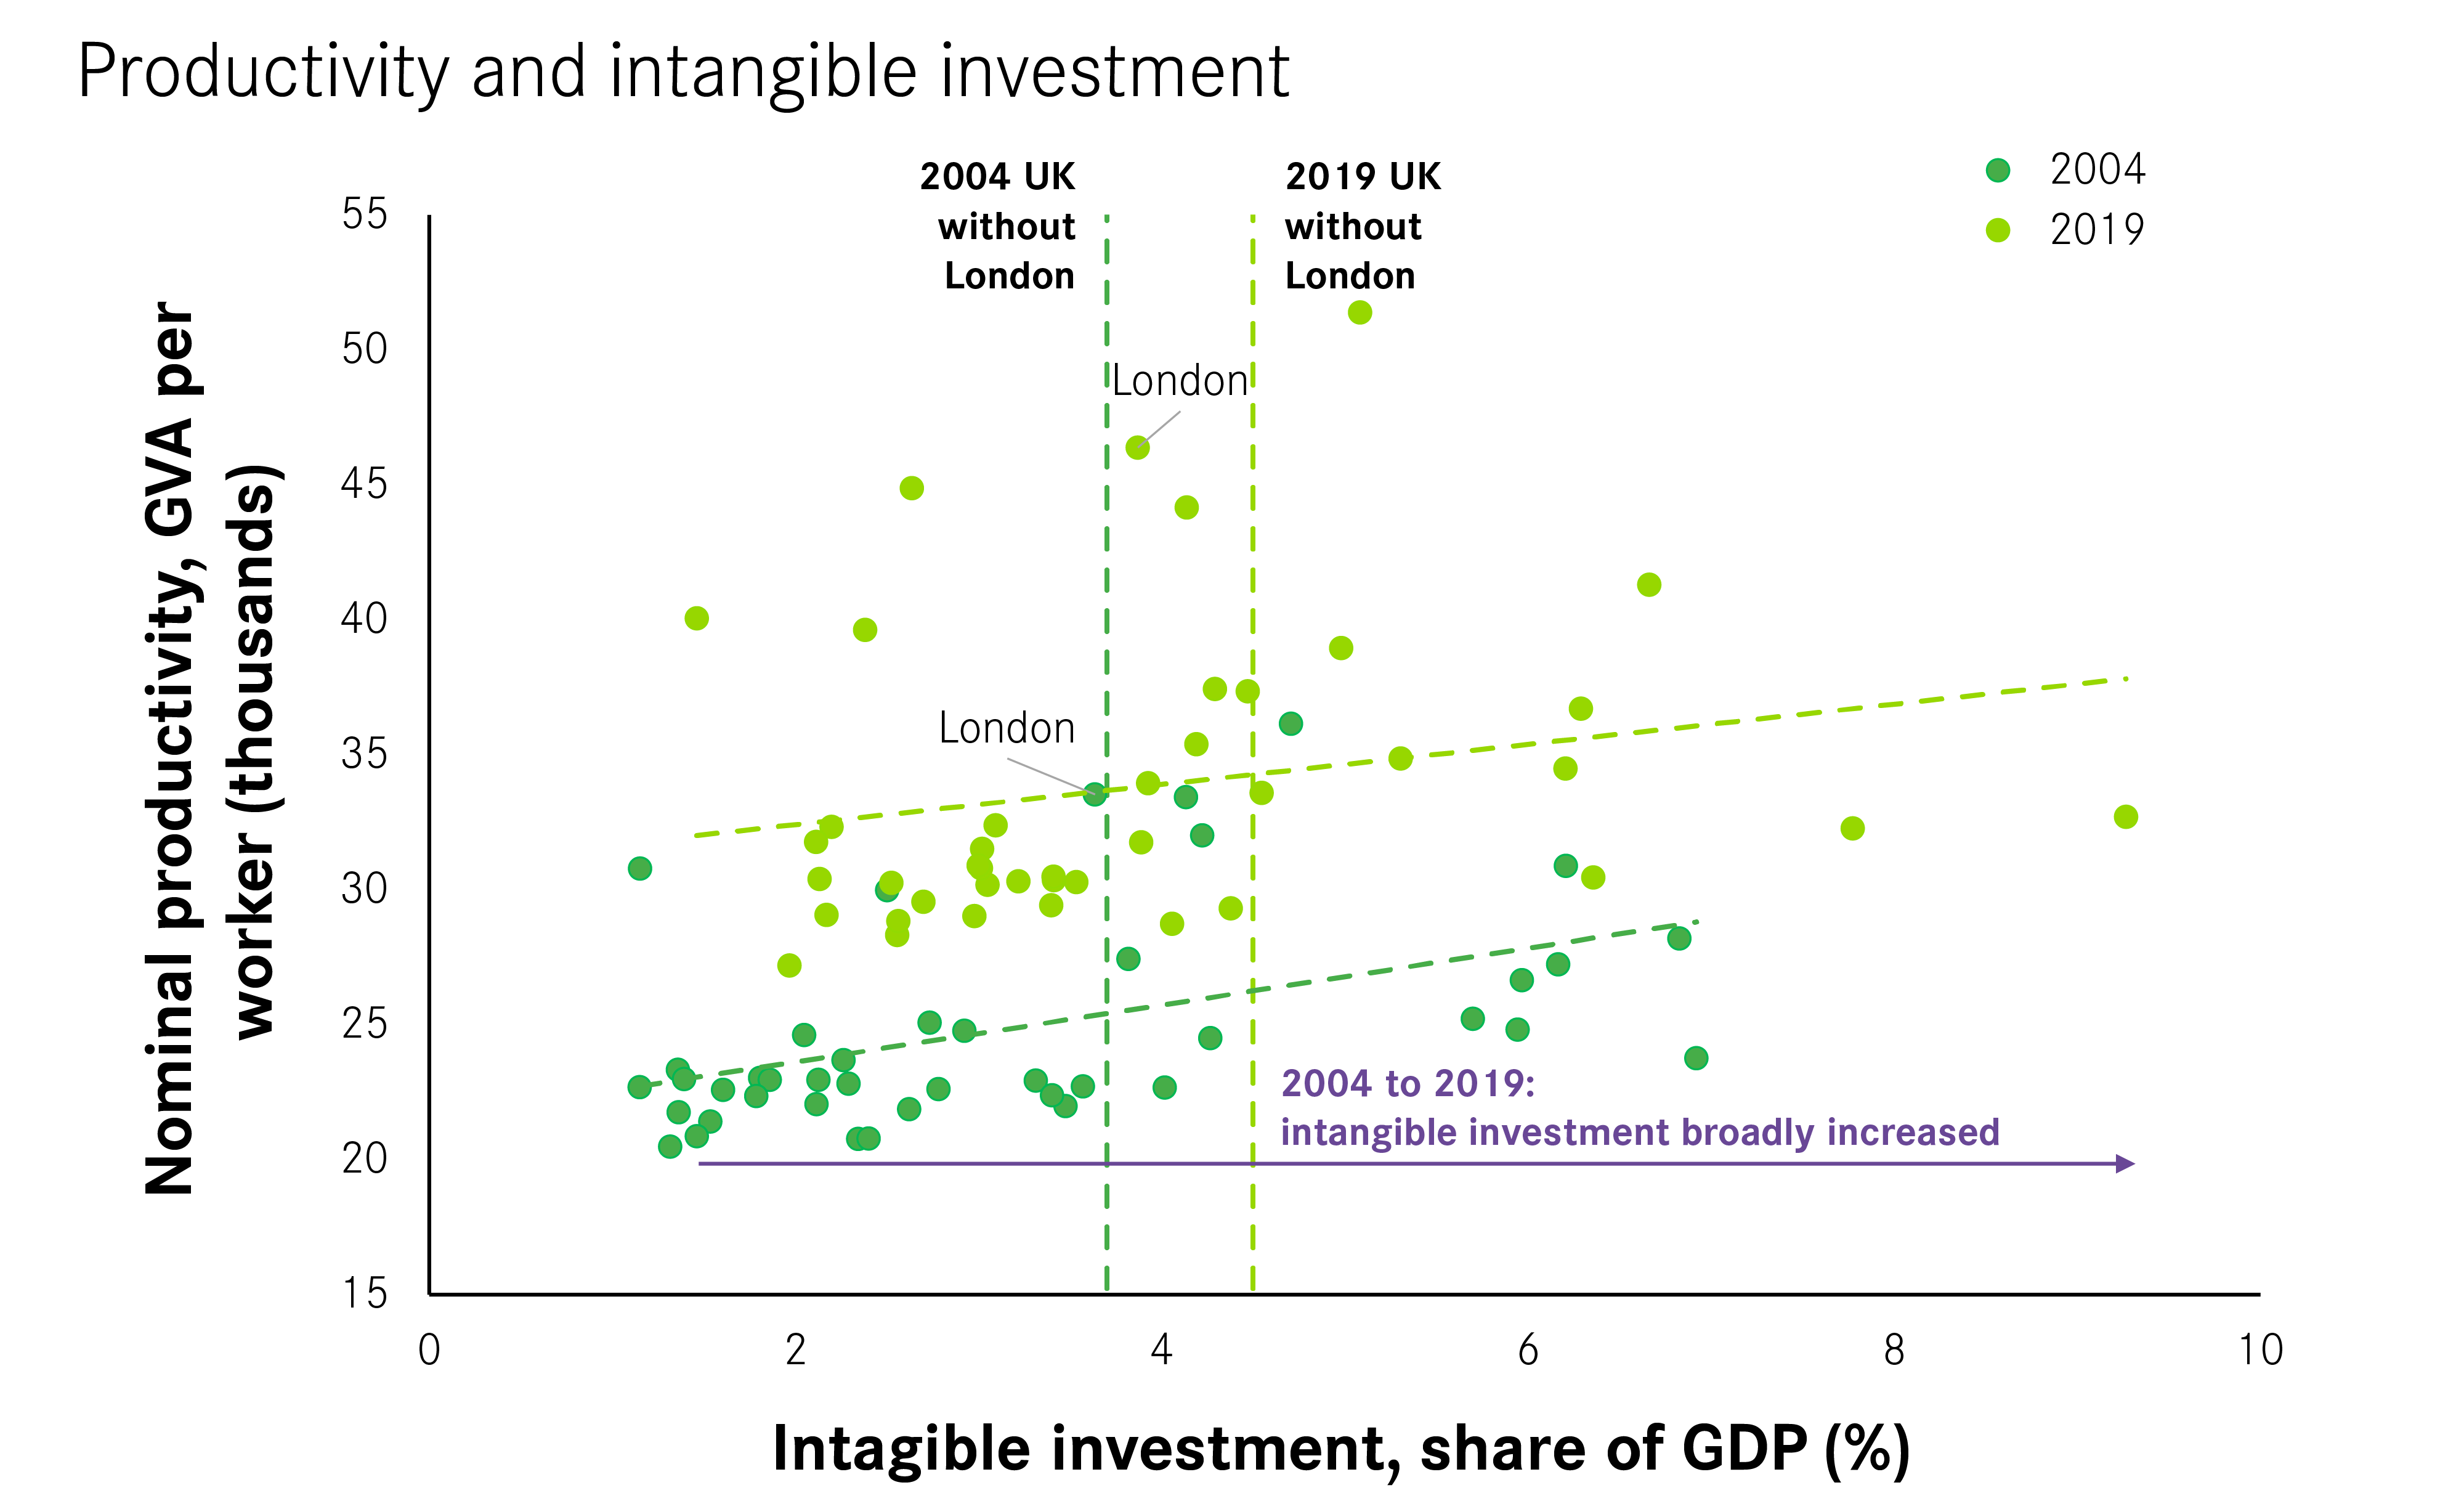
Intangible investment tends to be greatest in areas with higher productivity levels. Figure 13 shows two findings – a relationship between investment in intangible assets and productivity, and an overall increase in investment in intangibles between 2004 and 2019 (with most regions moving towards the right of Figure 13). However, London’s position remained broadly unchanged, which given the increasing role that intangibles should be playing in an ever more knowledge-based economy is concerning. London had the 11th highest share of intangible investment as a share of its GDP in 2004 but dropped to 17th by 2019.
Figure 13: From 2004 to 2019, several regions started investing more in intangible assets than London, as a share of their respective GDP
Source: ONS. Regional (ITL2) GFCF estimates by asset type: Experimental data. Note: Intangible assets are also known as intellectual property products; computer software and databases are allocated to the region where they are used and are estimated using employee location; R&D is allocated according to where the investment takes place using survey data.
This poor performance preceded the financial crisis (although the nature of investment means the decline may not have been felt immediately).39 From 2004 until the crisis, the Capital’s investment in intangibles (as a share of GDP) fell and has remained stable since (see Figure 14). This has seen the gap between London and the Greater South East widen, while the gap between London and areas outside of the Greater South East has narrowed.
Figure 14: London’s investment in intangibles has diverged from the Greater South East, while the rest of the country has converged with the Capital

Investment at the sector level supports the crowding out hypothesis
Another factor behind the comparatively low investment in intangibles in London could be that its industrial structure distorts the figures. For example, sectors like finance may be less reliant on this than others. However, investment by sector, instead of asset type as shown above, suggests this is not the case. Real estate investment increased its share from 22 per cent of the total (3.1 per cent of GDP) in 2007 to 31 per cent in 2019 (5.9 per cent). It surpassed the investment in knowledge-intensive exporting services around 2008, which fell significantly in the past two decades.
This did not happen in the rest of the country, where real estate investment did not increase as a share of total investment (see Figure 26 in Appendix 2).
Figure 15: A higher share of London’s investment has been allocated to the real estate sector, while the share allocated to the knowledge-intensive export sector has fallen

R&D spending by businesses suggests that London is also lagging other global cities
Data on investment in knowledge-creating activities is more difficult to come by at the international level. Looking at R&D spending across comparator cities suggests that recent investment patterns in London may have compounded its poor performance in this area relative to its peers.40
The Capital’s overall level of R&D is relatively low (see Figure 16). This is particularly concerning when analysing how much private businesses invest in R&D relative to non-business spending (government, universities and third sector) – it accounts for around 50 per cent of all R&D spending in London. This is below Brussels (60 per cent), Paris (68 per cent) and Stockholm (74 per cent).
Figure 16: London’s R&D spending is comparatively low, especially business investment

Once again, London’s underperformance could be partially explained by its sectoral composition. Data on the 2,500 largest R&D companies globally shows the R&D intensity in finance (a sector where the Capital is historically strong) is relatively low, while sectors such as pharma and software and computer services are the highest spenders.41 But this could also point to London’s relative struggle in developing new sectors associated with higher R&D intensity since the financial crisis.
The ONS recently revised R&D figures at the national level, which moves the UK’s spending upwards, although it is still behind several developed nations. Estimates at the local level are not available yet. However, London’s business R&D spending (likely to be revised) is relatively low even within the UK (see Figure 29, Appendix 1).42
Potential factor 2: Rising housing costs and migration policy restricts London’s ability to attract talent
Skilled workers are a key component of the Capital’s knowledge economy. Rising house prices at a time of stagnant wages, and restrictions on the flow of international workers, are two constraints on its ability to attract talent, especially from abroad.
House prices in London grew significantly faster than the national average and international peers
Despite low productivity growth and wage stagnation, London’s house prices have risen sharply since the financial crisis. In 2007, it was already the most expensive housing market in the UK – nominal mean house prices were around £348,000 – and since then it has had the highest price increase of UK cities (82.9 per cent, to £637,000).
The Capital also looks like an outlier when compared with other global cities. According to the OECD, nominal house prices rose 3.3-fold since 2000, significantly more than the regions including New York and Paris. Stockholm has come closest, especially in the past decade, but it is important to note that this has been accompanied by greater productivity growth.43
Figure 17: Despite low productivity growth, London house prices grew much faster than in other global cities

London’s wage premium is being consumed by housing
These increases have eaten into wages. Figure 18 shows that London’s median household income after housing costs has been converging with the national average in recent years. Following the financial crisis, its wage premium (after housing costs) was around 5 per cent but on the eve of the pandemic it was close to zero.44 The Capital does not have a premium compared to the national median, despite having much higher productivity.45
Figure 18: The London wage premium has disappeared as house prices have continued to increase

Having other areas converging towards London would not be negative if it was the result of strong growth elsewhere in the country. Though this was not the case. The fall in the Capital’s wage premium, shown in Figure 18, is almost entirely driven by higher housing inflation in London, instead of strong income growth in other areas.46
These changes do not take account of the pound weakening since 2007. It is now worth 20 per cent less against the Euro and 44 per cent less against the dollar.47 This has further eroded the pay available in London for potential international migrants.
Previous studies have shown that high house prices can hamper the ability of a city to attract workers. Research in Taiwan, for example, revealed that when prices rise above a certain point, it can cause outflows from richer urban areas.48 Similar results have been found in Chinese cities and German regions.49 The data below suggests the same has happened in London.
A restrictive migration policy is likely to affect London disproportionally
The Capital’s ability to attract global talent depends on national migration policy, which has become more restrictive in the past decade. In 2012, the UK government set an annual cap for Tier 2 visas (skilled workers’ visas), and the ‘graduate’ visa scheme was ended (it was subsequently reintroduced in 2021). Brexit created further friction in attracting talent from the EU.
These tighter restrictions are likely to have had a disproportionate impact on London. In 2020, the Migration Observatory estimated that 40 per cent of workers born outside the UK, who work in the highest-skilled jobs, were based in London. This is despite the Capital accounting for just 15 per cent of all jobs.50
It is concerning because immigration, especially among higher skilled workers, has a positive impact on the UK’s productivity; London-specific research found companies with more diverse boards were more likely to introduce new innovations.5152
Stagnating wages and tighter migration policy have coincided with a flatlining stock of human capital
ONS human capital estimates – a metric that gauges lifetime earnings – show London’s human capital per worker growing significantly (and faster than all other regions) between 2004 and 2011. But it stagnates after the financial crisis, around the time London’s wage premium disappears. As the slowdown was not as abrupt elsewhere in the UK, there has been convergence between the two (Figure 30, Appendix 2).
Figure 19: London's human capital stock has stagnated

Foreign population data suggests that London became relatively less attractive compared with the period before the financial crisis
Analysis of the foreign-born population living in London and inflows from foreign labour shows some concerning trends, especially post-crisis.
When comparing the UK’s visas for skilled workers and the US’s H1B visas – which while not the same are comparable – the UK has been diverging from the US for much of the past decade.53 The US was gradually increasing its number of visas per capita until the pandemic, but the same cannot be said about the UK, which remained below 2009 levels until 2019 (Figure 20).
Figure 20: The US has been issuing more visas for high-skilled labour than the UK

The relative attractiveness of the Capital, when compared with the rest of the country, seems to be lower than it once was for nationalities associated with higher levels of skills.
Figure 21 analyses London residents born in countries with particularly high income levels (e.g. Germany, the US and Norway) and suggests it became relatively less attractive in the past decade.54 From 2000 to 2007, the share of the Capital’s population from these countries increased rapidly, but stabilised after the financial crisis. This trend contrasts with the rest of the UK, where the share of residents from these countries has continued to rise over the entire period.
Figure 21: London is no longer increasing its share of residents from highly productive countries

National Insurance registrations (Nino) – a proxy for inflows of international labour – support the findings above. Those from regions where applicants tend to have skills above the average (see the methodology for Figure 22) show London’s share of new applicants has been declining in recent years.55
Figure 22: London has become relatively less attractive for applicants with higher than average skill levels

London accounted for more than half of the registrations and its share was growing until 2011. However, over the past decade, it has been gradually falling and is currently below 50 per cent – levels not seen since the mid-2000s.56
The UK has been affected by several shocks that reduce its ability to compete for global talent (e.g. currency fluctuations and migration policy). Recently, the Innovation Strategy recognised the importance of attracting foreign talent by including the ‘high potential individual’ and ‘scale-up’ visa routes.57 These are welcome to promote innovation and productivity growth in the UK and London specifically. However, the findings above highlight that other factors are affecting the Capital’s relative attractiveness. These are likely to be associated with housing as London’s wage premium has been consumed by accommodation costs in recent years.
Summary
Four concerning patterns have emerged in London over the past 10 to 15 years. The first is that commercial property costs have continued to rise despite flatlining productivity. The second is the rise of investment in real estate over intangible investment, which suggests the former has squeezed spending on the latter with implications for productivity growth. The third is that house prices have continued to rise despite poor wage growth, eating into earnings after housing costs. And the fourth is that the flow of skilled workers into the Capital seems to have slowed.
Being able to make causal links between these factors is difficult, as is determining the effect they have had on London’s economy. That said, it is possible that trend one has had an impact on trend two, and that trend three has had an impact on trend four. And, in turn, given research elsewhere, it is plausible that these factors combined have limited the Capital’s productivity growth.