03What has driven growth in housing wealth across city economies?
Housing wealth is shaped by not just the high and growing demand for housing in some cities with strong economies, but also the insufficient supply of new homes in these places. And, as this section shows, this divergence in wealth has not resulted directly from cheap lending or monetary policy, but rather from the inability of finance to increase supply in cities with successful economies and high demand for housing.
Housing equity has increased the most where demand has been stoked by strong economies
The economic performance of cities varies across the country. The capacity of cities to provide high wages, highly-productive work, and knowledge shapes the decisions people and firms make about where to locate, and are traded off against costs such as housing and commute times. This economic geography helps determine demand for housing, and thereby where housing wealth grows and who acquires it.
Cities’ ability to offer high wages is closely related to their growth in housing equity. This can be seen in Figure 3 as cities which have higher average wages for their residents have seen the greatest increases in housing wealth. For instance, average housing wealth in Oxford grew by £89,000 from 2013 to 2018, and residents’ wages in 2018 were £523 a week on average. In Doncaster, average equity grew by £5,000, while weekly resident’s wages were £413 on average.
Demand for housing is not the same everywhere. Cities with high resident wages give workers access to many high-paying jobs, which in turn drives demand from people for housing. The characteristics of these cities are not temporary, but are instead caused by longer-term factors such as the skills available in their labour market, their size, and how knowledge intensive their exporting firms are.9
The supply of new homes is not linked to cities’ demand for housing
When demand to live in a city grows, in the short term house prices will increase and, by extension, so will housing equity for local homeowners. Stabilising local prices and reducing housing wealth inequality over the longer term requires supply to respond and increase in certain cities as their demand and prices grow.
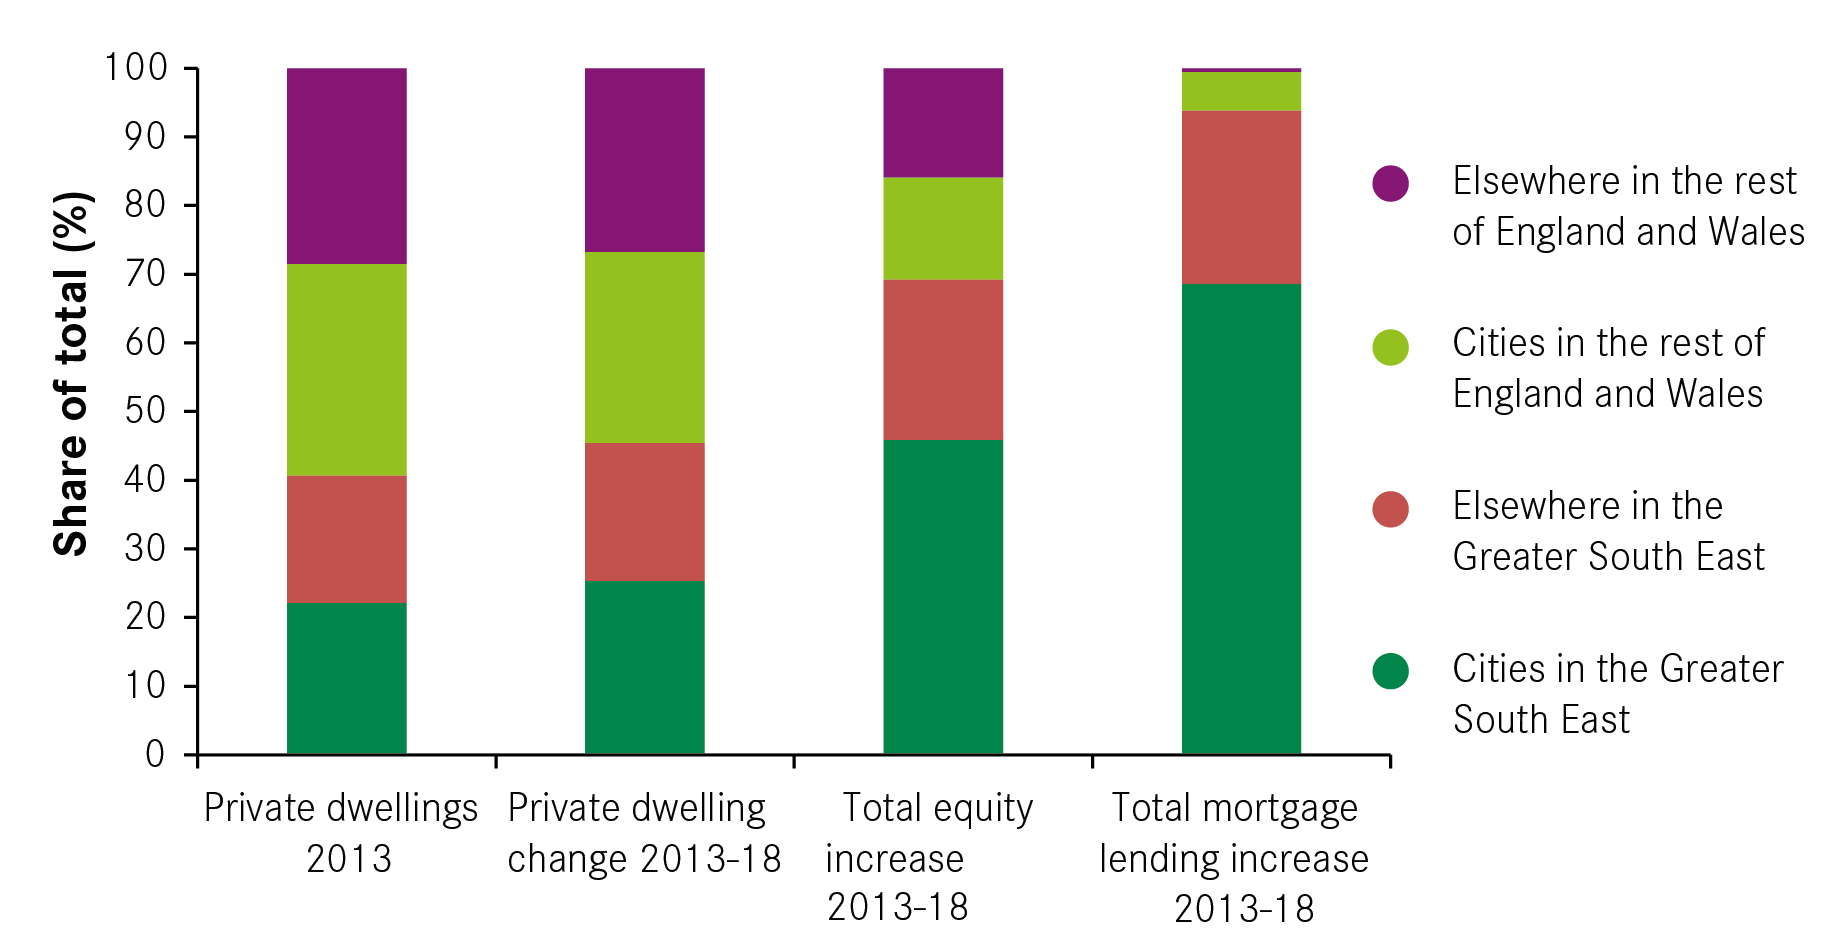
Although demand for housing varies considerably across the country, the supply of new homes does not. It can be seen in Figure 4 that new housing from 2013 to 2018 has largely replicated the existing distribution of housing – 40 per cent of existing homes in 2013 were in the Greater South East, as were 45 per cent of all new homes from 2013 to 2018. But the Greater South East has seen 69 per cent of all of the growth in housing wealth in England and Wales since 2013, or £842 billion because demand to live in the Greater South East is much higher than this supply.
The reason homeowners in the Greater South East capture this wealth is that, while demand is shaped by the performance of urban economies, the supply of new homes is not. Looking at Figure 5, it is clear that the strength of the local labour market bears no relationship to the amount of new homes that cities build. While cities with high wages and equity, like Cambridge and Milton Keynes, are building lots of new homes, others like Southend, Aldershot, and Brighton build far fewer than cities with lower resident wages like Wakefield or Telford.
Rather than being shaped by the factors that influence demand for housing, the supply of new homes in cities is unpredictable. The consequence of this is that supply struggles to adjust house prices downwards in these cities when demand grows. As a result, housing wealth in these cities with high resident wages grows far faster than in other cities, not just because of the strength of the local economy but also due to the scarcity of new homes.
Finance has not driven these divergences in
housing wealth
A commonly heard explanation for the current state of housing affordability is that cheap finance and ‘speculation’ artificially boost demand.104 The role of city economies in these arguments is typically overlooked.
If cheaper lending were the sole cause of increasingly-expensive housing then, as credit becomes cheaper nationally and globally due to British and US monetary policy, we would expect to see house prices and housing wealth grow everywhere in the UK at a similar rate.
Although this may have been the case before the global financial crisis in 2008-9, it has not been the case since. Prior to that crisis, Figure 6 shows that real house prices varied between cities, but that the rate of increase was roughly similar in cities across England and Wales. Since the global financial crisis, we have seen far more divergence. While cities with struggling economies like Hull have barely seen a recovery in real prices since 2009, cities with high resident wages like Brighton and Cambridge have experienced large increases to house prices and thereby housing wealth.
This does not mean that house prices will rise forever in cities with high wages, as cyclical effects on prices still matter. In some expensive cities, it can be seen in Figure 6 that house price growth in real terms has stagnated or started to fall in the period from 2016 to 2018. But the large price increases seen in these cities cannot be solely cyclical, because they have diverged from other cities which have experienced similar cyclical conditions.
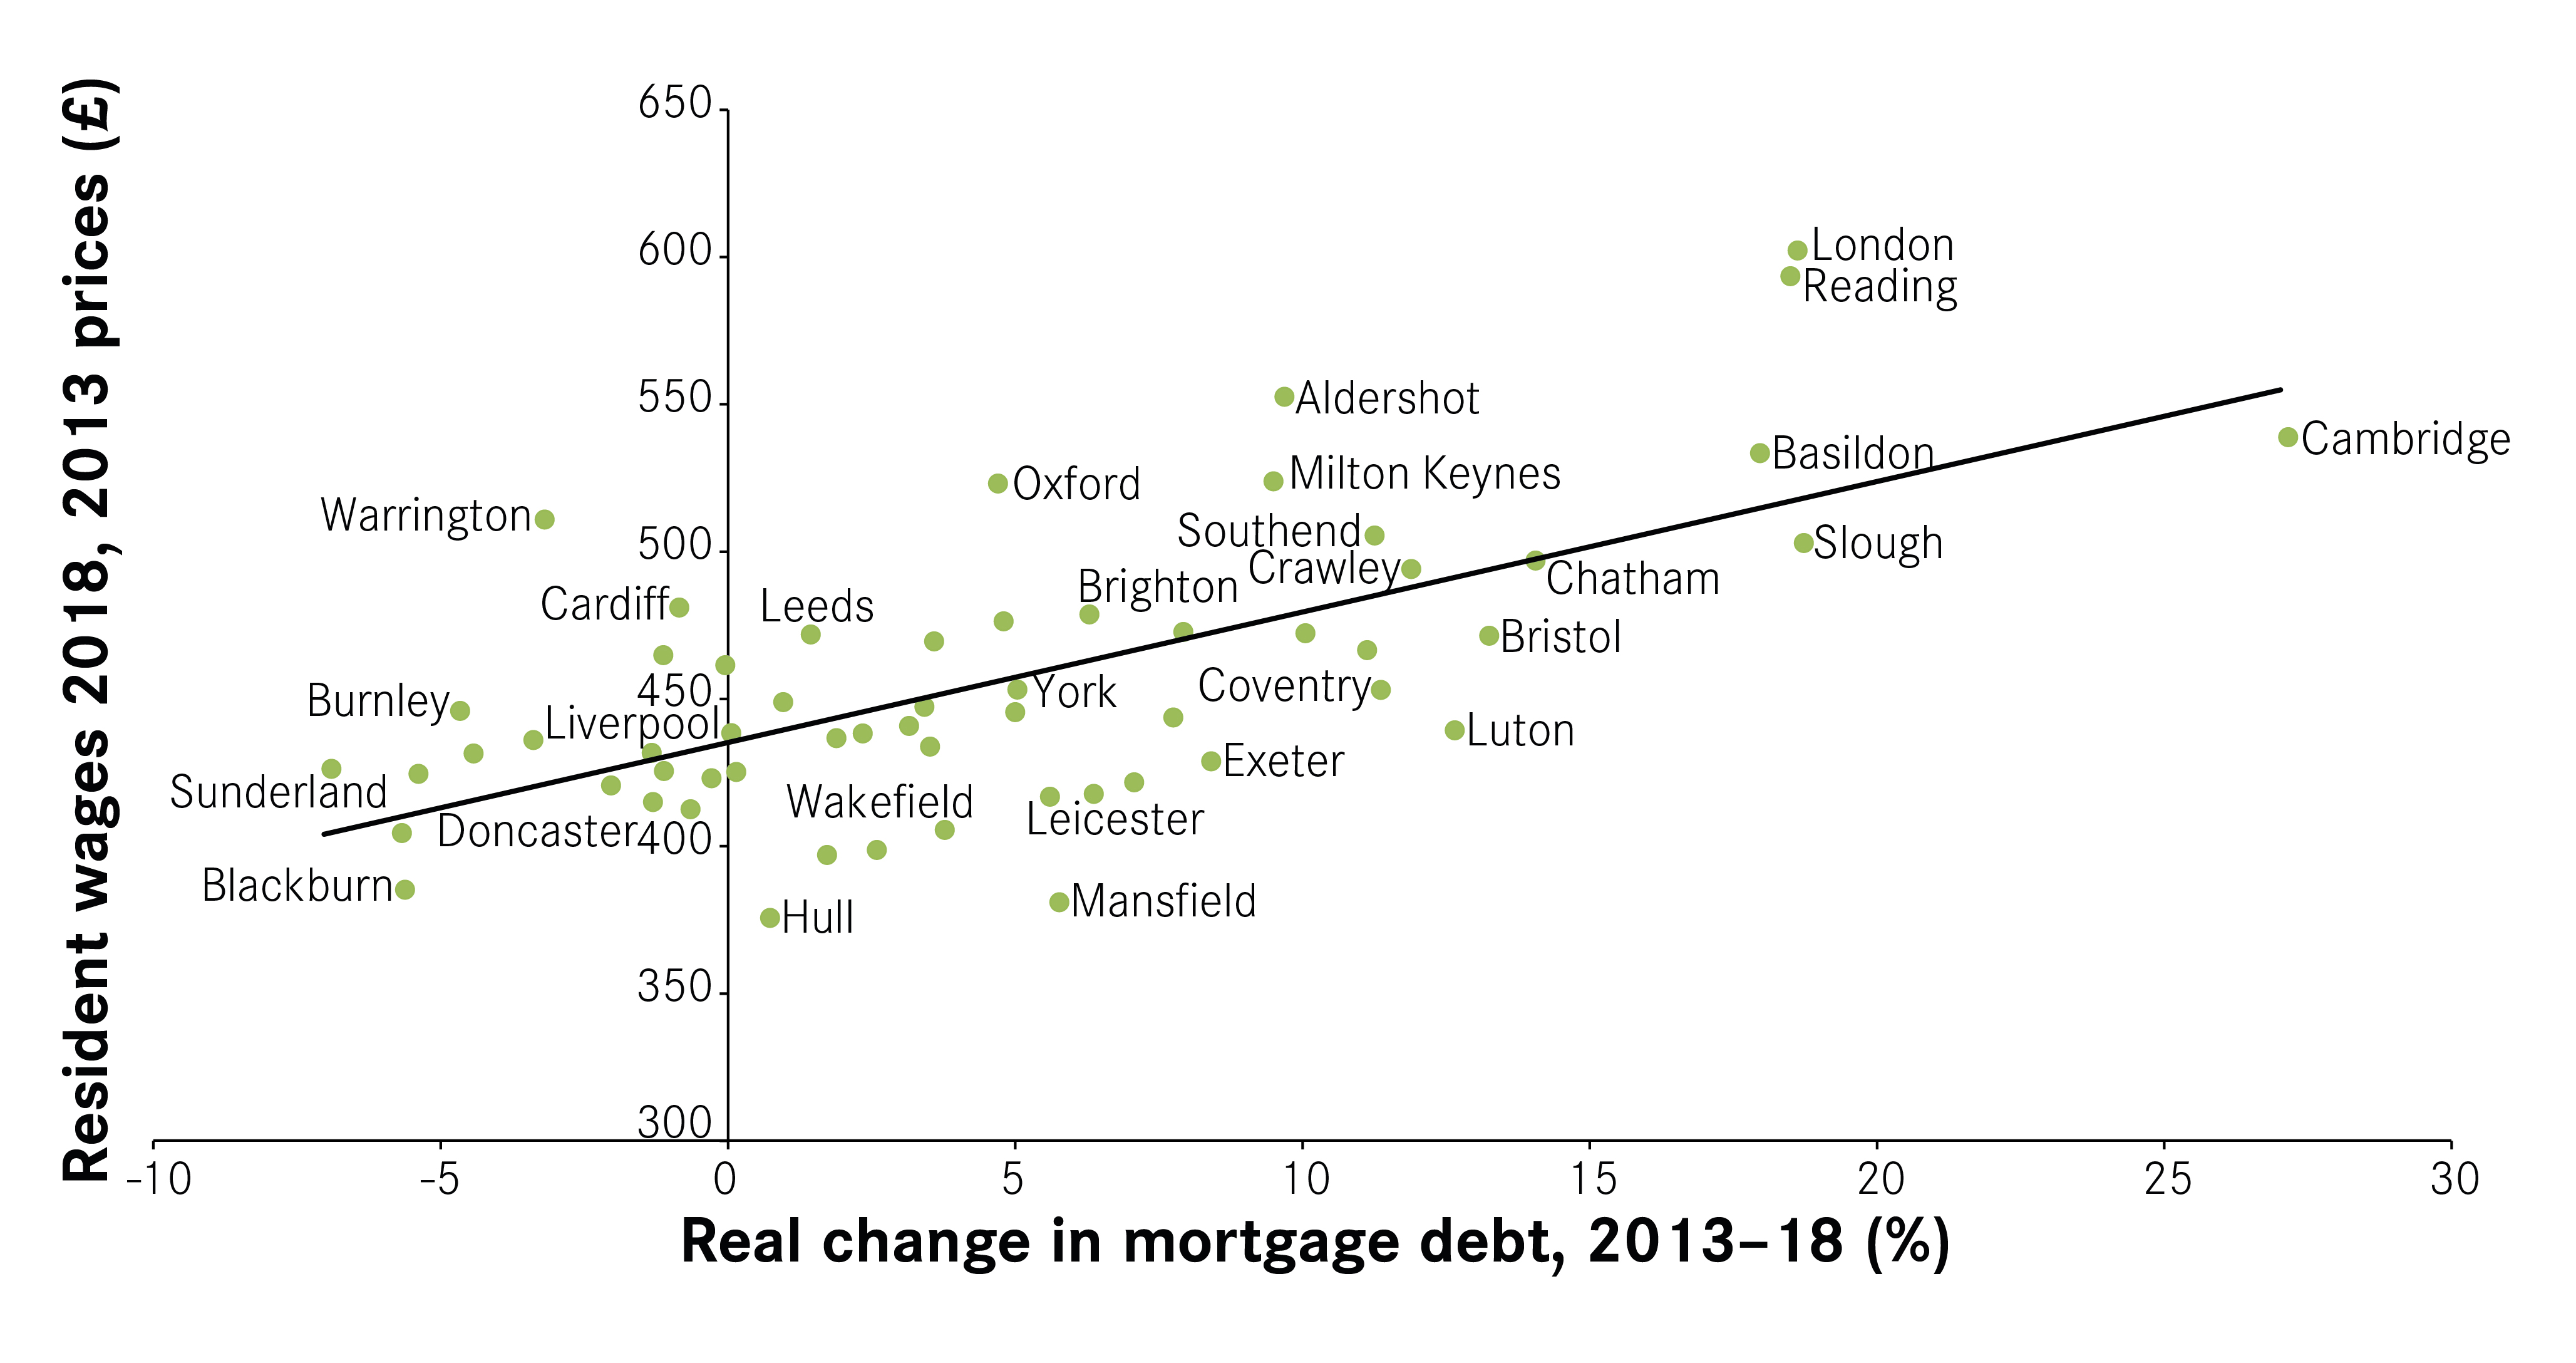
Rather than increasing demand across the entire economy, contemporary finance flows to cities with high housing demand. Figure 7 indicates that real net mortgage lending has increased the most from 2013 to 2018 in cities that have high resident wages, and therefore higher demand for housing.
Cheaper credit does play a role in increasing high house prices, and thereby housing wealth, in the short term as it can quickly increase demand while supply lags behind. But cities like Basildon, London, Reading and Slough, which have seen some of the largest increases in mortgage lending, also have some of the highest resident wages in the country and therefore high demand.
In contrast, some cities with weaker economies and small increases in housing equity, such as Sunderland and Doncaster (£3,000 and £5,000 respectively), have seen their total mortgage lending fall. Housing wealth is not growing in these cities because demand is high, but partly because homeowners are paying down outstanding mortgage debt. In effect, these cities are still deleveraging from the global financial crisis.
City economies drive geographic patterns in mortgage lending and thereby credit’s impact on house prices and wealth. Mortgage lending’s association with resident wages means finance is amplifying housing demand specifically in cities with successful economies. But housing supply in these cities is unresponsive to changes in demand or prices. This increases the volatility of finance’s influence on their house prices in the short term due to their exposure to sudden changes in the availability of lending. Cheaper lending then struggles to finance new supply and thereby reduce house prices and housing wealth in these cities in the longer term.
As the supply of housing in cities has no relationship to economic geography, this means that supply cannot respond to local demand for housing, even when lending becomes cheaper. This creates structural housing shortages in cities with high wages, with negative consequences for housing costs, financial stability, and wealth inequality.


