
02How does housing wealth vary in cities across England and Wales?
Home ownership is not the same thing as housing wealth. As house prices have such a large range between different cities, the wealth associated with owning a house differs substantially across the country. But to calculate housing wealth and how it has changed in recent years, both prices and mortgage lending by city are needed in order to estimate average equity.
Using mortgage data by postcode from UK Finance, it is possible to look at growth in housing equity per house by city in England and Wales from 2013 to 2018.6 Figure 1 shows that housing wealth has increased the most since 2013 in cities in the Greater South East.7 While average housing equity per house grew in real terms by £23,000 (21 per cent) in cities in the rest of England and Wales between 2013 and 2018, in cities in the Greater South East average housing wealth grew by £103,000 (35 per cent). In London, average housing wealth grew by £122,000 (34 per cent).
Figure 1: Average housing equity 2013 and growth to average equity 2013-18
Source: UK Finance; Dwelling Stock Estimates, ONS; Dwelling Stock Estimates, Welsh Government; Land Registry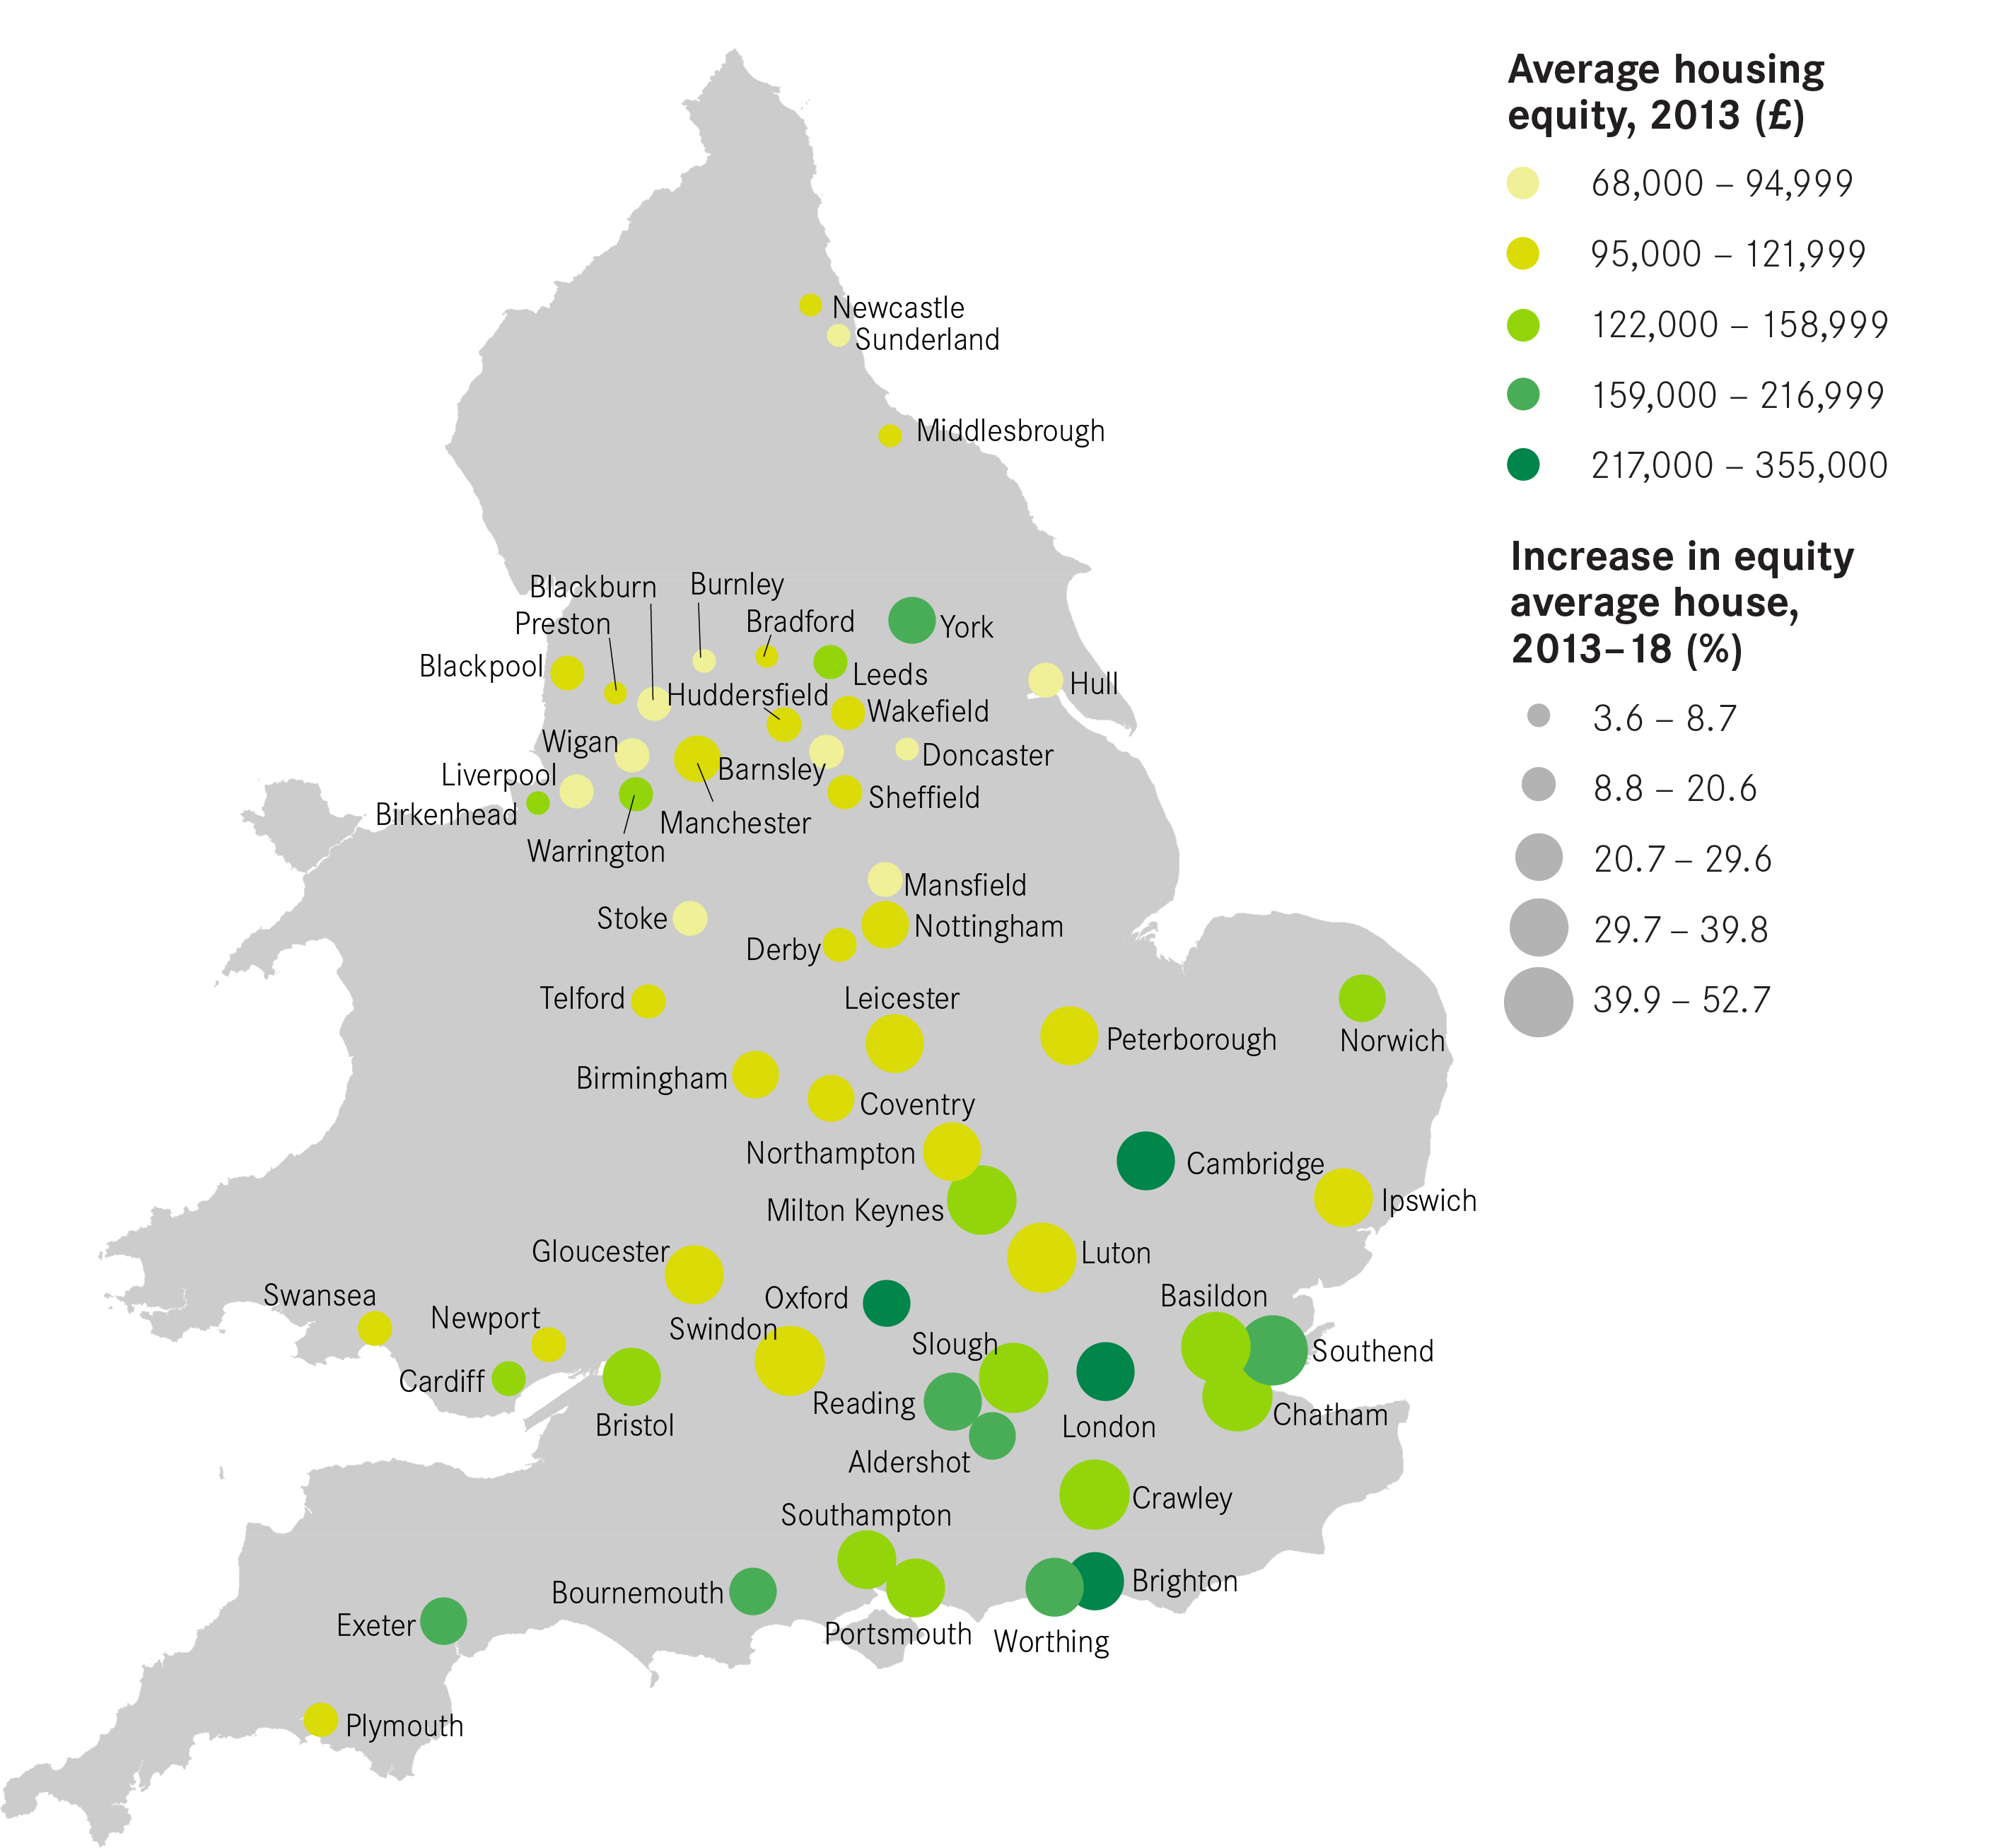
This growth in housing wealth is fastest and greatest in cities which already had the highest housing equity. For instance, in Brighton, average equity per house stood at £217,000 in 2013, and has increased by £83,000 in real terms through to 2018, or by 38 per cent. In contrast, in Burnley, average housing equity stood at £68,000, and has grown in real terms by £5,000, or by 7 per cent.
Box 1: Housing equity and methodology
Housing wealth is measured in this report using equity. For example, if a household owns a house valued at £500,000 and has a mortgage of £400,000 outstanding, then they have accumulated housing equity of £100,000.
Using total net mortgage data by postcode from UK Finance from Q2 2013 to Q2 2018, which includes 68 to 73 per cent of all mortgage lending in the UK, an estimate for net mortgage lending by Primary Urban Area across England and Wales can be produced. Combining this with mean house price data and total private dwelling stock by each city makes it possible to produce estimates for total equity across the city and average equity per private dwelling.
This data is not broken down by mortgaged and outright owners, or by looking at homeowners who own more than one residential property. Instead, it considers the amount of housing wealth associated with the average house. Owners who own outright and landlords will, as a result, have higher wealth than this average.
All prices in this report are in real terms and have been deflated by CPIH in Q2 2013.
Social housing has been omitted as this report is focused on the accumulation of wealth in the private sector.
Looking at growth in total housing equity city by city in Table 1 reveals stark inequalities. Total housing wealth in London alone increased in real terms by £450 billion, more than every other city combined. In Chatham, total housing wealth increased by a total of £6.4 billion compared to £600 million in Sunderland, a city of a similar size. In 2013 average equity in Slough and in Birkenhead was £147,000 and £122,000 respectively, but by 2018 homeowners in Slough had seen their housing wealth grow by on average £73,000 (50 per cent), while those in Birkenhead had seen growth of just £7,000 (5 per cent).
Table 1: Summary of changes in housing wealth across England and Wales, 2013-18

These differences in wealth between cities are not driven by increases in the number of houses, but by increases in cities’ house prices. As a comparison, house prices in Middlesbrough rose in real terms from 2013 to 2018 by 1 per cent and average equity grew by 4 per cent, while in Southend house prices rose by 36 per cent and average equity by 46 per cent.
However, not everyone in expensive cities has benefited from this growth in housing wealth. As Figure 2 shows, in the cities with the highest average housing wealth, and by extension the fastest growth in housing wealth, home ownership is a much less common way to consume housing in the private sector. Private renting is more common in expensive cities like Brighton and Oxford than in cities with lower average housing equity, like Wakefield or Wigan.
Figure 2: Average equity in 2018 versus owner occupation as a share of private housing in 2011

That home ownership is more common where it is cheaper may seem intuitive, but it means housing wealth and home ownership push in different directions. Not only is the wealth associated with owning a house greater in Cambridge than in Swansea, it is also much less common for households to own this wealth in Cambridge.