02The state of demand for commercial space
Around 55 per cent of businesses in Britain are located in cities, generating 62 per cent of the economy’s output. This demand for space is reflected in the price of it: on average in 2015, one square metre of commercial space was valued at an annual rental price of £99 in cities, compared with only £54 in the rest of the country.2
This geography of the economy exists because of the benefits that different parts of Britain offer to businesses. Cities offer access – access to skilled workers and access to a network of other businesses. But this comes at the cost of more expensive premises, congestion and pollution. Where individual businesses locate depends on trade-offs they make between them.
The pull of cities has been growing in recent years, with businesses increasingly clustering within them. And this has implications for the demand for commercial space. As Figure 1 shows, the rateable value per square metre of city centre office space saw the fastest increase between 2010 and 2017, followed by suburban space.3 This did not translate into large increases in floorspace though – while the number of properties increased in city centres, the fall in the average size of a property meant that there was little overall change in the amount of floorspace.
Figure 1: Change by type of area, 2010-2017

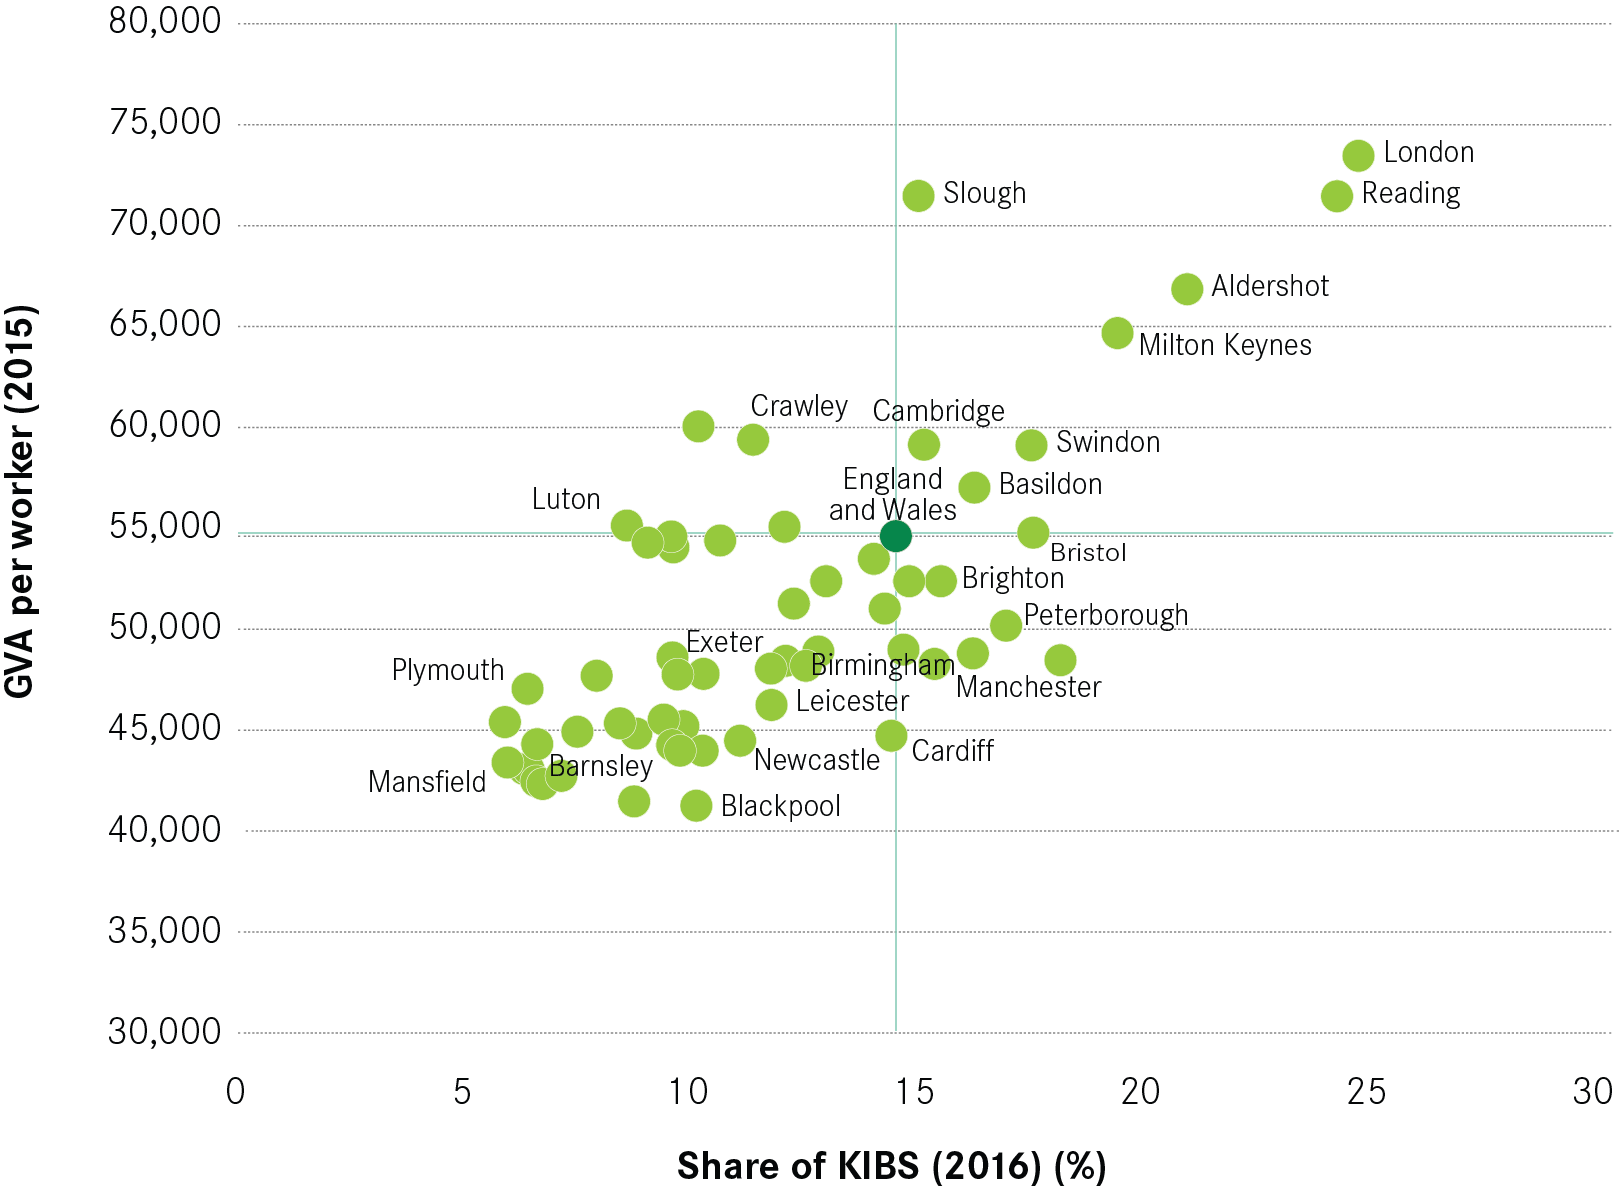
Crucially, some cities offer these benefits to a greater extent than others. Figure 2 shows cities by their share of knowledge intensive business services (KIBS) jobs and by productivity. Successful city economies provide greater access to knowledge, and therefore have a high share of KIBS jobs and high levels of productivity. These include London, Reading and Bristol. Weaker city economies, such as Plymouth, Barnsley and Mansfield, have a much lower share of knowledge-intensive jobs which is reflected in their lower productivity.
And this has implications for demand for commercial space. Cities that offer greater access to knowledge tend to see greater demand from knowledge-based businesses that are increasingly looking for a city centre location. Cities that do not offer access to knowledge struggle to attract these types of businesses, and so demand for city centre space within them tends to be weaker. What they do offer though is access
to lots of lower skilled workers and cheap land. These benefits appeal to businesses undertaking more routine activities, such as call centres, that prefer either a suburban or hinterland location.4 And this shows in how demand for commercial space plays out in different cities. Box 2 illustrates this with the cases of Reading and Mansfield.
Figure 2: Knowledge Intensive Business Services (KIBS) jobs and Productivity
Box 2: Cost of commercial space in Reading and Mansfield
Reading has a strong economy, with a large share of knowledge-based services. This has driven up demand for commercial space in the city centre in particular. In 2015, the average rateable value per m2 was £126, but it was much higher in the city centre than in suburbs (one square metre of floorspace was rented at £196 a year in the city centre on average, compared to £107 in the rest of the city).
In contrast, Mansfield has had more difficulties in attracting businesses, and in particular knowledge-based services. The average rateable value was at £46 per m2, suggesting a relatively low demand for commercial space. Although the city centre was on average more expensive than the rest of the city (£75 per m2 against £43 per m2 in suburbs), it was still relatively unattractive to firms. For instance the cost of office space in the city centre was cheaper than in Mansfield’s suburbs.
This suggests that Mansfield tends to attract lower skilled, lower value services – that require larger floorspace and favour less central locations – but fails to attract more productive, city-centre based knowledge-intensive activities.
If the UK economy continues to specialise in ever more knowledge-intensive activities, then those cities that are able to attract investment in such activities will be the ones that will perform the strongest in the future. For weaker cities, while capitalising on demand in out of town areas will provide jobs and increase the output of the economy, the low-skilled nature of this demand will mean that it will do little to increase productivity. So the challenge for policy makers is to reduce the barriers that prevent these cities from attracting in such investment, aiming to ‘reinvent’ their economies rather than ‘replicate’ them with further investment in lower-skilled activities.5
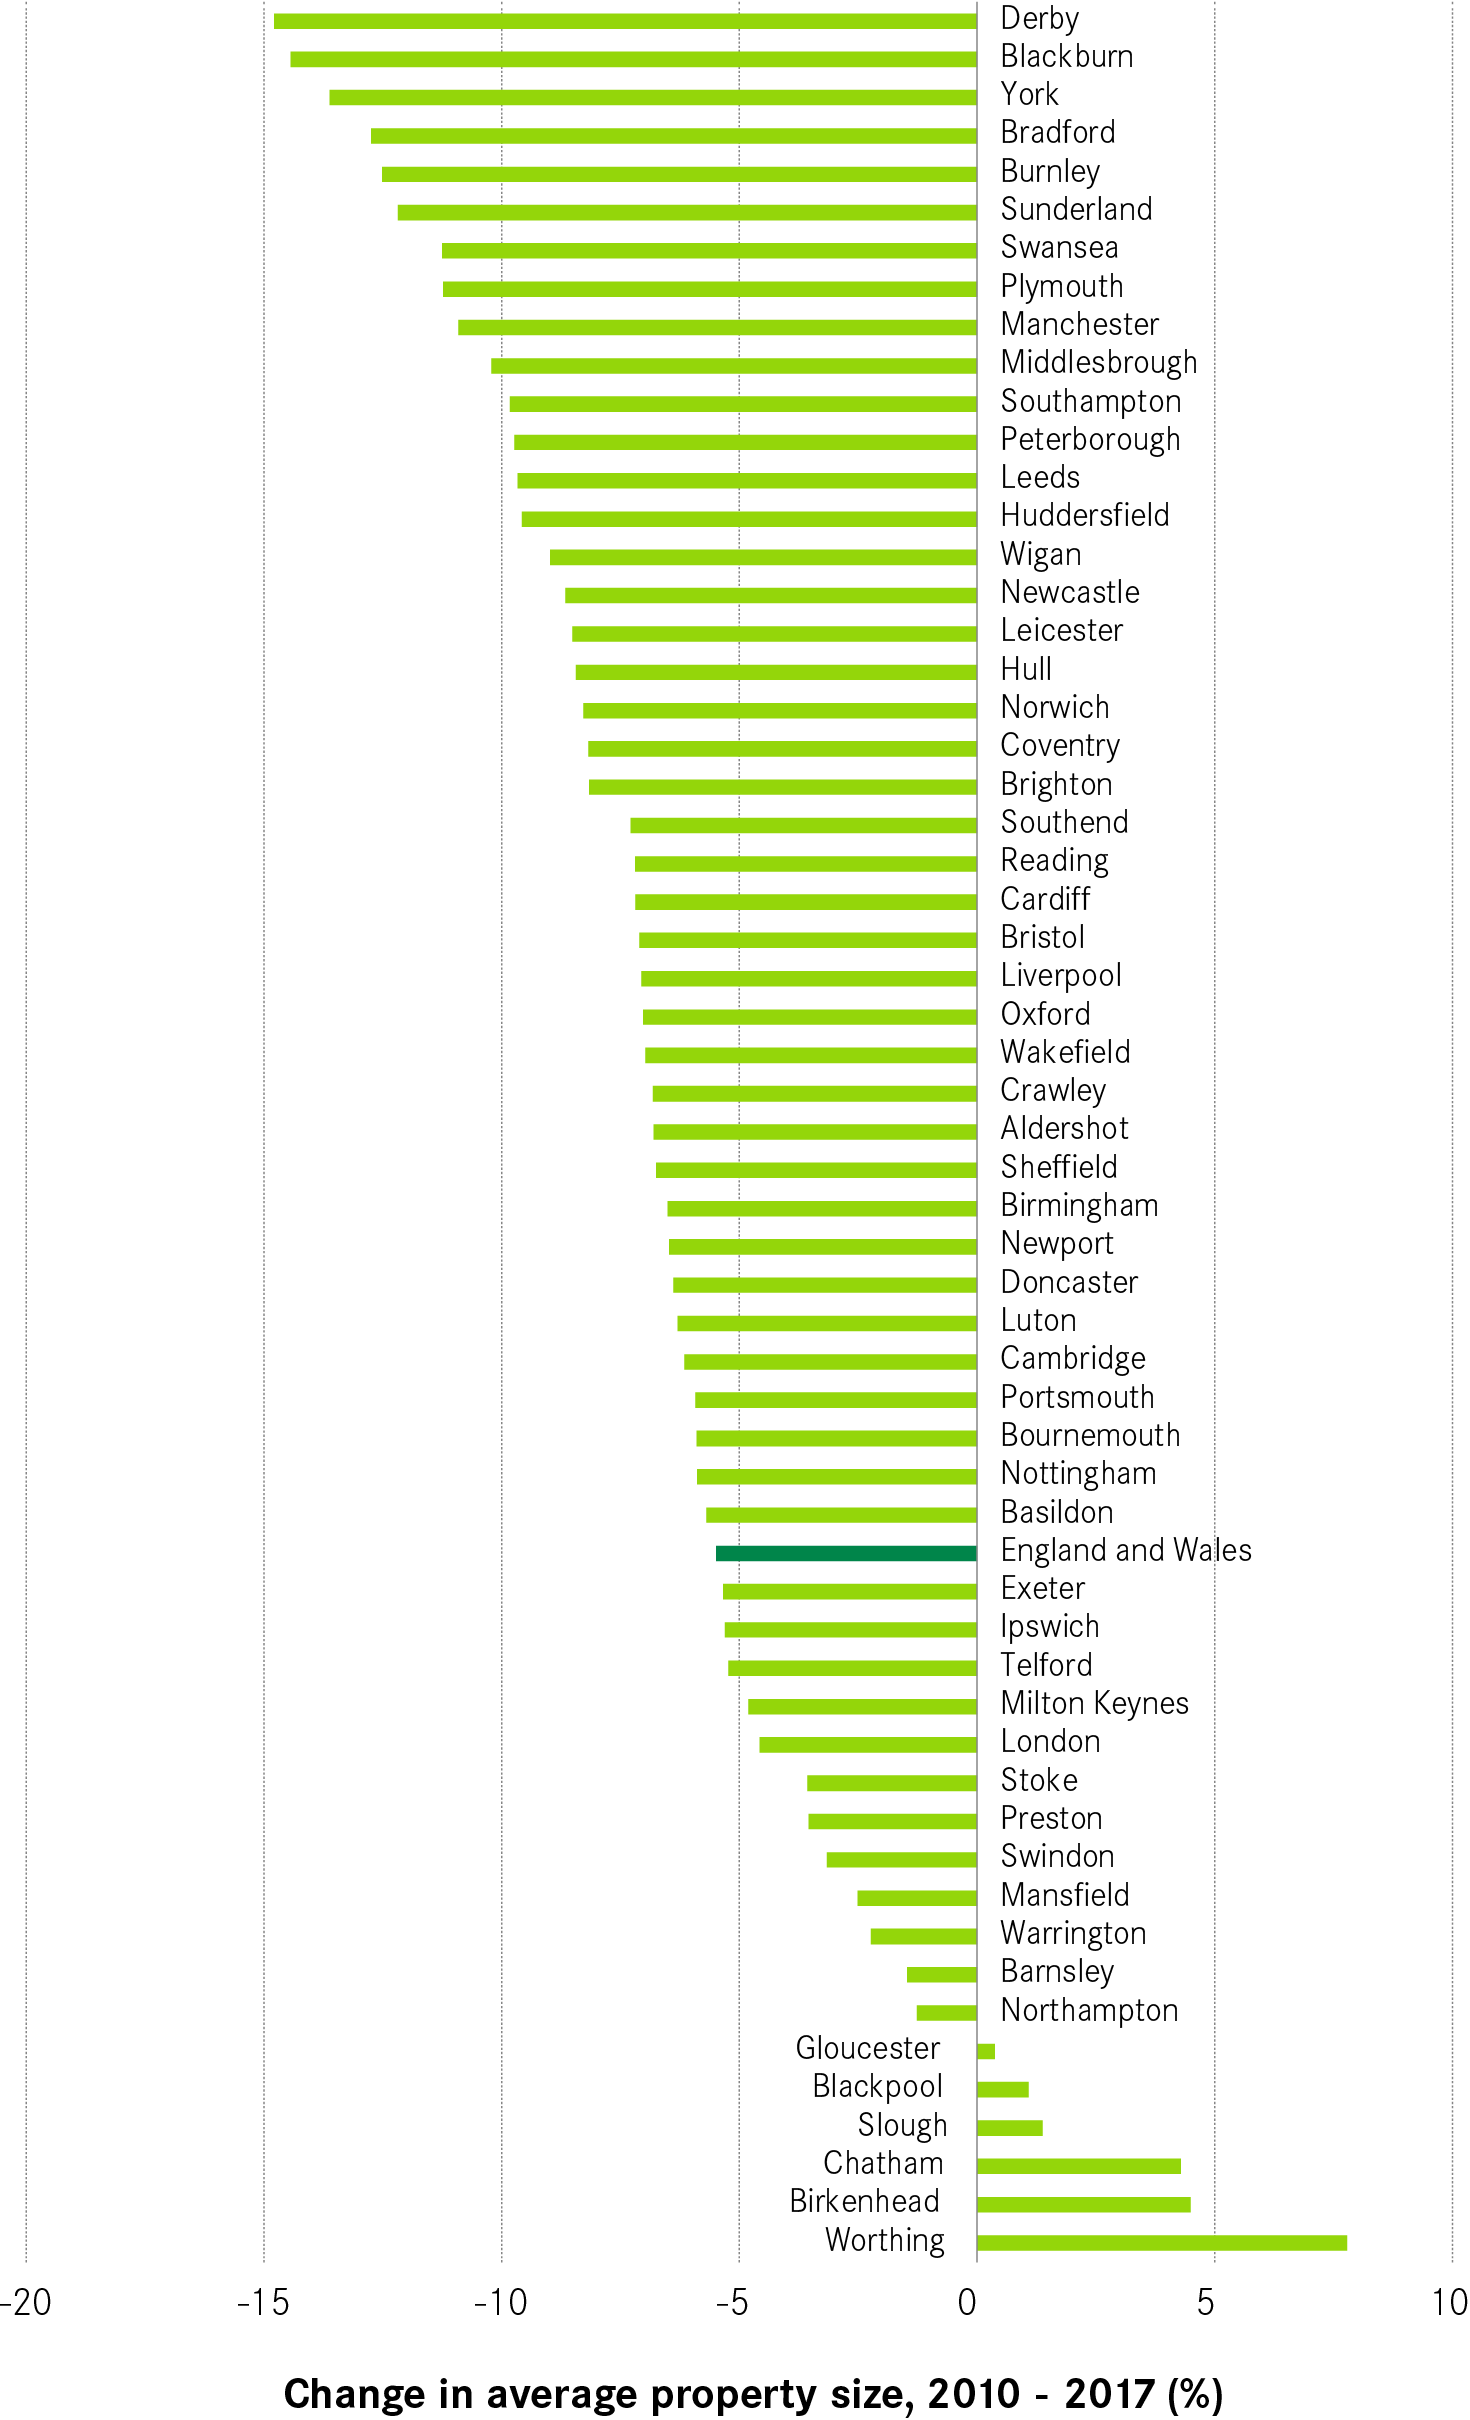
A further important trend to note in terms of demand is the reduction in the average size of commercial space. Figure 1 above shows that average size declined across all geographies, while Figure 3 shows that it declined in all but six cities between 2010 and 2017.
Figure 3: Change in average non-residential property size, 2010-2017