
03The economic growth incentive: issues and adjustments
One of the main aims of devolving business rates is to incentivise local authorities to put policies in place to grow their economies.6 But as this section shows, the current system does not reward weaker cities that adapt their business environment to economic changes.
The current incentive explained
The business rates system rewards places that increase the amount of commercial floorspace in their area. This is because the rateable values assigned to properties are fixed for a number of years, meaning that the only way to increase total tax take is to increase the amount of floorspace available.
This poses two problems. The first is that it incentivises local authorities to permit development on where demand exists already. In successful cities, which attract knowledge-intensive industries and have a productive economy, this is positive because it encourages the expansion of the supply of floorspace, in particular in their high-demand city centre. Whereas local authorities might not be willing to build more, mainly for political reasons, they will be financially rewarded for doing so under 100 per cent business rates retention. This is what the incentive aims to do: encourage behaviours that align with economic growth but that local authorities might not otherwise implement.
But this is less appropriate in weaker cities, where demand for city centre space is limited. The incentive encourages cities to take advantage of where demand does exist, which mostly comes from lower-skilled businesses in out of town locations. While this might encourage increase in output of the economy (more jobs), it wouldn’t encourage increases in productivity (more output per job as a result of moving to higher-skilled activities). And it might also generate displacement of firms from city centre locations to newer out of town premises. This is because the incentive would not reward cities to invest in their city centre to attempt to make them more attractive places to do business.
Therefore the incentive reinforces the status quo. Cities that are already performing well are given the right incentive to support growth (by building more), but cities that have weaker economies do not get a financial reward if they try to improve their business environment ahead of demand.
The second issue is the decline in the average size of units. The system should reward economic growth, but as the industries that contribute the most to the economy tend to require smaller premises, using floorspace to measure growth is likely to become increasingly unsuitable.
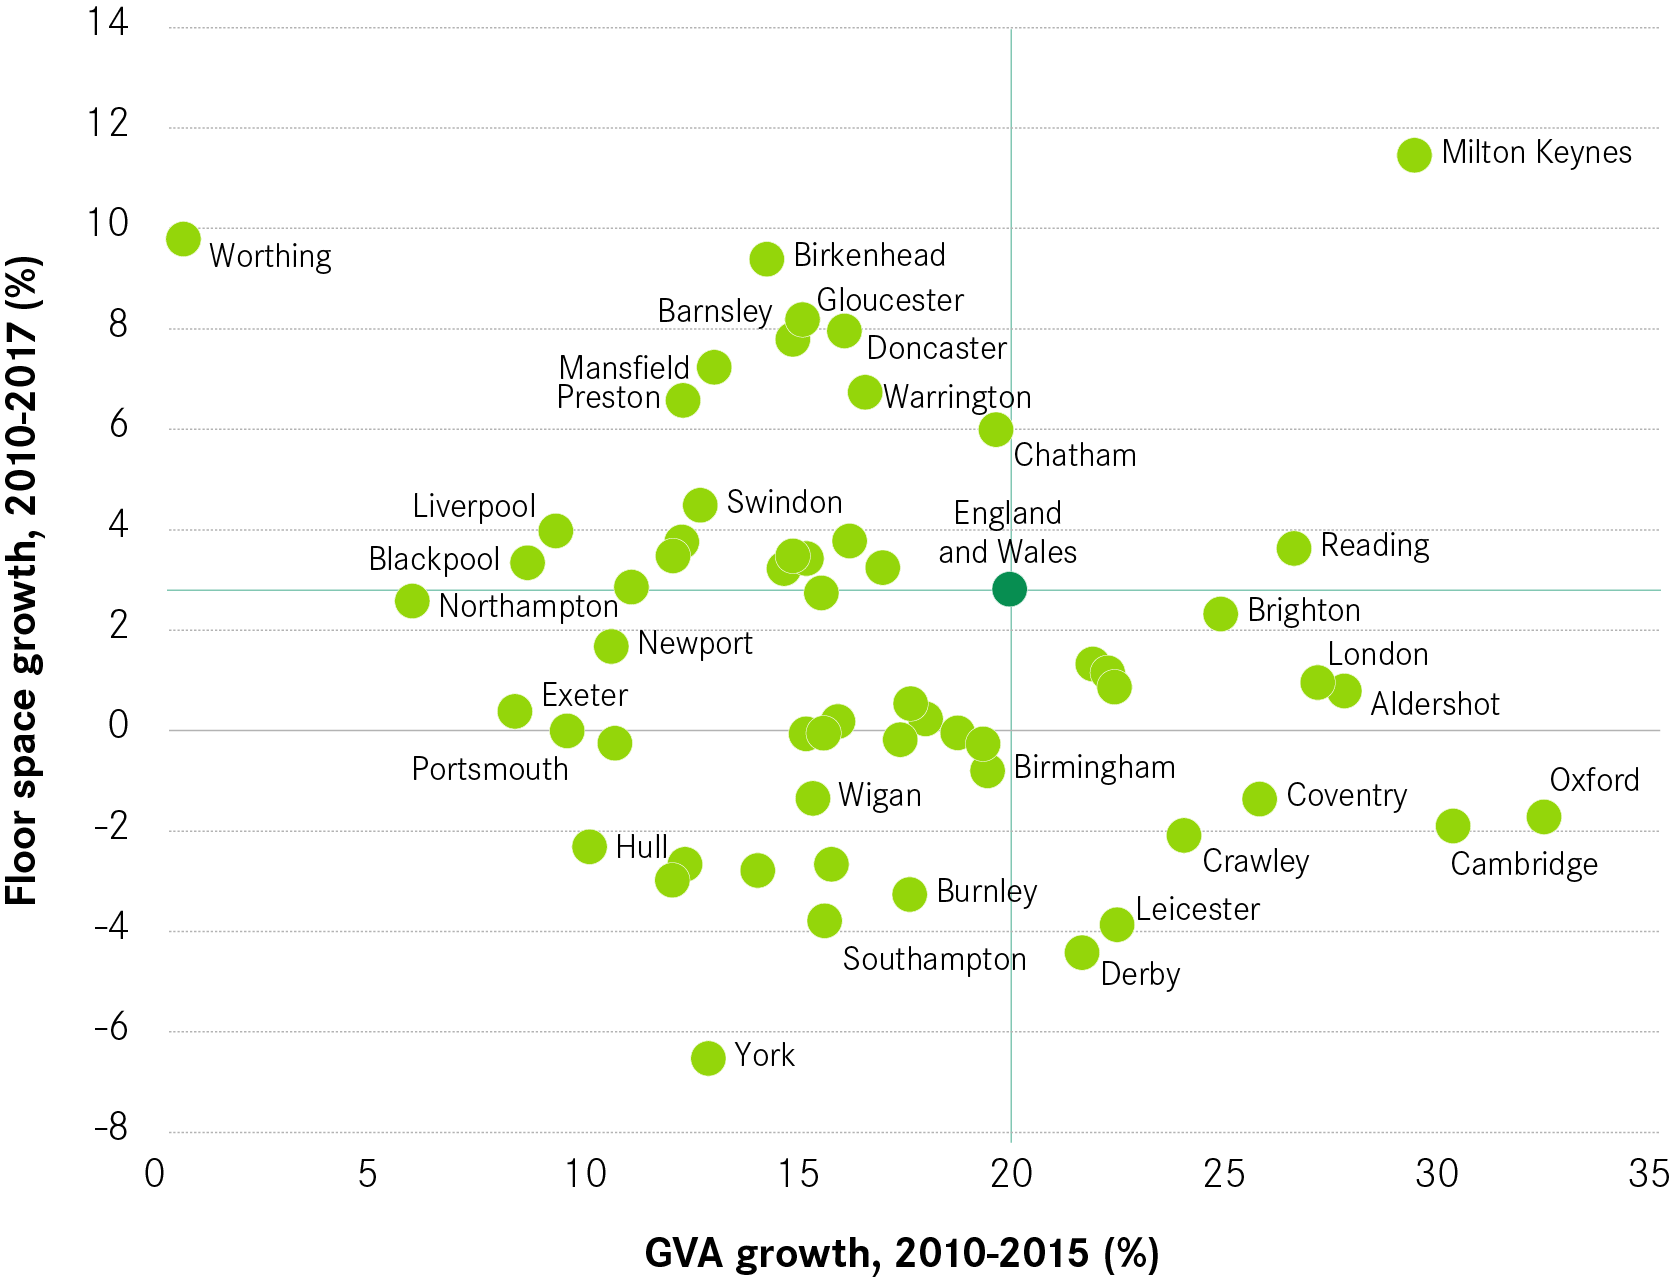
This mismatch is clear when looking at the relationship between the growth incentive on one hand, and actual economic growth on the other. As shown on Figure 4, cities such as Brighton, Oxford and Coventry have experienced high growth in terms of GVA between 2010 and 2015 but have not seen a corresponding increase in floorspace. In contrast, some cities such as Birkenhead, Liverpool and Preston have considerably increased their floorspace despite economic growth being limited. So while the incentive might encourage the appropariate behaviour in some cities, it does not necessarily reward economic growth in every city.
Figure 4: GVA and floorspace and growth
Improving the system to help more cities to grow
In order to incentivise long term economic growth in a larger number of cities across the country, business rates growth should also be measured using the value uplift of commercial properties.
Having those two incentives in place would allow local authorities to have two mechanisms rewarding growth: one by extending the number of taxable properties (i.e. increasing floorspace); the other by increasing the value of existing properties (i.e. capturing value uplift).
Benefits of the value uplift mechanism
As shown in Figure 5, and in contrast to Figure 4, there is a clear correlation between growth (as measured by GVA) and property prices (measured by the rateable value per m2). This indicates that property prices increase with economic growth. So allowing local authorities to capture the value uplift of commercial properties would help the business rates incentive to more correctly align with economic growth.
Figure 5: GVA and rateable value growth

It would also give local authorities a direct financial reward for improving their urban environment. Through the value uplift mechanism, cities could increase their business rates revenues by:
- Replacing low-quality, low rateable value buildings with higher quality and better adapted units. Local authorities would then capture the benefits of upgrading or replacing dated premises, even though this would not increase floorspace.7
- Making places more attractive to firms and investors by strengthening the economic fundamentals such as skills and transport. This would have an indirect impact on rent, rateable value and the final business rate bill.
By allowing cities to capture the value uplift, the system would reward cities that improve the quality of the business environment – for instance by investing in their city centre. This is one of the elements needed to help attract more productive and knowledge-based activities.
How to make it work?
There are three major components that must be implemented for the value uplift incentive to work: carry out more frequent revaluations, lift the cap on business rates revenues, and consider the interaction with the existing incentive.
1. Make property revaluations more frequent
Because revaluations are too infrequent and might create large changes in local authorities’ finances, the Government currently readjusts individual local authorities’ tariffs and top-ups after revaluation, so that it has no impact on local finances.8 By doing this it prevents local authorities from capturing rateable value growth arising from revaluation. Firms on the other hand still pay the price for infrequent revaluation, and can experience large changes in their bill, as was the case after the 2017 revaluation.
Annual property revaluations would make rateable value changes less extreme, which would ease the pain for firms. For local authorities, this means the government would no longer need to re-adjust tariffs and top-ups accordingly. And in effect, this would allow local authorities to capture the value uplift of properties.
Year-on-year revaluations would have three main impacts:
- Allow cities to benefit from growth more quickly, as yearly revaluations would adjust property values, allowing cities to capture any uplift immediately.
- Prevent sudden and relatively unpredictable changes in rateable value, which many businesses experienced following the latest revaluation in April 2017. Year-on-year revaluations would make rateable values more closely related to real market values, making them easier to predict, understand and accept for taxpayers, with possibly fewer appeals (see Box 1).
- Bring more certainty to the revaluation timeline. Currently values are set up to be updated every five years, but the latest revaluation, in 2017 was delayed by two years. Frequent and fixed revaluations would bring more clarity and certainty for local authorities and businesses alike.
The 2017 Autumn Budget announced that rateable values would be revaluated every three years instead of five, starting in 2022.9 This is a welcome step forward, but annual revaluations are needed to fully align the system with the economy. Several countries have managed to move to an annual revaluation system, as detailed in Box 3.
Box 3: Revaluate frequently: international examples
The Netherlands10
In the Netherlands, property taxes (residential and non-residential) are all based on expected sale market values, referred to as WOZ, that are revaluated every year.
Initially revaluations took place every five years, but this was progressively increased to every year in 2007. The move to year-on-year valuations has brought several positive outcomes, including a more standardised and efficient process (between 1997 and 2014 annual costs have decreased from €190 million to €150 million), fewer complaints and appeals, and greater market transparency (for instance WOZ values are now used for other purposes, such as mortgage appraisals).
The year-on-year revaluation process has the following characteristics:
- It relies more on mass valuation than on traditional appraisal. Different sources are used to assess property values, the bulk coming from property advertising websites. Self-assessments are also sent to gather more precise information, especially to obtain rental prices in the case of commercial properties.
- It is decentralised. Valuations are conducted by municipalities on the basis that they have better knowledge and understanding of the market. A central agency defines valuation characteristics and requirements, and ensures processes have been followed correctly.
- It requires cooperation. Municipalities are encouraged to work together and share data and practices. They also work with property owners and occupiers themselves, which is thought to increase their acceptance of the tax as they are taking part in its assessment.
There are a certain number of risks and difficulties related to this system. It put pressure on the administration (in this case municipalities) to deliver data on a yearly basis, and demands high-level quality controls throughout (especially when it comes to self-assessment). It also requires shifting skillsets in favour of scientific and economic-related occupations.
France11
In France, the levy on non-residential property used to be calculated on Land Registry values that had not been updated since the 1970s. From January 2017, values are updated on a yearly basis and are based on estimated rent. Business renters are required to declare the amount of rent they pay as part of their annual tax return which, coupled with specific information on size, location, and type of business activity, allows to model an estimated rental value for each property.
Similar to the Dutch case, revaluations are conducted at the sub-national level. In each county, a commission is in charge of determining the correct values based on collected data on rents. Individual municipalities are consulted to guarantee estimated rents correspond to reality and also help to determine property characteristics at a higher level of granularity.
More frequent revaluations would however make local authorities more vulnerable to downturns in the economy too. Currently local authorities are guaranteed the same amount of money until top-ups and tariffs are reset, and revaluations do not affect their revenues. Under this proposed system, local authorities are the winners when the economy is growing, as they generate extra revenues year-on-year. Conversely businesses are the winners during a recession, as they see their rates fall.
2. Remove the cap on business rates yield
The cap would need to be removed to allow local authorities to fully capture the value uplift. This is because it creates a mechanism where growth is dependent on the national average. At revaluation, the multiplier is adjusted proportionally to the aggregate change in rateable value. Individual authorities that experienced a higher level of growth in rateable value than the national average therefore would see their income increase. Authorities that experienced a lower level of growth than the average would instead see their income fall, despite experiencing net growth. This is explained in more detail in Box 4.
For local authorities to be able to capture value uplift, the cap needs to be removed so that local growth is rewarded outright rather than relative to the national average.
But it is also an issue with regard to the broader redistribution mechanism. The cap artificially restricts the total amount of business rates that can be generated, which ultimately means there is less money for redistribution.
Box 4: Impact of the cap on the growth incentive
Figure 6 and Figure 7 look at the rateable values and the amounts of business rates collected in England and in four cities – two where rateable value increased at a faster pace than the national average, and two where it increased at a slower pace – before and after the 2010 revaluation. Nationally, as a result of the 2010 revaluation, the total national rateable value increased by 21 per cent (Figure 6), but the total amount of business rates generated did not increase more than usual, because the multiplier was adjusted accordingly.12
The local picture is different. In cities where the rateable value grew at a higher rate than the national average, such as London and Exeter (31 and 27 per cent respectively before and after revaluation), the total amount of business rates collected increased after revaluation. This is because, while the multiplier decreased in proportion to how much the aggregate rateable value increased, in these cities the local rateable values grew above the national average, effectively generating more money.
In contrast, places where rateable value growth was below the national average experienced a decline in business rates collected. In Stoke, although rateable value grew at a substantial rate (13 per cent), the amount of business rates collected decreased by 3 per cent immediately after revaluation. It is worth noting that at the time these changes did not affect local budgets because local authorities are not allowed to capture any growth from rateable value, as their revenues are adjusted according to the gain or loss they experience as a result of revaluation.
Figure 6: Rateable value change, 2008/9-2014/15
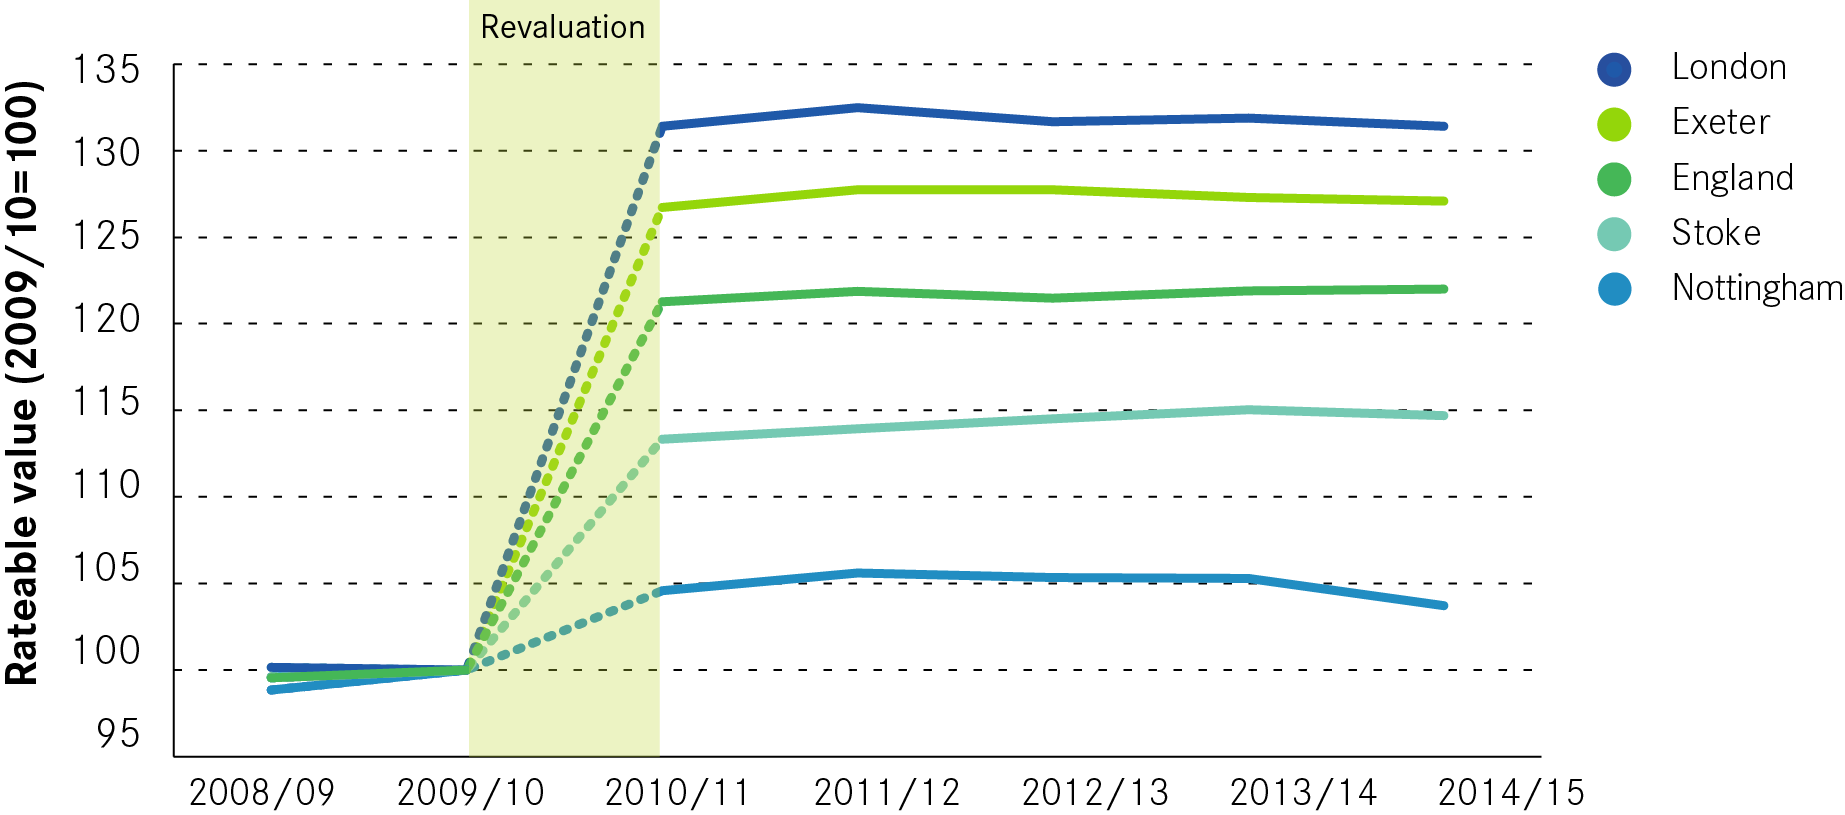
Figure 7: Business rates collected, 2008/9 – 2014/15

3. Interaction with the floorspace incentive
There is a risk that the value uplift incentive could inhibit the incentive to expand floor space. In high-demand cities, instead of building more local authorities could restrict new developments to drive property prices up, and still make profits through business rates.
But for a high-demand authority, adopting a low-supply strategy is unsustainable in the longer term, as growing costs in rents and business rates would increasingly make the area less attractive to firms. Box 5 describes how the two incentives would work in Barnsley and London.
Box 5: How would the two incentives play out? The cases of Barnsley and London
Barnsley: reward city centre improvements
Barnsley gains most of its business rates revenues from large out-of-town space. The most well-known is the Asos Warehouse, located to the east of the city. Between the 2010 and 2017 revaluations, floorspace increased by 9 per cent outside of the city centre, while prices per m2 remained almost stable. But the city centre was much weaker. During the same period, floorspace has declined by 0.6 per cent and rateable value per m2 by 9.1 per cent.
Currently, Barnsley is benefitting from the system because it is expanding its total floorspace. But the system does not reward any attempt at changing its economy over the long-term, for instance by improving the quality of its built environment in the city centre.
Introducing the value uplift incentive would reward Barnsley to improve the quality of its built environment, as those improvements would be reflected in property prices. But alongside this, the city would still generate more business rates from expanding out-of-town, as the floorspace incentive would remain in place.
London: encourage building more floorspace
Among all cities in England and Wales, London has experienced the highest increase in rateable value per m2: prices have increased by 25 per cent between the 2010 and 2017 revaluations. The total number of commercial properties has also increased by almost 6 per cent. But although London is a very high-demand market, the total commercial floorspace increased by less than 1 per cent.
This indicates that not enough additional floorspace is being built to match increasingly high demand. Under the 100 per cent retention of business rates proposed by the government, London would get more from building additional space. And although it could also make money by restricting planning permissions to drive prices up, doing so would soon reduce its attractiveness as a place to locate.
Summary
The current system provides an appropriate incentive for successful cities by encouraging them to build more, but it does not reward other cities for improving their economy.
Introducing a value uplift component to the incentive would allow local authorities to capture any increase in business rates as a result of their efforts to improve the quality of commercial space.
This change would introduce an additional financial reward mechanism that would allow weaker cities to benefit from a growth incentive. While the floorspace incentive is most effective in successful cities – where the demand for new floorspace is high – the rateable value incentive would reward a larger range of cities to improve their economy and take long-term strategic decisions.
Local authorities that get the opportunity to allow out-of-town development would still see an increase in their business rates take. But introducing the value uplift mechanism would widen the incentives that a local authority has to improve its economy and ensure that there is an additionally rewarding alternative.