02Key findings
Every local authority area is predicted to be negatively affected but cities are likely to be hit harder than non-urban areas.
Every local authority area is predicted to see a decrease in economic output, measured by Gross Value Added (GVA) as a result of Brexit.8 The impacts are predicted to be more negative under hard Brexit in every local authority area, as the increase in trade costs would be larger.
Cities are predicted to see larger decreases in GVA than non-urban areas on average in both scenarios. The average decrease in GVA under soft Brexit is 1.2 per cent in cities compared to 1.1 per cent in non-urban local authority areas, and 2.3 per cent compared to 2.0 per cent, respectively under hard Brexit (in all cases, predictions are relative to GVA if the UK had remained in the EU). There is less variation between cities compared to individual local authorities, however, as city-wide economies tend to have more diverse sectoral profiles than local authorities.
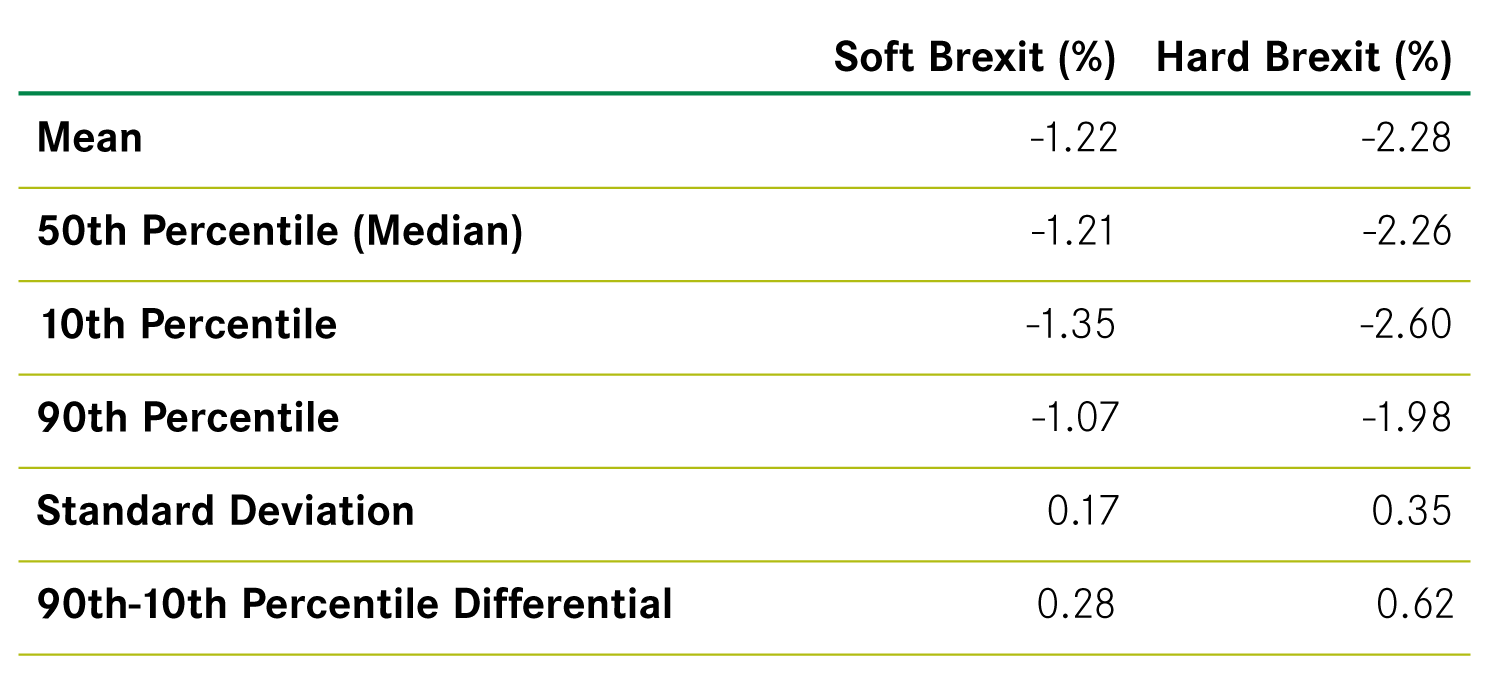
The variation in impact between cities is larger under hard Brexit than soft Brexit, as some cities are more specialised in sectors that are likely to be badly hit by hard Brexit (Figure 1). The standard deviation (a commonly used measure of ‘spread’) doubles from 0.17 to 0.35, and the difference between the 10th and 90th percentile also doubles from 0.3 percentage points to 0.6 percentage points.
Figure 1: Distribution statistics of GVA impacts of Brexit across cities
Despite these differences, the majority of cities rank in a similar position in the two scenarios, and Figure 2 illustrates the strong correlation between the predicted GVA impacts under each.
Figure 2: Two scenarios compared across cities

Cities with large shares of employment in private-sector knowledge intensive services (KIBS), predominantly in the South, are predicted to be hit hardest.
The general geographic pattern is similar under both scenarios. A broad North-South pattern is visible, particularly in terms of the concentration of areas most negatively affected (Figure 3). With a hard Brexit, 12 out of the 20 most affected cities are in the South, whereas just four out of the 20 least affected cities are in the South.9
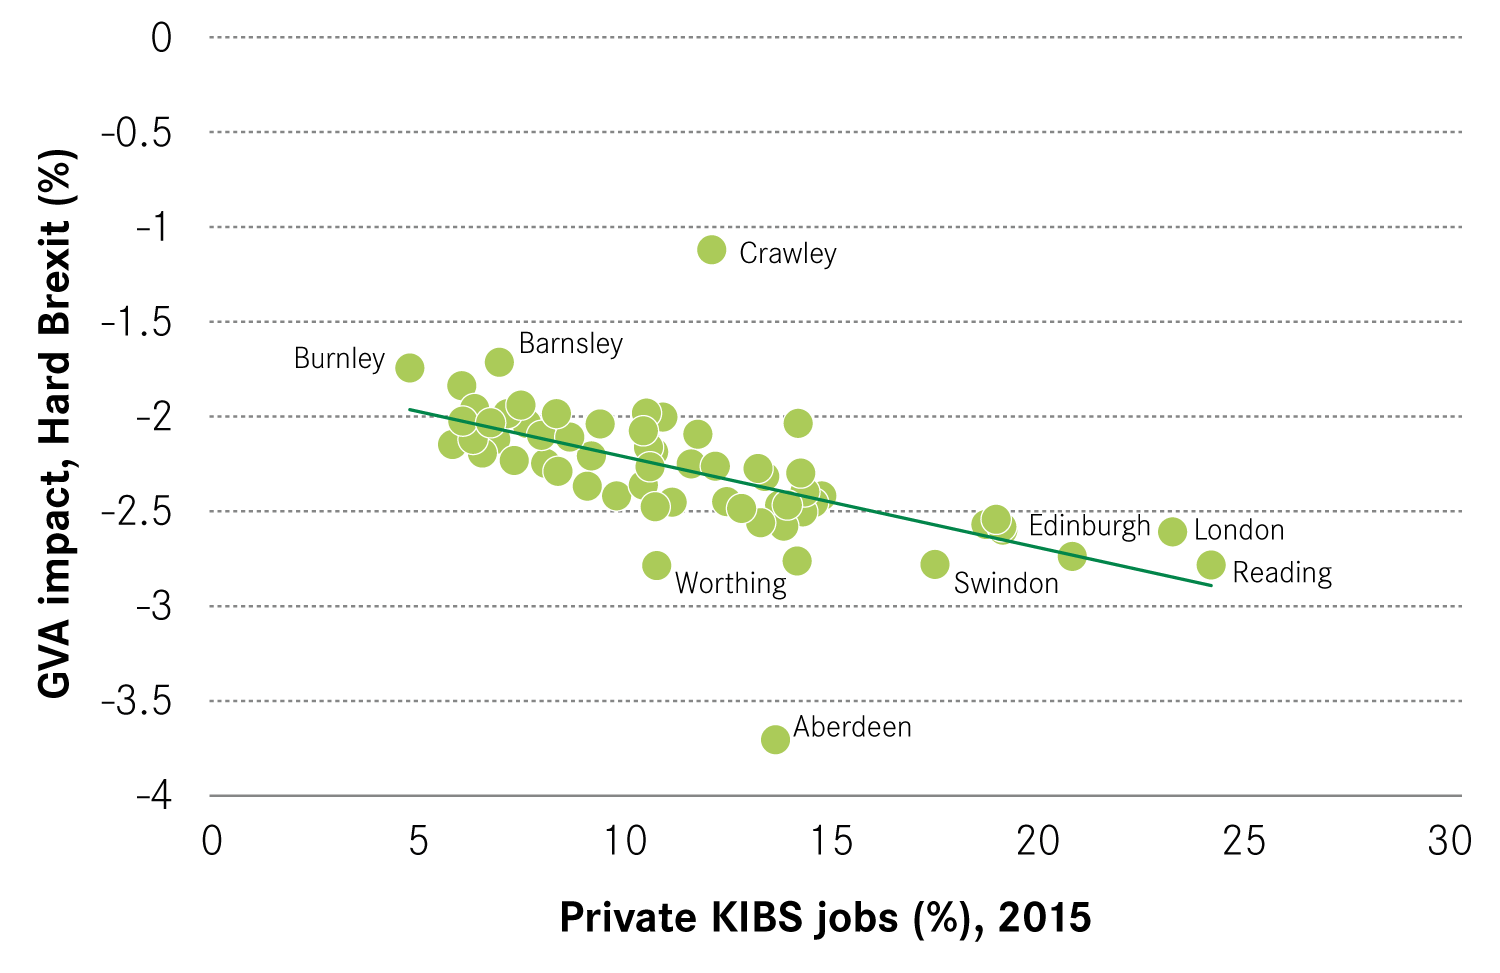
More generally, cities with high shares of employment in the private KIBS sectors are more likely to be negatively affected according to the model, particularly under a hard Brexit (Figure 4). In the three cities with the largest private KIBS sectors – Reading, London and Edinburgh – the predicted loss is equivalent to 2.7 per cent of GVA. By contrast, in cities with the lowest levels of employment in these sectors, Burnley, Dundee and Hull, the loss is equivalent to 1.9 per cent.
This finding is unsurprising given the model predicts that business and financial services – two of the largest knowledge-intensive sectors – will be among the sectors most affected by hard Brexit. It also helps to explain why cities are predicted to see a larger decrease in GVA compared to non-urban areas, as these sectors are concentrated in cities. Other less knowledge-intensive sectors, such as food and drink, are predicted to either see far less significant decreases in GVA or indeed increases in GVA, as demand shifts towards the domestic market as imports become more expensive. A decrease in economic activity in the private KIBS sectors may have knock-on impacts for other sectors given the evidence on the multiplier effects of these sectors in local economies.10
Figure 3: Most and least affected cities (% change in Gross Value Added)
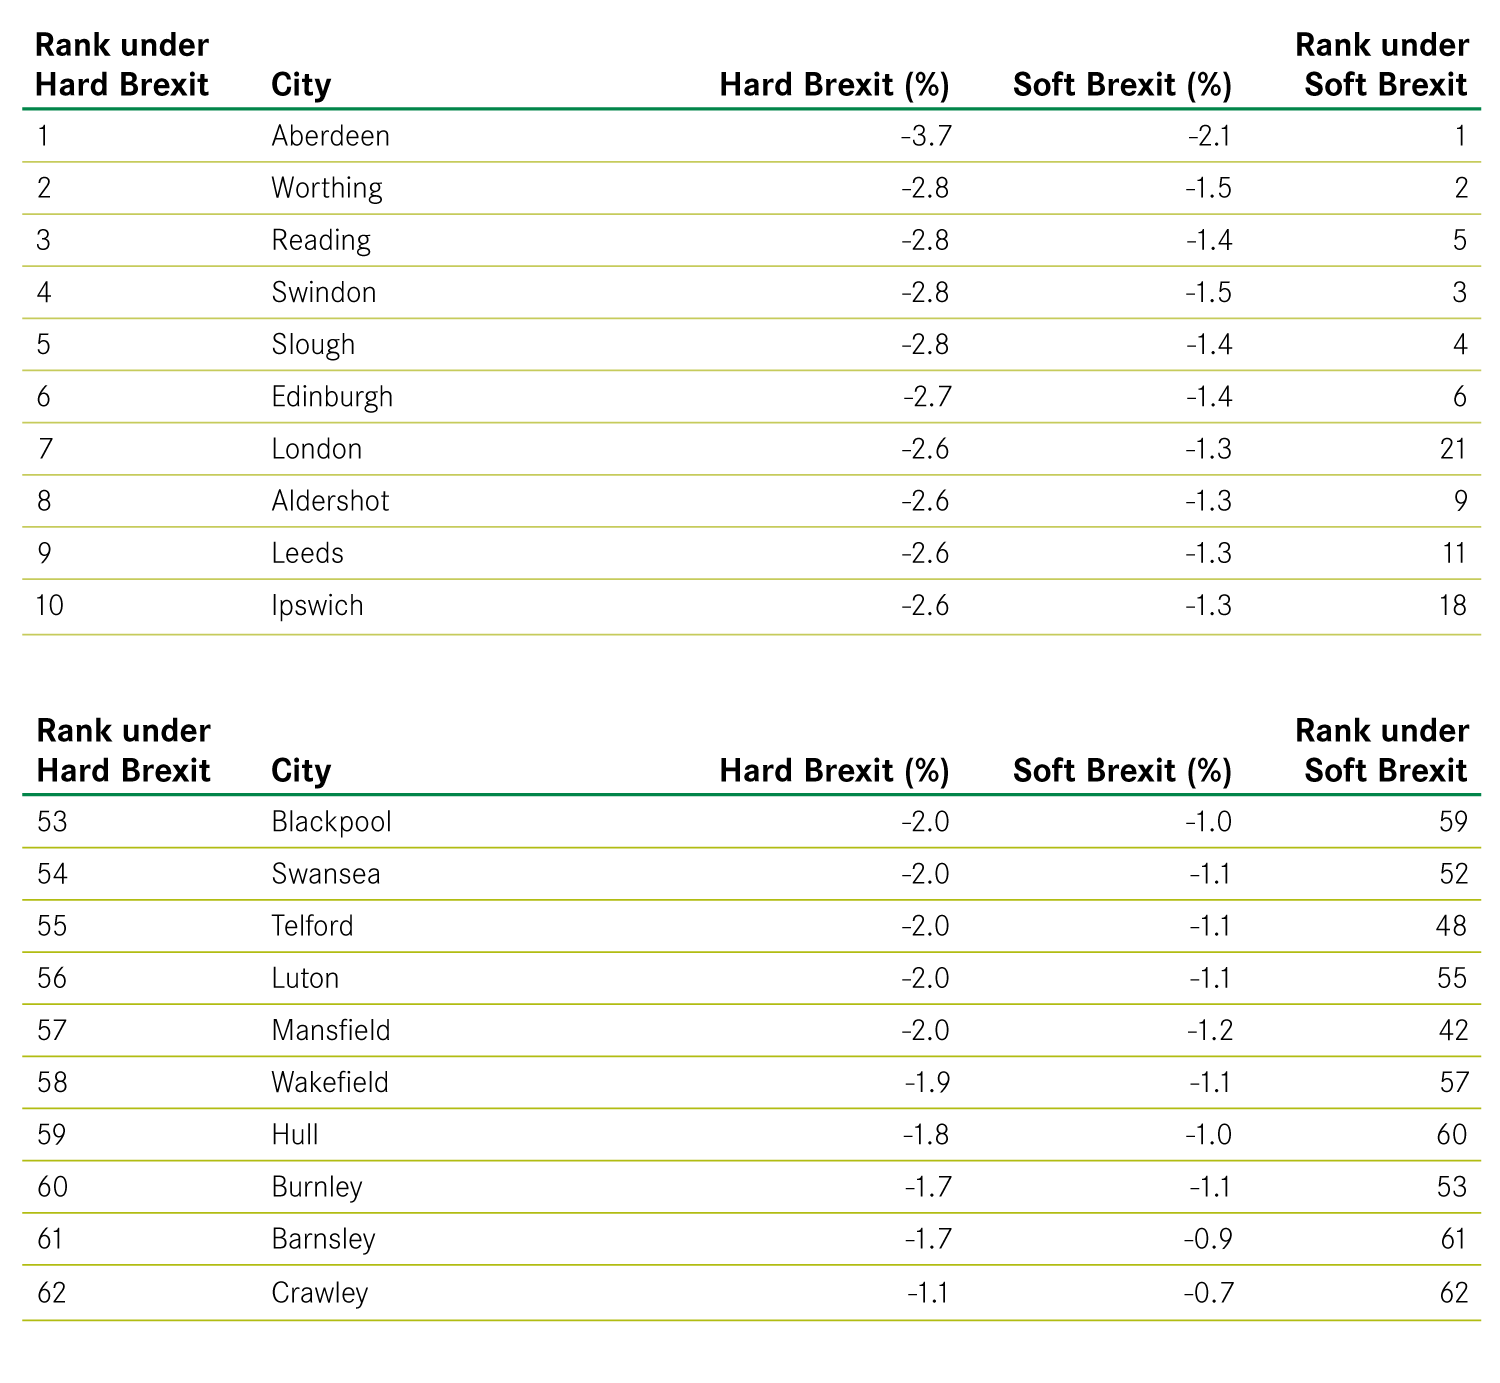
Figure 4: Predicted GVA shocks by city
Soft Brexit GVA shocks by City

Hard Brexit GVA shocks by City
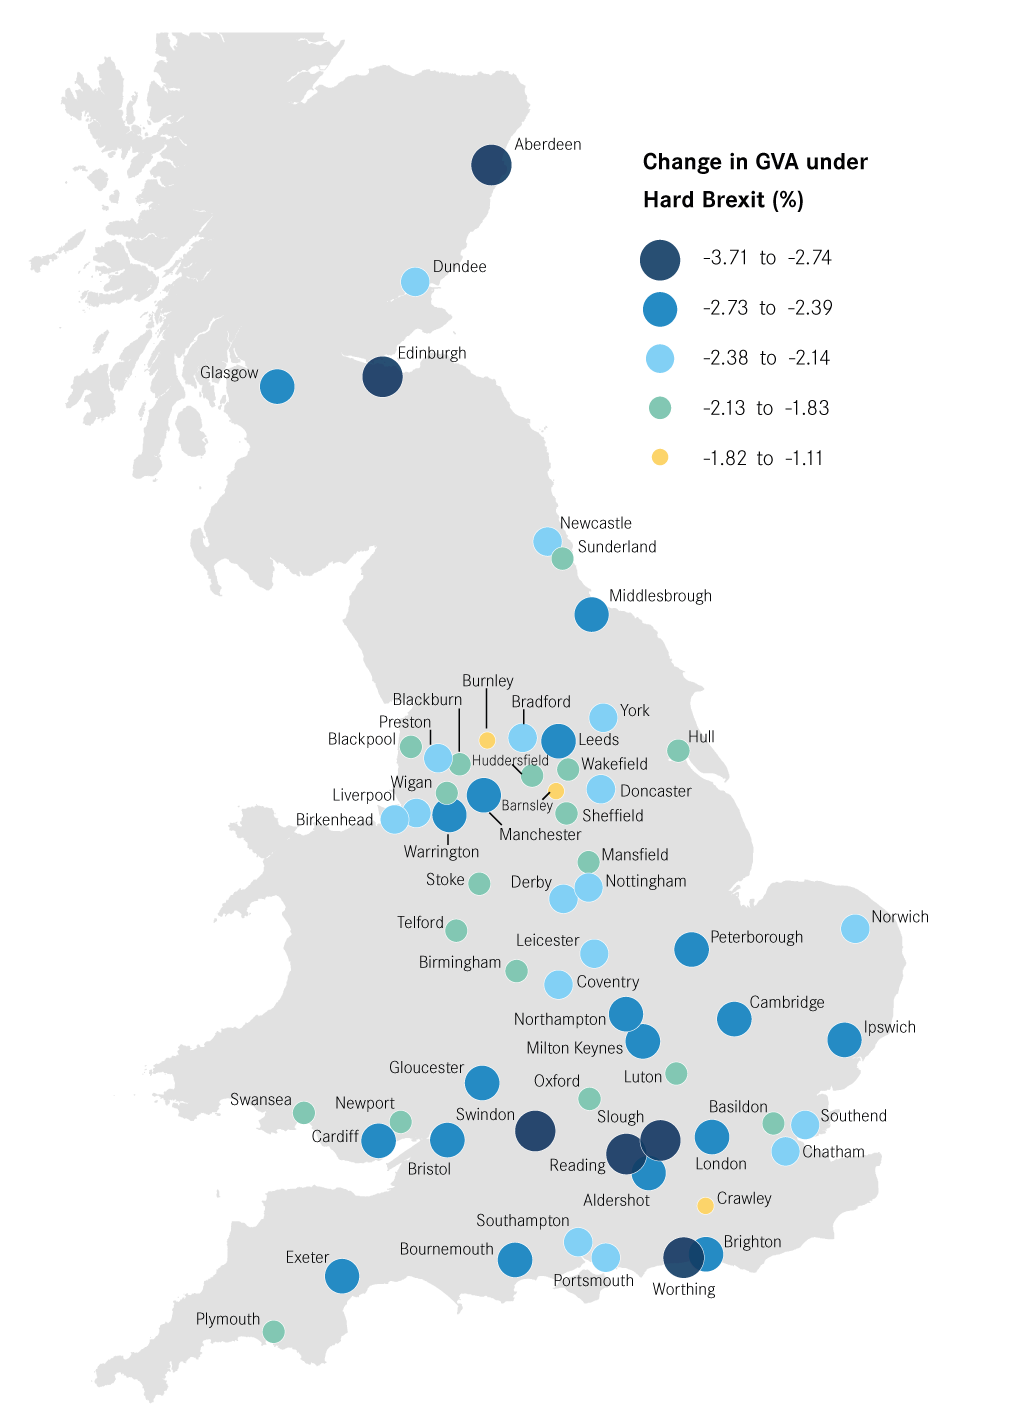
Figure 5: KIBS and predicted GVA shocks
Soft Brexit

Hard Brexit
Box 2: Correlation with the Brexit vote
Areas that are predicted to be most negatively affected by Brexit were more likely to vote remain in the 2016 referendum (Figure 6). While the relationship is not strong, it is a striking contrast to other studies that have suggested that areas which voted strongly to leave are likely to be the worst affected.11
The findings from this study differ from others for several reasons. First, studies based on measures of trade exposure to the EU market underestimate the importance of increases in non-tariff barriers. Second, they ignore the willingness of individuals and firms to substitute away from foreign to domestic supply as trade costs rise. CEP’s model accounts for both these factors and as a result produces a different prediction of the geographical pattern for places that will be most affected.
Figure 6: Correlation between predicted impacts and referendum vote
Soft Brexit

Hard Brexit

Source: CEP analysis, 2017 and BRES, 2017
Cities predicted to be most negatively affected may find it easier to adapt in the longer term.
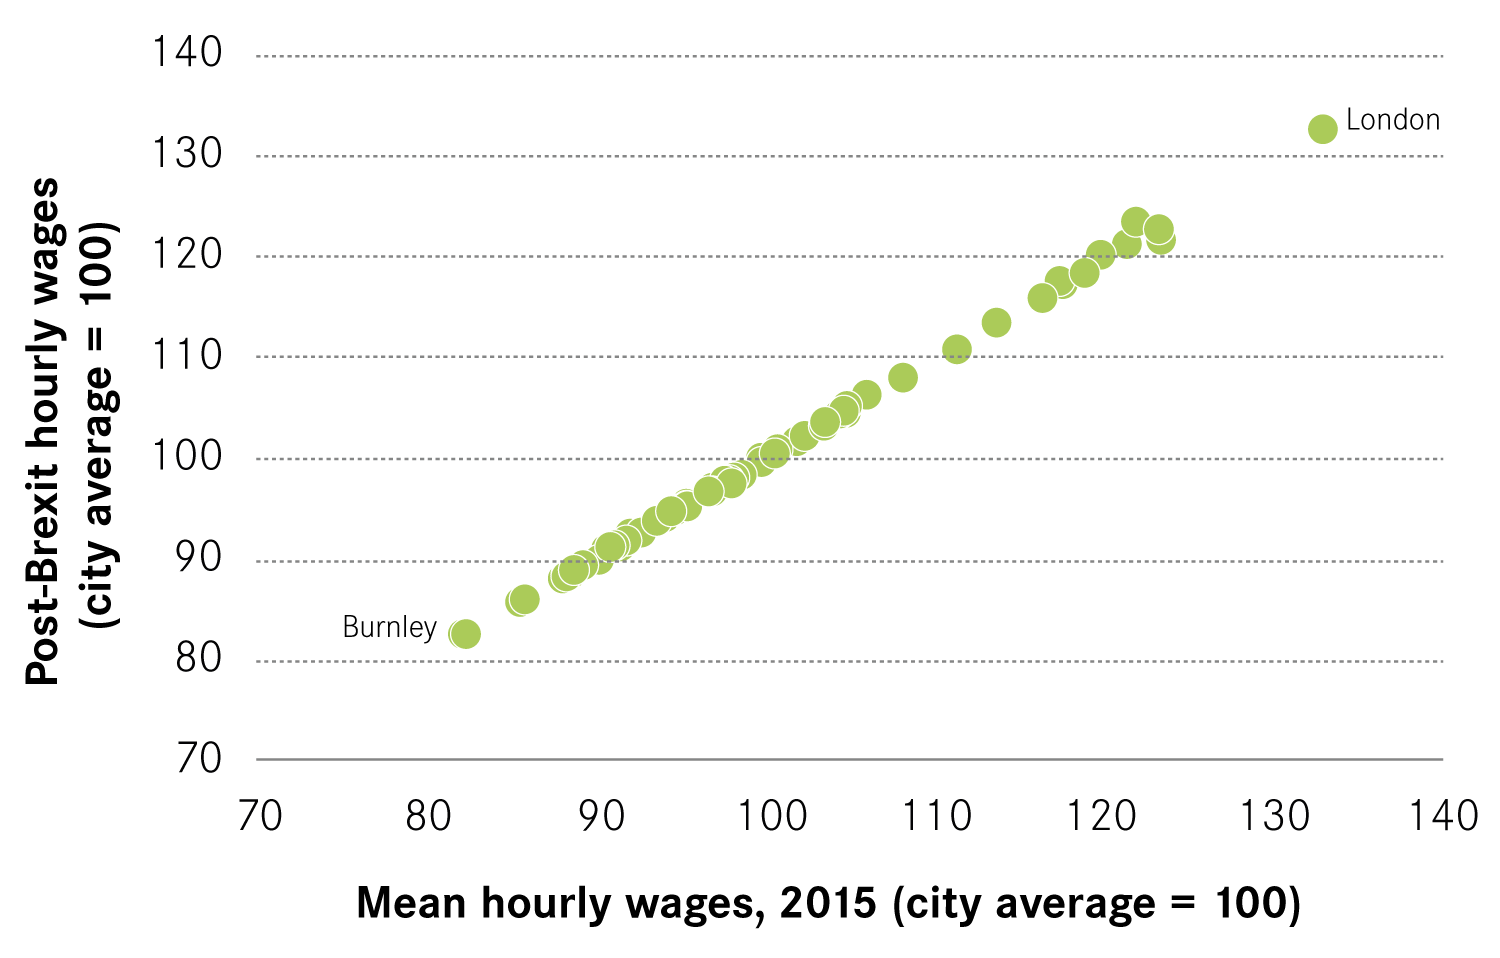
Cities that are predicted to be most negatively impacted tend to have higher average earnings (Figure 7). The disparities swamp the expected impacts of Brexit. Average hourly earnings are 1.6 times higher in London compared to Burnley, for example. Predictions of differences in the impact of Brexit will make little impact on these disparities – the gap between London and Burnley is reduced by 1.4 percentage points (Figure 8). More generally, only a handful of cities move one or two places in the overall ranking.
Differences in cities ability to adapt to Brexit-related changes may mean that the gap between cities widens in the long run. Even though the immediate negative impacts are predicted to be smaller in poorer regions, households in those areas start off poorer and may experience considerably more difficulty in adapting to those negative changes.
Here there is a parallel with the 2008 financial crisis, and specifically the contrast between the immediate and long run impacts, which saw London and the South East hit hardest before recovering much more strongly than other areas of the UK. Cities with more highly skilled workforces pre-2008 tended to be less negatively affected during this period.12
Overall, this suggests that the cities predicted to be most negatively impacted, which also tend to have higher wages, larger pools of graduate labour and a more innovative business base, may not necessarily experience the most negative effects once the economy has adjusted.
Figure 7: Correlation between predicted impacts and earnings
Soft Brexit

Hard Brexit
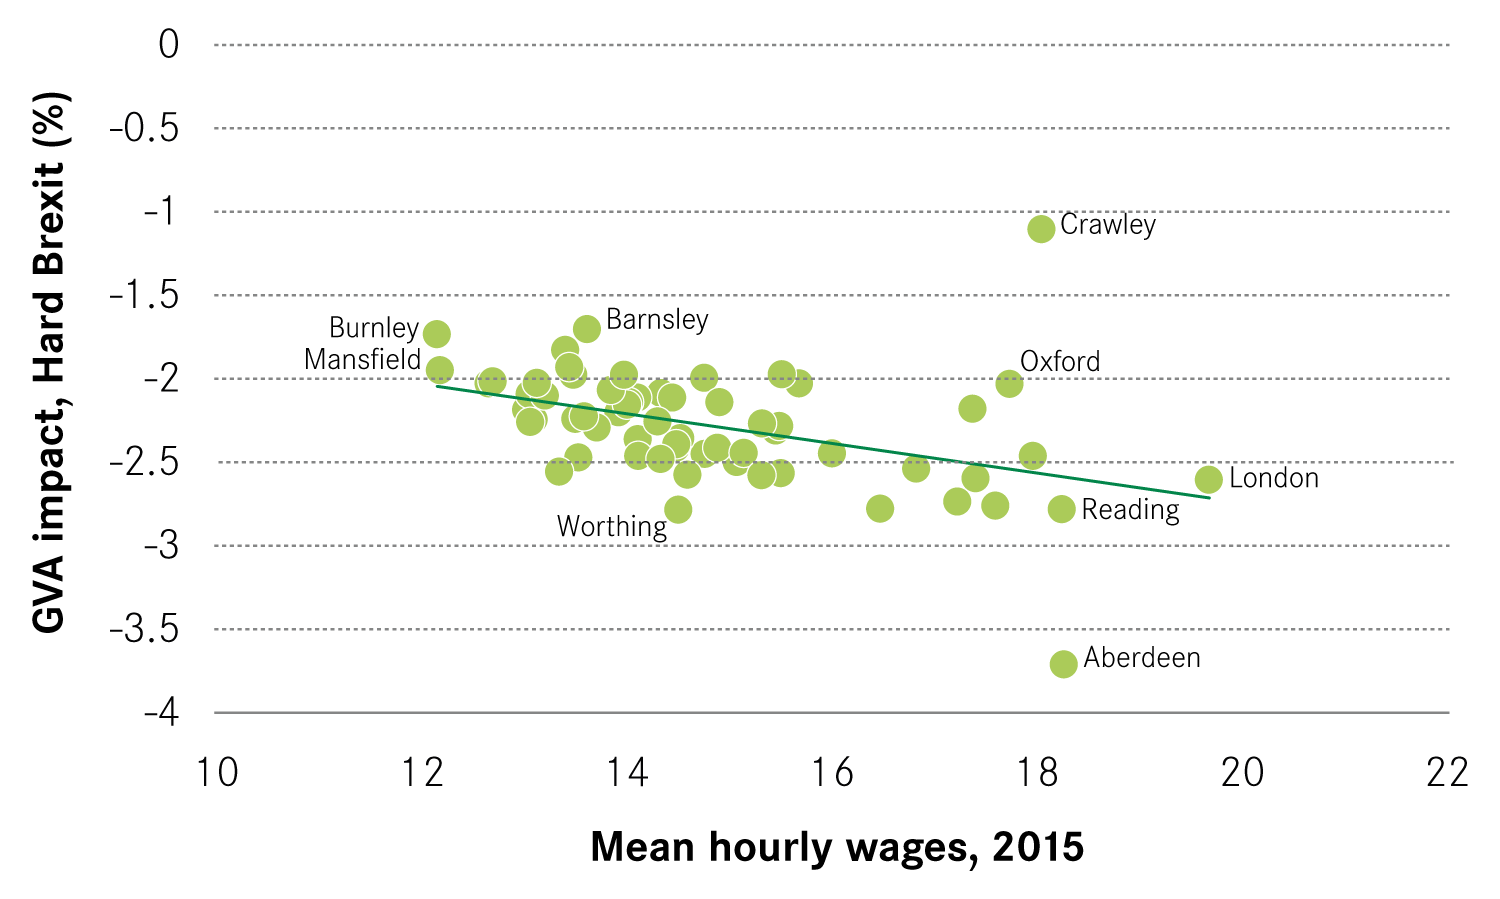
Figure 8: Disparities in 2015 wages and post-Brexit wages (indexed to city average)