
01Job creation in the enterprise zones
The main stated reason for a new round of enterprise zones was to boost job creation across the country by removing barriers to growth faced by the private sector. This section looks at the impact of the first 24 enterprise zones on jobs in their local area.
Box 2: What can we learn from the first round of enterprise zones?
Enterprise zones were first introduced under the Thatcher and Major governments. Between 1981 and 1997, 38 enterprise zones were set up, mainly to regenerate derelict sites in areas where private sector investment in property was unlikely. They offered similar incentives to the ones set up in 2011 such as 100 per cent discount on capital allowances on investment in property, and exemption from business rates.
There are four lessons that can be learnt from the evidence on this first round.
- They regenerated derelict areas. Former enterprise zones such as the Isle of Dogs and Salford are completely different from the way they looked in the 1980s. But regenerating brownfield land like this is no longer the priority for the current enterprise zones.
- But they did not create many jobs. During the first round of enterprise zones, between 1981 and 1997 the total number of jobs in the zones increased by between 96,000 and 125,000, many of which were in London. But many of these jobs were displaced from elsewhere: only 58,000 of these were net additional jobs.
- Urban zones with good transport links grew the fastest whereas non-urban areas grew the slowest.
- They were expensive. Between 1981/82 and 1992/93 the total public sector cost of the enterprise zones was £1.21 billion (in 2010/11 prices). Rate relief and capital allowances accounted for 90 per cent of this. This means that each job cost around £28,540.
Jobs growth has been underwhelming
Back in 2011 when the new round of zones was announced, the Treasury predicted that this policy would create up to 54,000 jobs by 2015.9 But job creation has fallen well short of this target. As Figure 2 shows, in 2017 there were 17,500 more jobs in the 24 zones than in 2012 (the year in which they became operational). Even if the entire increase is attributed to the enterprise zone policy alone, this would still be less than a third of what the Treasury initially predicted.
Figure 2: Jobs change in enterprise zones, by selected sectors, 2012-2017
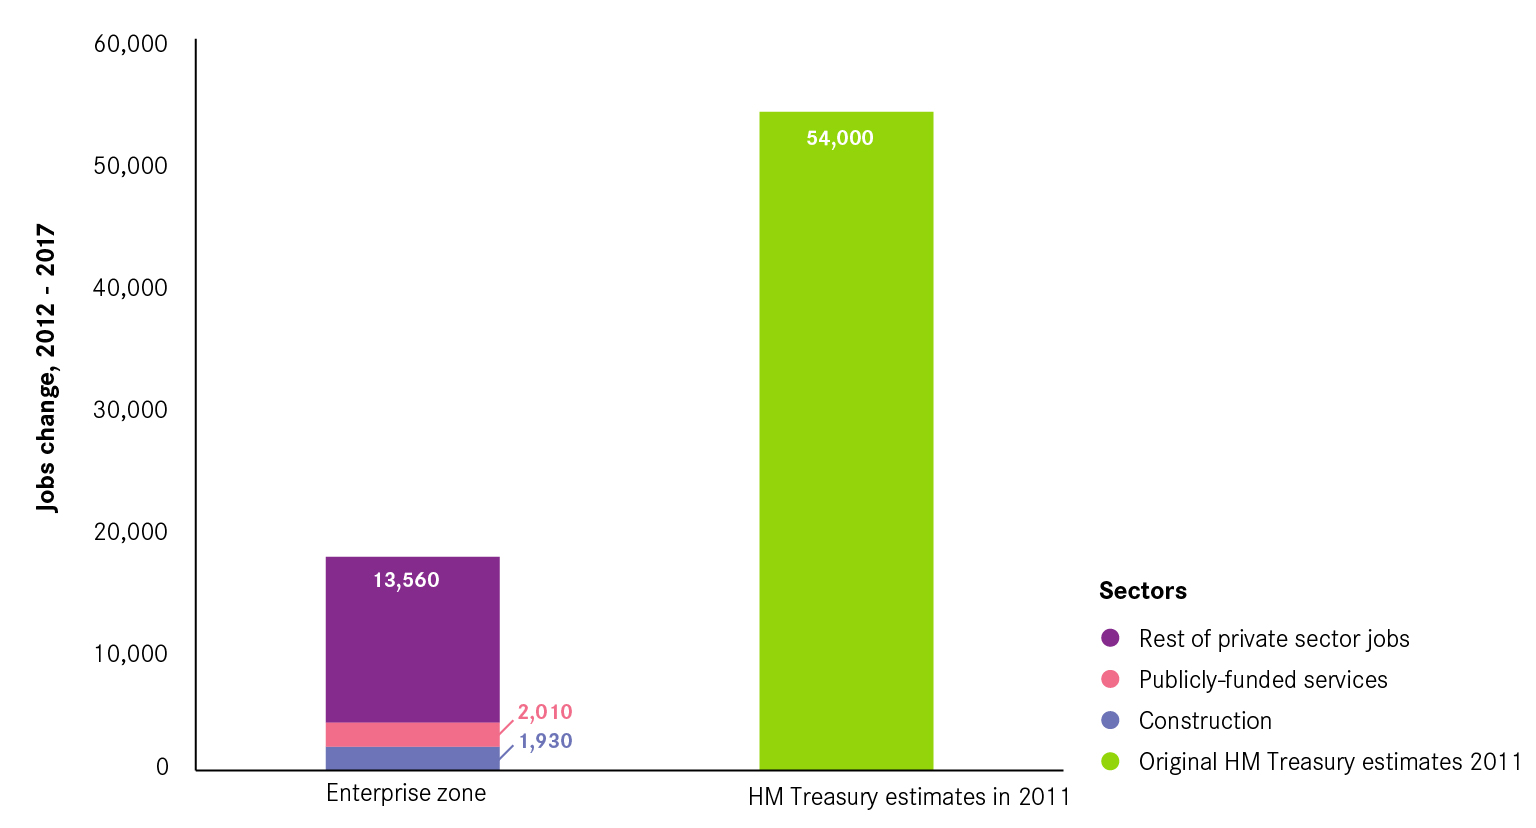
Making further adjustments reduces this number still further. Around 2,000 jobs were in publicly-funded activities,10 so do not count towards the original goal of creating private sector jobs. And nearly 2,000 were construction jobs, which are likely to have been only temporary. Removing both of these categories reduces the total to 13,560.
Box 3: Jobs growth in individual zones
There has been much variation across the zones in terms of the jobs created. As Figure 3 shows, the zone in Bristol and Bath tops the list, with over 5,000 jobs created. This was followed by zones in Liverpool and Birmingham. The majority of these zones are located in city centres that have performed well in recent years, and so build upon this success. Meanwhile, Humber and Lancashire, identified for zones because of the closure of large employers in the area, had fewer jobs in 2017 than 2012.
Figure 3: Job creation in different enterprise zones, 2012-17

The jobs created were mainly in low-skilled local services activities
The goal of any economic policy should be to attract higher-skilled exporting businesses. This is because:
- These businesses tend to be more productive and are the drivers of productivity growth, so increasing wages and standards of living in an area.12
- They sell beyond the area they are based in, so these companies bring money into a local economy, which in turn creates jobs in businesses that sell to the local market only, such as restaurants, coffee shops and gyms.13
The aim of enterprise zones should be no different if they want to improve the performance of the wider economies in which they are based. Breaking down the jobs data by sector and skill level, 14shows that the jobs were skewed very heavily towards low-skilled activities in local services such as retail (see Figure 4).
Figure 4: Jobs change by skill and activity, 2012-2017

Displacement accounted for over a third of the ‘new’ jobs
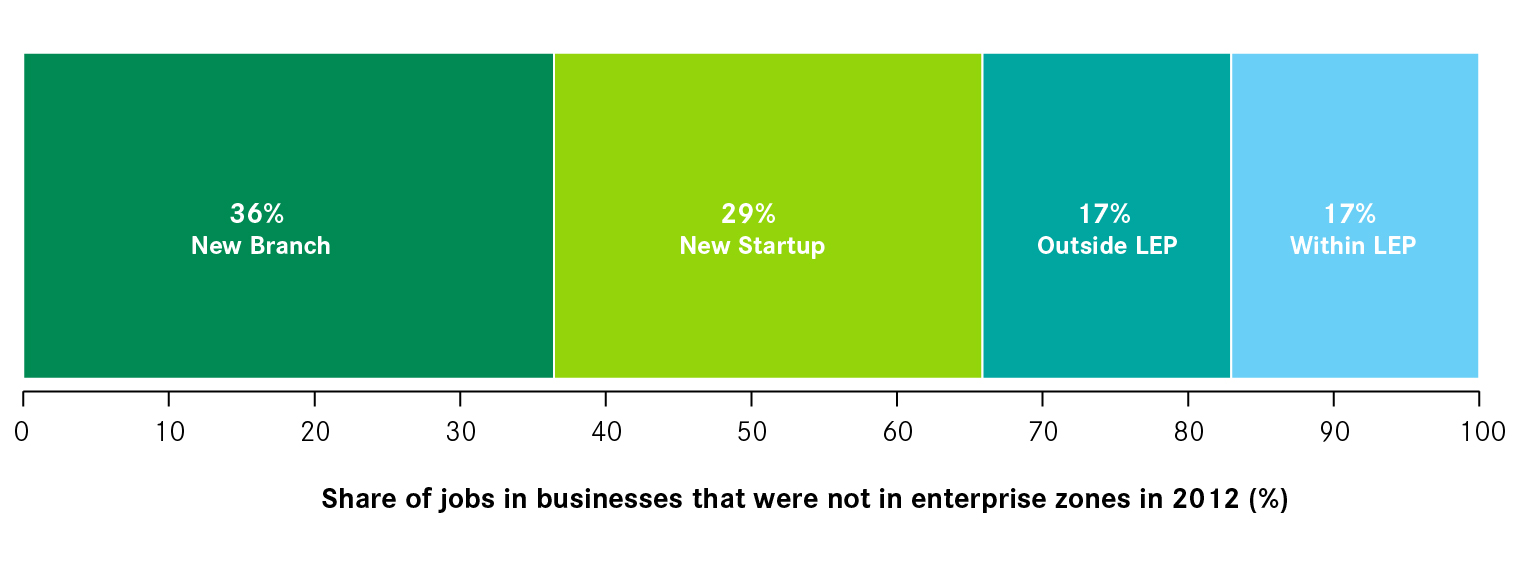
Looking at the history of businesses that located in enterprise zones after their creation gives an indication as to how much of the jobs growth was in ‘new’ jobs and how much was a result of jobs being moved from elsewhere. Figure 5 splits new businesses in the zones into two groups – businesses that did not exist before 2012, and businesses that existed elsewhere. It shows that, of all the new jobs in the zones, 17 per cent were in businesses that moved from elsewhere in the same LEP, and 17 per cent were in businesses that moved from elsewhere
in Britain.
This is likely to be an underestimate. Splitting new businesses into new start-ups and new branches of existing businesses shows that a further 36 per cent of jobs were in a branch of an existing business. While the data does not show whether the jobs in branches were new positions or were transferred from elsewhere, it is likely that at least some of these jobs would have transferred and so displacement is likely to have been even larger.
A further level of displacement could play out through the displacement of demand. For local services businesses, the opening of a new business within the zone (for example a coffee shop) could come at the cost of taking business away from a local services business elsewhere in the locality. Without increasing the overall level of demand through attracting in more export-focused businesses, demand will instead be shuffled around.
Figure 5: Breakdown of ‘new’ jobs in enterprise zones in 2017 by origin of business
Box 4: Is displacement always bad?
Displacement is not necessarily a bad thing for an economy. Concentrating dispersed economic activity in one place can improve the productivity of the displaced businesses for three main reasons:
It lowers the costs of public service provision such as transport, broadband and services to businesses.
It increases the number of potential workers that a business
can recruit.
It makes it easier for businesses to share ideas and information, a process known as ‘knowledge spillovers’.
It is for these reasons that knowledge-based business services have increasingly been locating in successful city centres in recent years, and any policy which facilitates the same clustering in weaker city centres could lead to an improvement in their productivity even if there is no increase in the number of jobs.
Enterprise zones in city centres performed better than zones in other areas
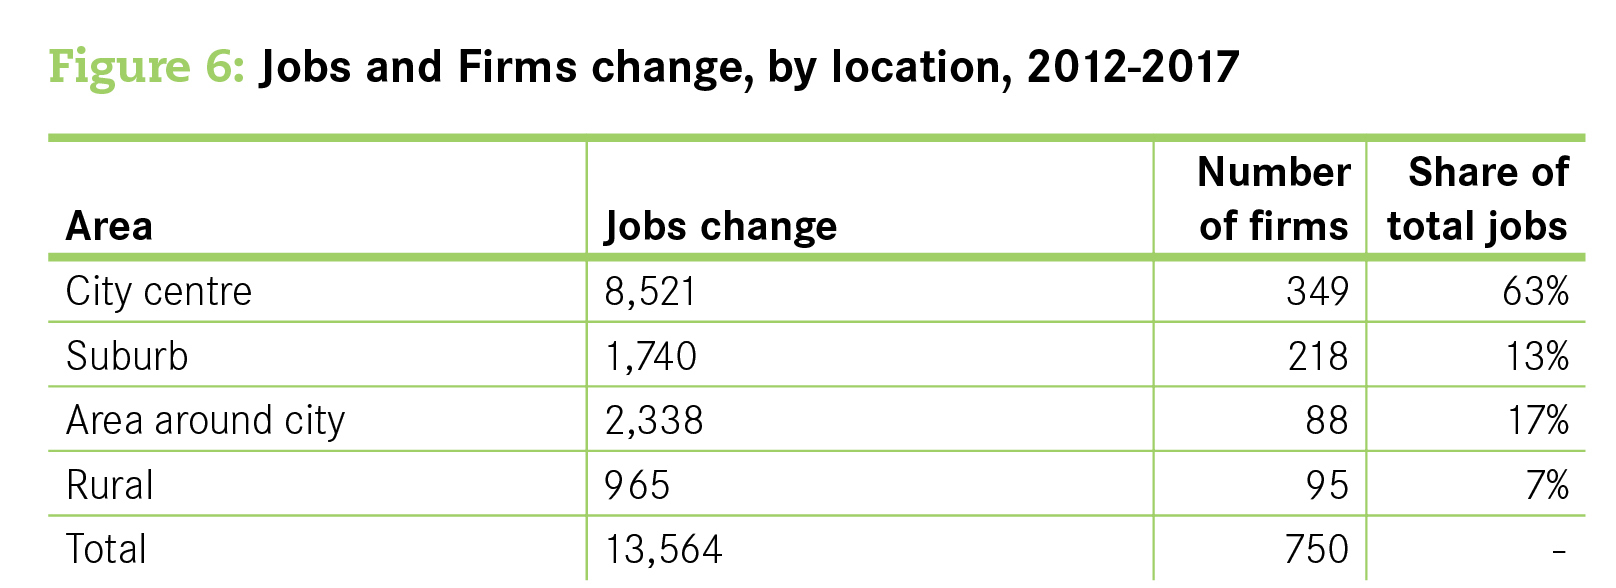
The performance of enterprise zones varied according to location. Grouping the location of zones into city centres, suburbs, areas around cities and deeper rural locations17 shows that while all groups created jobs, city centre zones performed much more strongly than elsewhere. City centre zones accounted for 63 per cent of the jobs growth (8,520 jobs) despite covering just 6 per cent of the total land covered by the zones overall.
Figure 6: Jobs and Firms change, by location, 2012-2017 Area Jobs change Number of firms Share of total jobs
The question remains however as to whether these jobs would have been created without the zones in place. This is particularly an issue within city centre zones, where there is already a great deal of economic activity, as opposed to the development of a previously unoccupied site on the edge of town, for example.
The data suggests that they may well have. As a group, the zones in a city centre location did not perform any better than city centres as a whole across Britain over the period — both saw their total number of jobs increase by 22 per cent between 2012 and 2017. This means that, even in the areas where they seemingly had the greatest success, this may have been reflective of wider trends rather than being a result of the policy.
A counter-argument to this is that the enterprise zones were able to bring land back into use that the private sector alone would not have done, and so addressed a market failure in the commercial property market. This was a key argument for the introduction of the first round of the zones in the 1980s and 1990s. While this may have been the case, an enterprise zone is just one of a number of ways of addressing this problem.