01Introduction
Overall, the British economy has grown over the past 10 years. But while there are more jobs now than there were 10 years ago, salaries have stagnated and, crucially for the national exchequer, national tax receipts have also been lower than expected in recent years.2
There are many factors at play in the complex relationship between employment, wages and tax revenues. But despite their importance to the national finances – cities account for 59 per cent of jobs and 64 per cent of economy-led taxes (see Box 1 below) – the nature and geographic spread of employment and economic activity, and how this translates into tax revenues, is rarely considered.
Understanding how and where taxes come from is important: tracking tax revenues can highlight important trends about the contribution of different parts of the economy to the national finances, and this is all the more true in an uncertain political and economic context.
Centre for Cities’ research consistently shows a clear geography of economic performance across the country. And last year, our analysis showed that patterns of tax and spend reflect this geography: cities generate the lion’s share of national revenues and are also more ‘tax productive’ than non-city areas.3 But there are significant differences between places and until now, we have had little idea of how this has changed over time.
In the 10 years from 2004/05 to 2014/15 the UK economy had two governments and underwent one of the deepest recessions it has experienced. In the UK, the recovery from the ‘great recession’ has been driven by what has been called a ‘jobs miracle’. But this jobs miracle has also been accompanied by concerns about stagnant wage levels, the quality of jobs created and the geography of the recovery, with some places not seeing economic growth and prosperity levels recover.
At the same time, reforms to the personal allowance (the threshold at which individuals start to pay tax on income) have reduced the tax burden for many on low wages, with the parallel effect of reducing tax revenues for the exchequer.
The focus of government policy to date has been to increase the number of people in work in order to keep the economy going after the recession. But given continuing concerns over productivity and disappointing tax returns, it is important to understand what the impact of the recession alongside later policy reforms have had on where and how taxes are generated across the country.
This report explores what a decade of data on taxes can tell us about the economy of British cities and their impact on the public purse. Building on the analysis of tax revenues and public spending Centre for Cities produced last year, this report provides a first look at the breakdown of economy taxes by city over the past 10 years, from 2004/05 to 2014/15, which allows a better understanding of the long-term performance of tax receipts generated in cities and the impact of external and policy shocks on those revenues.
First it explores how the levels and patterns of taxes generated in cities over the decade have changed, looking at how ‘tax productive’ different cities are and how the distribution of revenues has evolved across urban Britain, including the impact of the ‘great recession’ on the economy related taxes generated in British cities. The report then sets out how the patterns and trends observed in the data reflect the impact that the recession, the nature of the recovery, and policy reforms have had on different cities.
Box 1: What are economy taxes?
As in our previous report, the analysis focuses on the levels of ‘economy taxes’ generated in British cities3. These taxes, which include income tax, VAT and corporation tax for example, are dependent on the growth of the economy.5
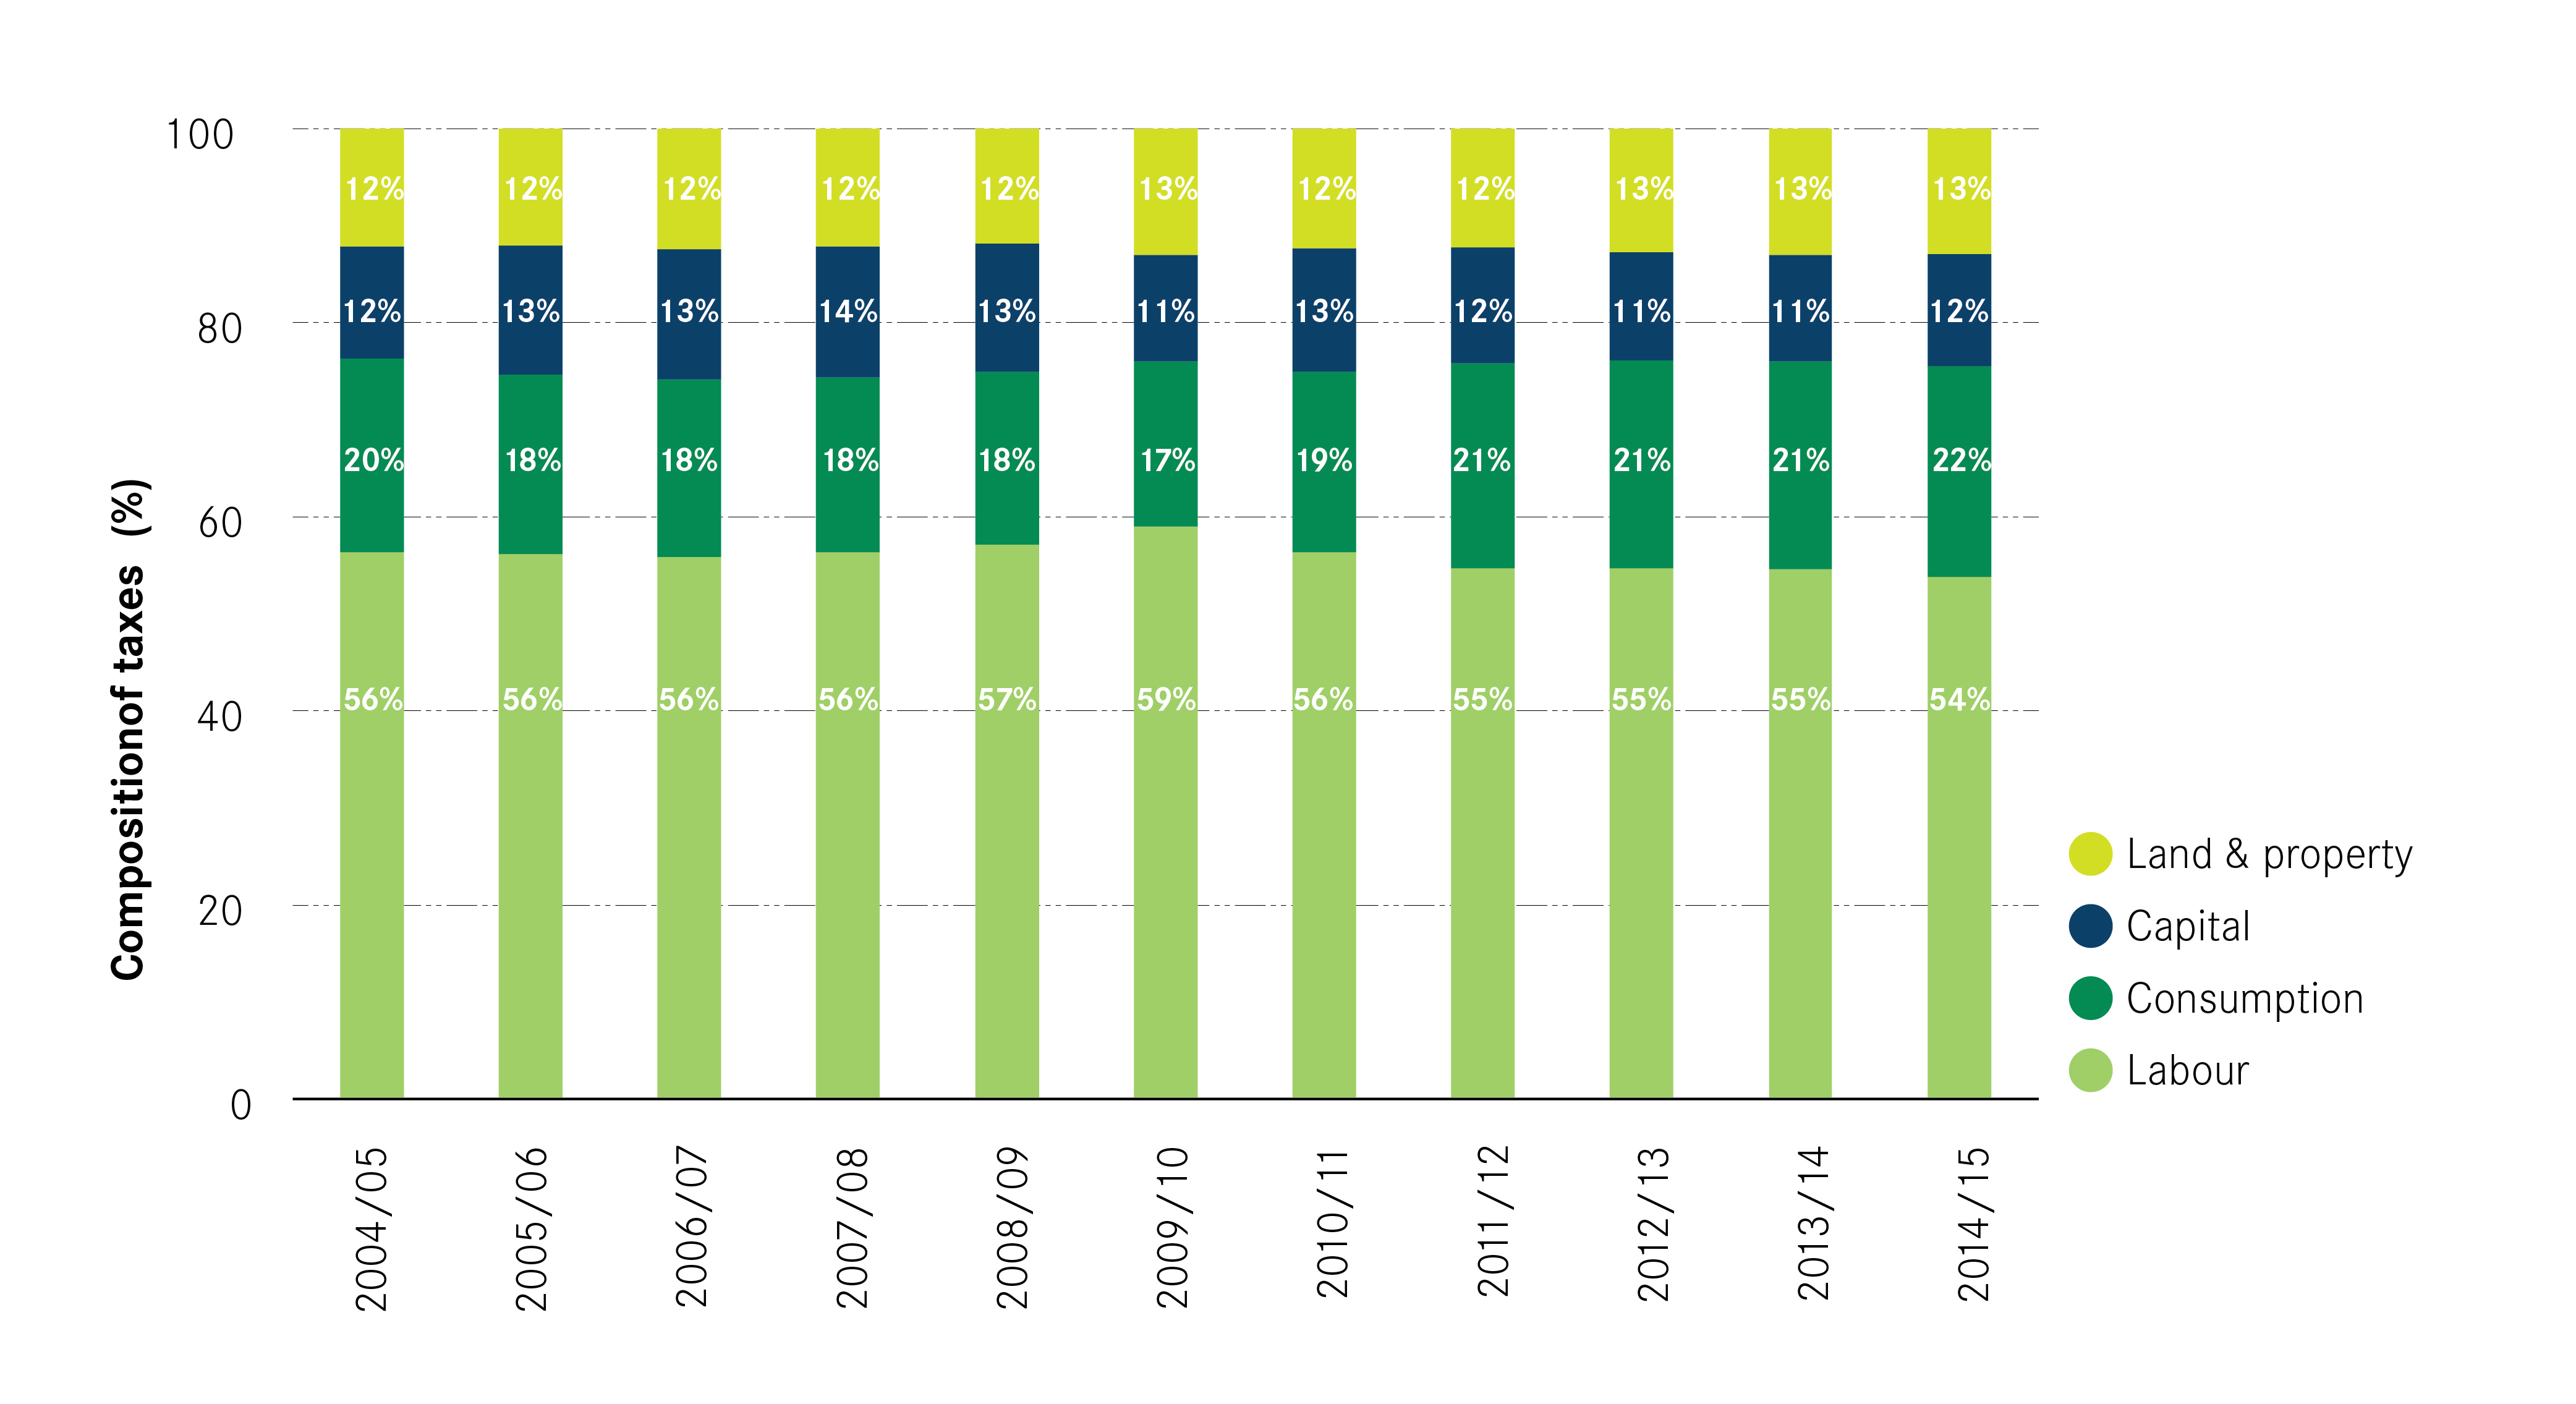
Broadly speaking the relative contribution of the different tax types has remained constant over the decade, with labour taxes contributing over half and VAT about a fifth of all economy taxes – see Figure 1 below. In 2014/15 labour taxes fell to their lowest share of 54 per cent while VAT accounted for its highest over the decade, at 22 per cent of total economy taxes generated. This suggests that while labour taxes were highly sensitive to the effects of the recession, VAT is less so: while people are likely to spend less during recession, there is a minimum amount of consumption on essential goods that will continue even in recession.
Figure 1: Composition of economy of taxes in Britain, 2004/05-2014/14