
Which city centres had the best Christmas, and which had the worst?
Data on credit and debit card spending levels where people spent the most in the run up to Christmas.
Data on credit and debit card spending levels where people spent the most in the run up to Christmas.
The government’s decision to lift restrictions and reopen non-essential retail early December was meant to provide high streets some respite for the Christmas period after a chaotic year. Has it worked? Here are three things we have learnt from the latest High Street Recovery Tracker update.
On average, spending rose 44 percentage points compared to November levels across Britain’s largest town and city centres, the strongest monthly recovery seen since March. But while this boost will no doubt have been welcome, overall levels of spend were weak. Total spend was just 84 per cent of February 2020 levels, and so likely to have been well below December 2019 ones.
Smaller cities saw the biggest Christmas boost: sales were up 60 percentage points from the last week of November, and reached a 120 per cent recovery. This was largest in Middlesbrough city centre, where sales increased five fold.
The recovery in large city centres in particular was much more muted. While spending in Central London was up on November, it was just half of February levels. The jump from November was more pronounced in Manchester, Birmingham, Bristol and Newcastle, but this was to levels of spend that equated to no more than 80 per cent of February levels (Figure 1).
High street businesses in Edinburgh had the worst run up to Christmas. Sales were up 5 percentage points on November, but they were just 29 per cent of February levels.
Figure 1: Change in spend levels December
| Rank | City- top 10 | Spend recovery | Change compared to last week of November (percentage point) | Rank | City-bottom 10 | Spend recovery | Change compared to last week of November (percentage point) |
| 1 | Middlesbrough | 187% | 154 | 53 | Sheffield | 83% | 42 |
| 2 | Birkenhead | 180% | 117 | 54 | Leeds | 82% | 48 |
| 3 | Mansfield | 152% | 82 | 55 | Newcastle | 80% | 60 |
| 4 | Wigan | 151% | 100 | 56 | Bristol | 80% | 55 |
| 5 | Telford | 148% | 102 | 57 | Birmingham | 79% | 62 |
| 6 | Liverpool | 147% | 108 | 58 | Cardiff | 74% | -38 |
| 7 | Plymouth | 146% | 114 | 59 | Manchester | 73% | 53 |
| 8 | Stoke | 146% | 116 | 60 | London | 53% | 16 |
| 9 | Crawley | 145% | 90 | 61 | Aldershot | 47% | -9 |
| 10 | Warrington | 145% | 72 | 62 | Edinburgh | 29% | 5 |
Source: Beauclair, 2020.
The tier system does not appear to have affected these patterns. Amongst large cities, there’s a big difference between Liverpool (Tier 2) and others that were all in Tier 3. But this seems to be something specific to Liverpool – Figure 2 shows there to be very little difference for smaller cities in the two tiers.
Figure 2: Tier restrictions impacted cities and large towns of different sizes in different ways
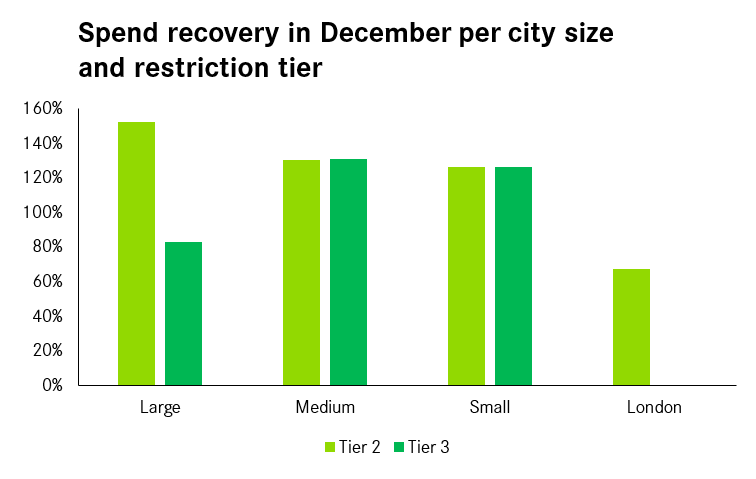
Source: Beauclair, 2020. Note: Here, Liverpool is the only large city in Tier 2.
If in many places Tier 3 restrictions made little difference, the introduction of Tier 4 on the 20th of December in London and most of the Greater South East is clearly visible in the numbers. In London, spending fell 35 percentage points in the final week. In Milton Keynes, Portsmouth and Peterborough, this drop was close to 90 percentage points. There was no final week rush in these city centres.
Christmas is the most important time of the year for the high street, and in recent years poor Christmas trading has led to the closure of high profile retailers in January. We now wait to see if the support measures put in place by the Chancellor are enough to stop a wave of closures in the coming months.
Leave a comment
Be the first to add a comment.