
Where there’s a will, and it pays: housing development success stories
Almost everyone agrees that we need to build more homes, but housebuilding rates vary greatly across the country and this could be due to local political will
Almost everyone agrees that we need to build more homes, but housebuilding rates vary greatly across the country and this could be due to local political will
It is widely accepted that large parts of the UK are experiencing a housing crisis. Supply is seemingly failing to keep pace with demand and affordability is taking the hit. Additionally, the delivery of new housing is occurring at vastly different rates in different UK cities. Assessing the data over the period from 2008 to 2017 gives some clues as to the reason for this.
The increase in homes over this period initially appears to indicate a North-South divide, with none of the top 10 cities for housing stock growth located in the North, and only Brighton and Southend of the bottom 10 located in the South. The map below illustrates this pattern, with cities in the South generally outpacing their Northern counterparts. In particular, both Cambridge and Milton Keynes saw more than 13% growth in housing stock in this period – a massive increase in the cities’ physical footprints.
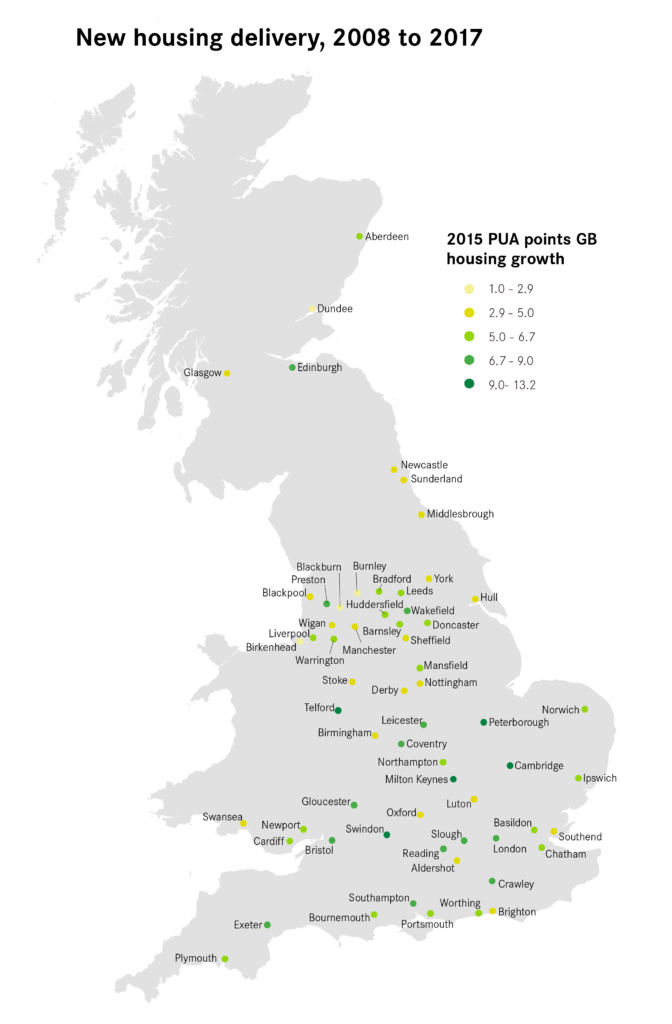
| Top 10 cities | Housing stock growth 2008-17 | Bottom 10 cities | Housing stock growth 2008-17 | |
| Cambridge | 13.2% | Hull | 3.8% | |
| Milton Keynes | 13.0% | Stoke | 3.7% | |
| Peterborough | 11.7% | Glasgow | 3.7% | |
| Telford | 9.9% | Southend | 3.5% | |
| Swindon | 9.9% | Brighton | 3.4% | |
| Gloucester | 8.9% | Blackpool | 3.2% | |
| Bristol | 8.8% | Blackburn | 2.9% | |
| Slough | 8.3% | Birkenhead | 2.5% | |
| Leicester | 8.1% | Dundee | 1.8% | |
| Exeter | 7.7% | Burnley | 1.0% |
However, the North-South divide is only a part of the story. The picture varies substantially across the South, as noted above. Brighton’s numbers lag considerably behind those of Milton Keynes and Cambridge, for example. While in the North, Preston at 7.3% housing stock growth is far outpacing nearby Burnley at 1.0%.
Yet it is also difficult to establish a correlation between economic indicators and housing stock growth. For example, it would be expected that the pace of housing development would to some extent reflect housing affordability in an area, yet pressure on housing affordability does not seem to be translating perfectly into housing stock growth. Cambridge, for example, appeared to respond to market pressures, with its large 2017 housing affordability ratio of 15.3 reflected in the growth of housing stock in the city. However, in Oxford, which had the largest ratio of 17.3, saw no such response. Other economic indicators show similarly weak correlations.
Because of this, it is worth assessing what the leading cities have in common that could be driving their strong performance in housing delivery. It is noteworthy that three of the top five (Milton Keynes, Peterborough, Telford) are 1960s “New Towns”, which boast a long history of using available land for development that has continued to the present day. Peterborough, for example, is seeing the development of an entirely new suburb in Hampton, in much the same vein as the construction of the original new districts of the city. Milton Keynes also continues to see growth on its periphery and on already-existing estates. These cities have seen the benefits of pro-development housing policy, and have no reason to change course. Indeed, a positive approach to new housing development is increasingly being adopted in booming Cambridge, illustrated by the Cambridge Southern Fringe growth site.
This is not to suggest that the New Towns’ propensity to build is in itself enough to drive housing stock growth. Instead, all three cities also enjoy economic conditions which increase housing demand, with the cities’ response to this demand coming in the form of a political commitment to permit large-scale development.
In cities such as Blackburn and Burnley, where the housing affordability ratio is low and there is limited pressure on the existing housing stock, then there is not a pressing need to increase the number of homes available. However, in cities such as Oxford or Brighton, where the economic growth and increased demand for housing are not being met with new homes, a change in the political will is needed to build the homes that they need in future. Without a change in approach in these cities, their growing unaffordability will likely impact their ability to attract workers and consequently stymie their efforts to maintain economic growth.
Leave a comment
Anthony Whitaker
For an interesting case study on Swindon’s impressive growth rates over the long term – despite a lack of formal ‘New Town’ powers and funding from central government – and how local political will helped make it happen see Neil Holly’s excellent article in December 2018’s TCPA Journal: https://www.tcpa.org.uk/journal