The unexpected increase in February’s inflation figures is bad news for the country as a whole, but particularly bad for certain parts of it. Towns and cities in the North continue to be at the sharp end of the cost of living crisis as prices accelerate more quickly than wages.
Burnley, Glasgow and Blackpool have the highest inflation rates
As Centre for Cities has been reporting, price increases have not been uniform across British cities and large towns. All cities and large towns are affected by high inflation but there is a clear north-south divide. Figure 1 shows that annual inflation in Burnley is 12.1 per cent (up from 11.8 per cent in January). In contrast, in cities in the South like Cambridge and London, prices are around 9.7 per cent higher than in February 2022, which is around 2.4 percentage points below the places most affected by the cost of living crisis.
Figure 1: Geographic differences between cities persist
| City |
Annual inflation,
(Feb 23 – Feb 22) |
Inflation last 2 years, (Feb 23 – Feb 21) |
City |
Annual inflation,
(Feb 23 – Feb 22) |
Inflation last 2 years, (Feb 23 – Feb 21) |
| Burnley |
12.1% |
18.3% |
Warrington |
10.3% |
16.0% |
| Glasgow |
11.8% |
17.7% |
Slough |
10.2% |
16.1% |
| Blackpool |
11.7% |
17.7% |
Crawley |
10.2% |
15.9% |
| Bradford |
11.7% |
17.6% |
Basildon |
10.2% |
15.9% |
| Dundee |
11.6% |
17.5% |
Swindon |
10.1% |
15.9% |
| Hull |
11.5% |
17.3% |
Aldershot |
9.9% |
15.8% |
| Blackburn |
11.4% |
17.5% |
Milton Keynes |
9.7% |
15.5% |
| Stoke |
11.3% |
17.2% |
Reading |
9.7% |
15.3% |
| Leicester |
11.3% |
17.3% |
London |
9.7% |
14.9% |
| Derby |
11.2% |
17.2% |
Cambridge |
9.6% |
14.9% |
Source: ONS; Beauclair; EPC Certificate, HMRC (PAYE). Centre for Cities’ calculations.
The differences highlighted above are mostly driven by factors like income levels and different energy consumption patterns. Because income levels tend to be lower outside the South, households are more likely to spend a higher share of their income on essentials like food and energy, where prices grew significantly. Households in cities outside the South are also more likely to live in less efficient dwellings and drive more often, so they need to consume more energy.
Price rises have far outstripped wage increases
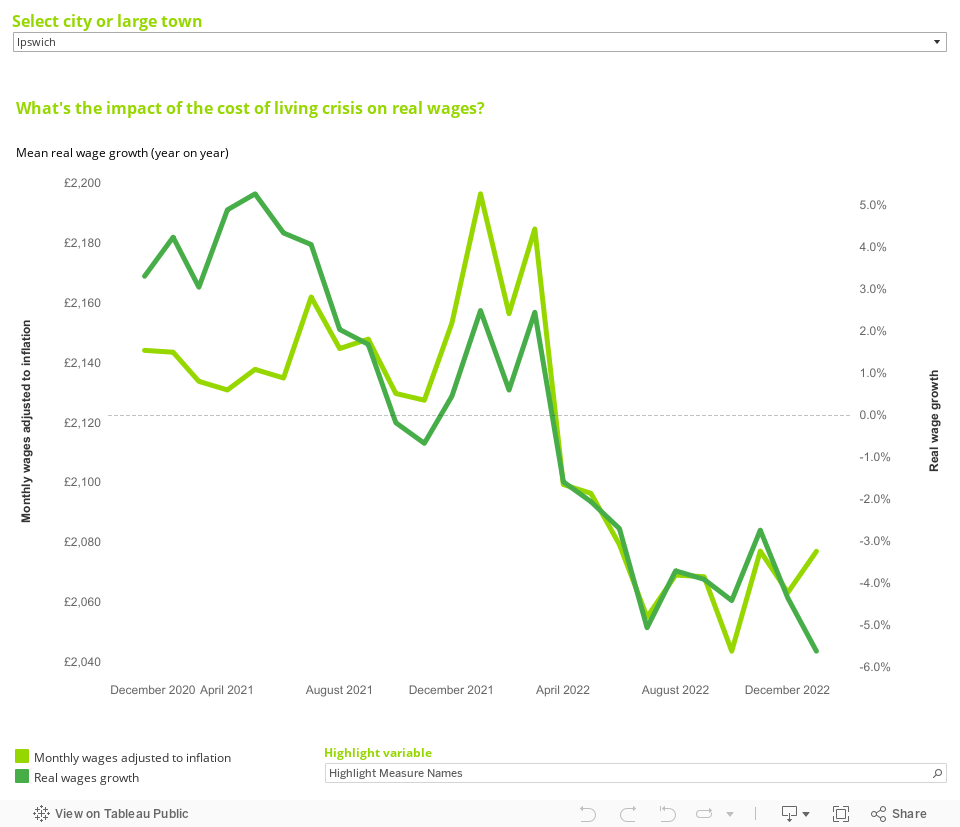
In recent months, wages in most cities have been growing in line with inflation. But this is not enough to cover a long period in which inflation was higher than wage growth. Take Leicester as an example. Figure 2 shows that average wages in Leicester were £2,043 in January 2021 and two years later, they are roughly £1,919 (at January 2021 prices). This is slightly higher than October 2022 (the lowest point at £1,898) but this is a £124 loss over a period of two years.
Figure 2: Real wages in Leicester have been declining over the last two years
Source: ONS; Beauclair; EPC Certificate, HMRC (PAYE), Centre for Cities’ calculations.
All 62 cities and large towns analysed have average wages lower than two years ago. Figure 3 shows that cities located in the North and Midlands – frequently more reliant on public sector jobs and manufacturing – were more likely to see stronger real wage losses due to a combination of higher inflation and weaker wage growth. Meanwhile, economies located in the Greater South East – often home to larger shares of knowledge-intensive business services jobs – were likely to be relatively more sheltered from wage losses in the last two years.
Figure 3: Workers living in cities and large towns in the Greater South East are likely to have lower real wage losses
Source: ONS; Beauclair; EPC Certificate, HMRC (PAYE), Centre for Cities’ calculations.
The OBR predicts that price increases will slow by the end of the year to 2.9 per cent nationally, and that February’s figures are a blip. This is welcome news given the squeeze on household finances, particularly in the North of England. But the figures above show that considerable real wage increases will be required to get those households just back to where they were in January 2021, never mind make them more prosperous. For that we’re going to need economic and, specifically, productivity growth.

")


Leave a comment
Be the first to add a comment.