
UK unemployment tracker
Centre for Cities tracks the latest unemployment claim statistics across the UK's cities and largest towns.

Unemployment claims continue to rise, but at a slower pace, suggesting the gradual phase out of the job retention scheme has not translated into unemployment. At least not yet.
As of the 10 September, the total number of people claiming unemployment related benefits in the UK had risen to 2.7 million, its highest level since the 1990s. According to the latest data released this morning by the Office for National Statistics, the number of people claiming Universal Credit or Job Seekers Allowance either because they are unemployed or on low-paid jobs is up by 1.4 million the figure in March, meaning the overall claimant count rate for the UK is now at 6.5 per cent.
While the number of people claiming unemployment related benefits continues to rise, the pace at which it is rising has gradually slowed down after the initial spike in April. The UK claimant count rate has risen by just 0.05 percentage points over the past month, down from 0.11 percentage points between July and August and 2 percentage points between March and April, suggesting the gradual phase out of the Coronavirus Job Retention Scheme has not – as yet – translated into a spike in unemployment.
With the exception of a handful of places, this is true everywhere in the country. Of the 63 largest cities and towns, half have seen pretty much no increase in the number of people claiming unemployment related benefits compared to last month, and six places have actually seen a decline in claimant count. Only eight cities have seen an increase in claims of 0.2 percentage points or more over the past month. Unfortunately, these are mostly places that have seen fast growth in unemployment related claims almost every month since the lockdown, like Crawley, London and Slough.
| City | Monthly percentage point increase in claimant count, Aug-Sept 2020 | City | Monthly percentage point increase in claimant count, Aug-Sept 2020 | ||
| 1 | Crawley | 0.5 | 54 | Edinburgh | 0 |
| 2 | Slough | 0.3 | 55 | Swindon | 0 |
| 3 | London | 0.2 | 56 | Glasgow | 0 |
| 4 | Derby | 0.2 | 57 | Portsmouth | 0 |
| 5 | Bradford | 0.2 | 58 | Preston | 0 |
| 6 | Coventry | 0.2 | 59 | Doncaster | -0.1 |
| 7 | Aberdeen | 0.2 | 60 | Exeter | -0.1 |
| 8 | Birmingham | 0.2 | 61 | Barnsley | -0.1 |
| 9 | Oxford | 0.1 | 62 | Mansfield | -0.1 |
| 10 | Brighton | 0.1 | 63 | Blackpool | -0.3 |
Source: ONS, Claimant Count August and September 2020. ONS, Population Estimates 2019
Note: Data is not seasonally adjusted
There is much more variation across the country when looking at the cumulative increase in the number of people claiming unemployment related benefits over the past six months. Unemployment claims have risen everywhere since March, with York, the least affected city, seeing a jump of 2.3 percentage points. London, Slough, Crawley and Luton have been more affected than any other city and town and, as of September, their rise in unemployment related claims was twice as large that of the best performing cities and towns like York and Exeter.
| City | Percentage point increase in claimant count, Mar-Sept 2020 | City | Percentage point increase in claimant count, Mar-Sept 2020 | ||
| 1 | Slough | 5.6 | 54 | Belfast | 3 |
| 2 | Luton | 5.4 | 55 | Mansfield | 2.9 |
| 3 | Crawley | 5.1 | 56 | Barnsley | 2.9 |
| 4 | London | 4.8 | 57 | Warrington | 2.8 |
| 5 | Bradford | 4.4 | 58 | Cambridge | 2.7 |
| 6 | Northampton | 4.3 | 59 | Preston | 2.7 |
| 7 | Brighton | 4.2 | 60 | Oxford | 2.6 |
| 8 | Birmingham | 4.1 | 61 | Swansea | 2.6 |
| 9 | Liverpool | 4.1 | 62 | Exeter | 2.4 |
| 10 | Blackpool | 4.1 | 63 | York | 2.3 |
Source: ONS, Claimant Count March and September 2020. ONS, Population Estimates 2019
As a result, these cities are quickly moving up the ranking when looking at the total number of people claiming. Luton and Slough are now in the top 10, while London and Crawley are in the top 15 – despite all of them entering the downturn with below average claimant count rates.
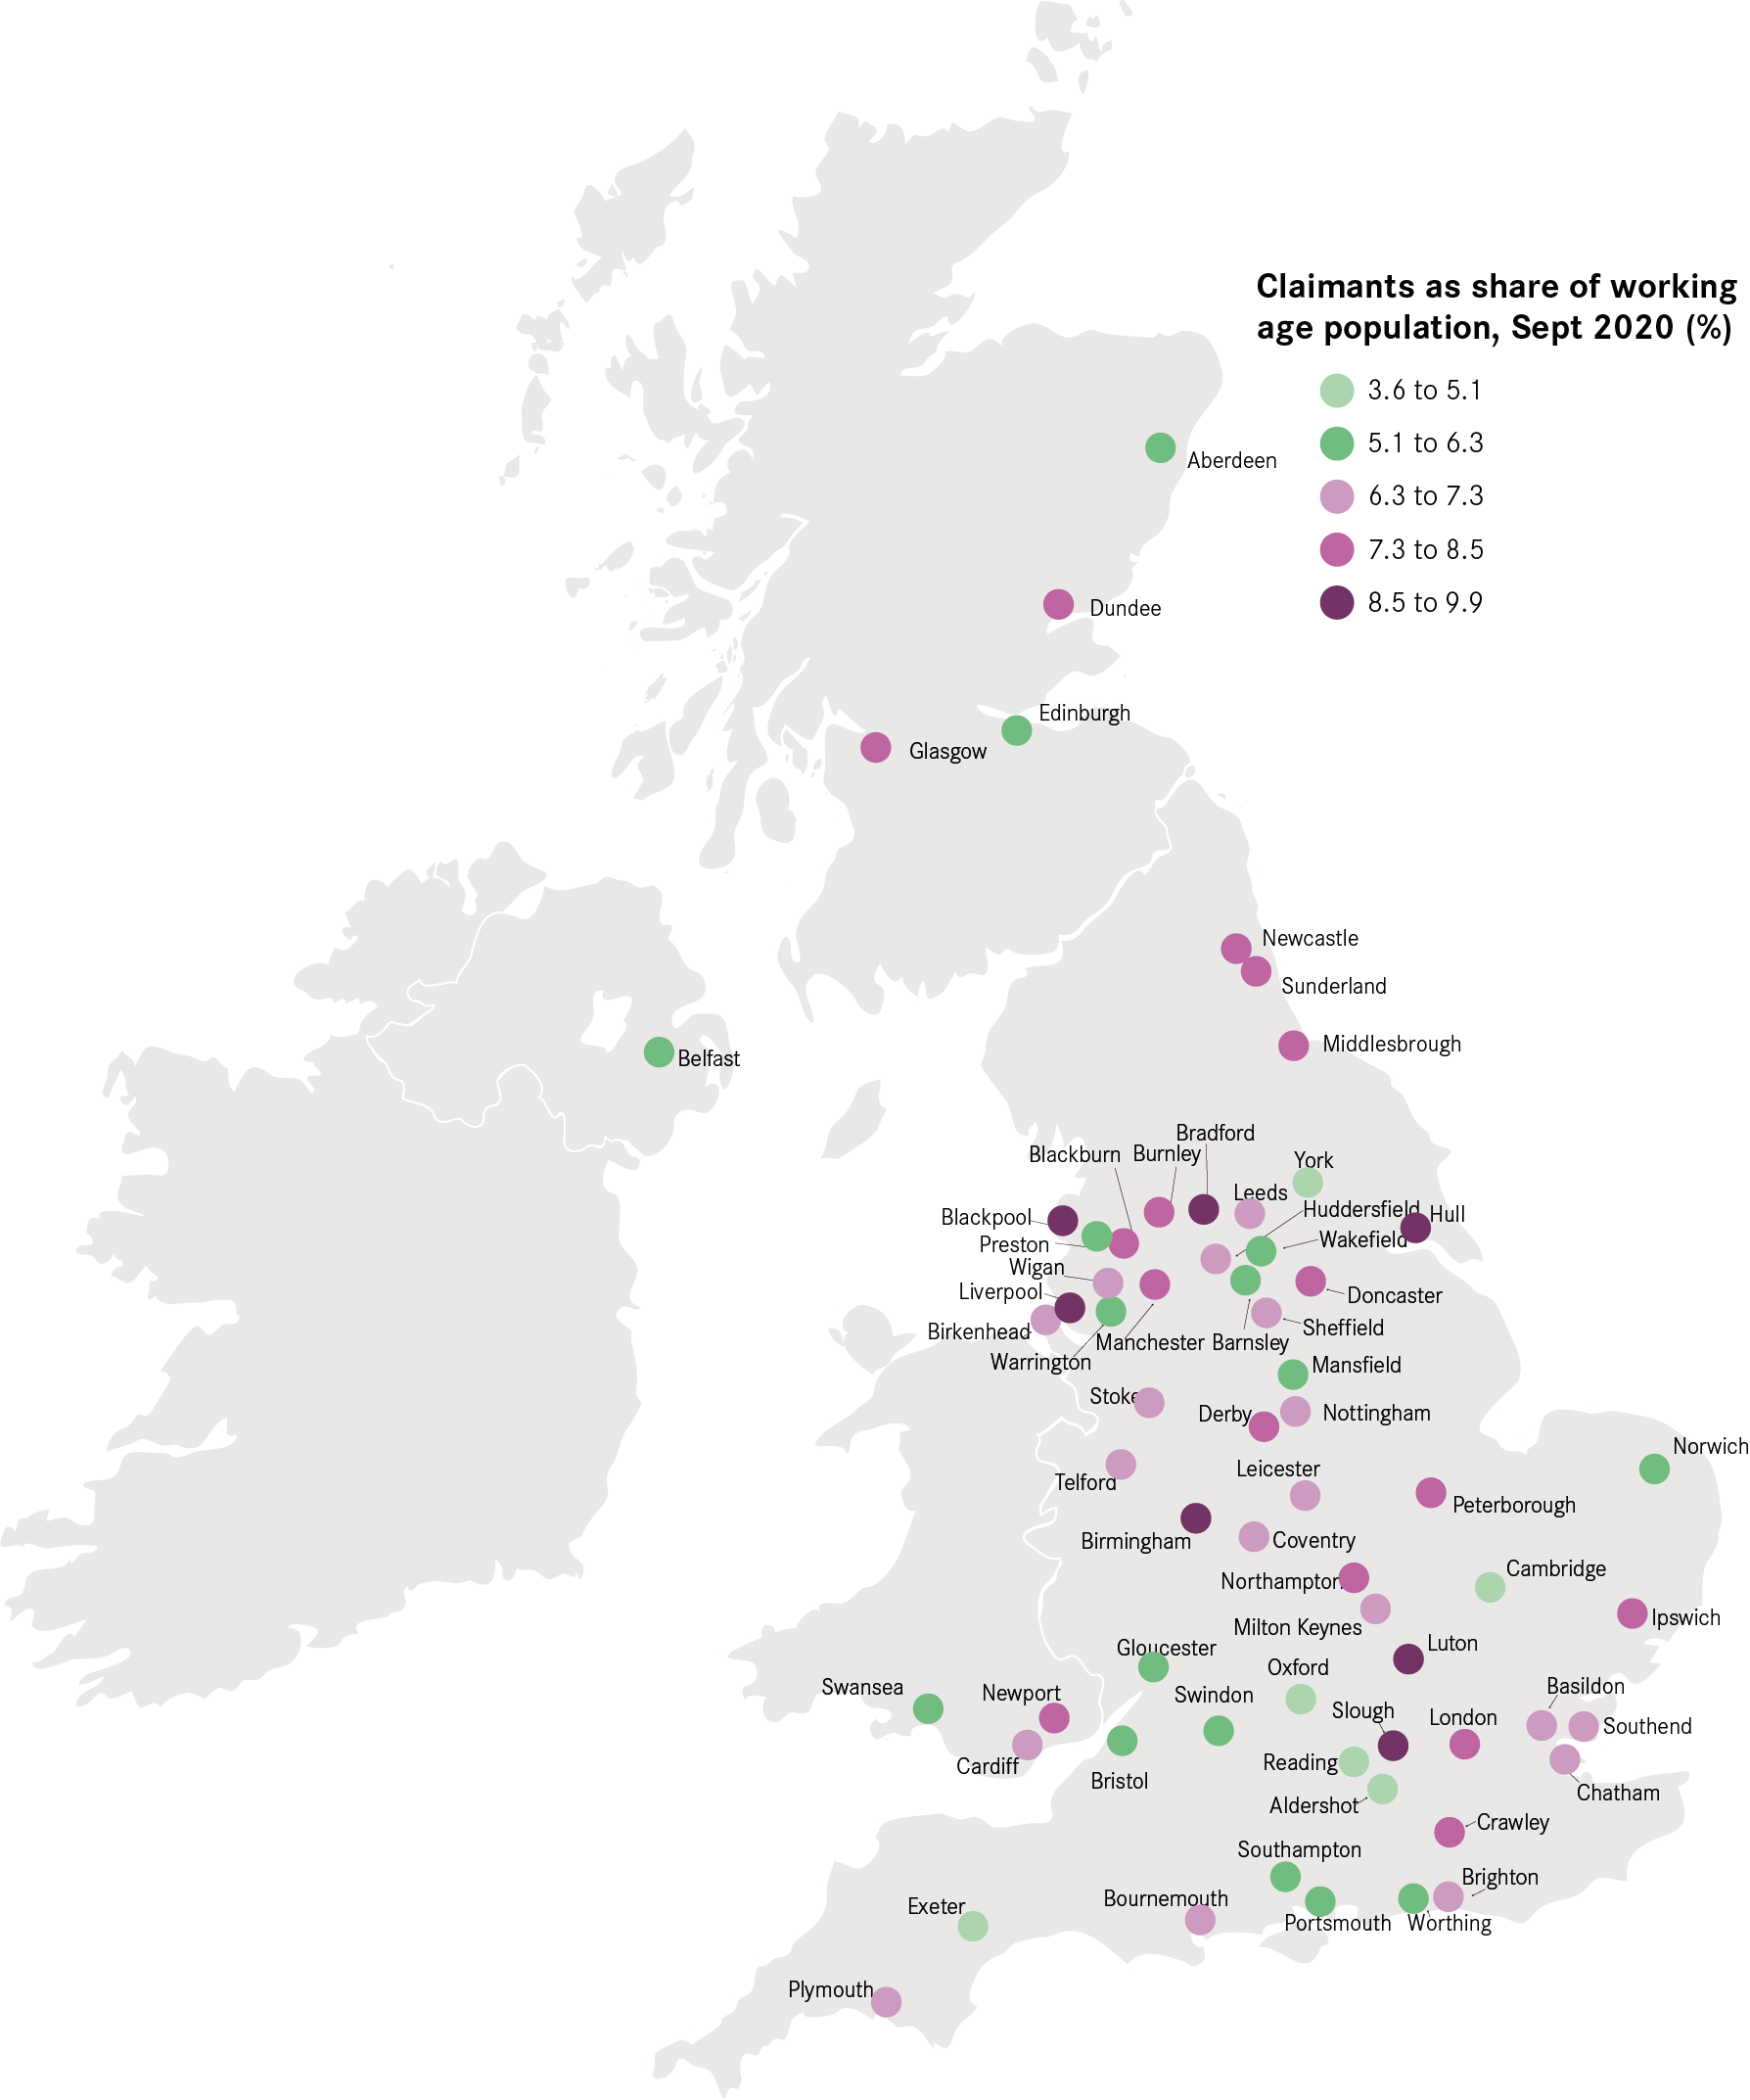
Alongside these places, the top 10 is populated by otherwise weaker economies. This month Birmingham has taken over Blackpool as the city with the highest claimant count in the country, and Hull is also in the top 3. In contrast, York, Exeter and Cambridge continue to have the lowest claimant count figures among the 63 largest cities and towns.
| City | Claimant count rate, Sept 2020 | City | Claimant count rate, Sept 2020 | ||
| 1 | Birmingham | 9.8 | 54 | Norwich | 5.6 |
| 2 | Hull | 9.7 | 55 | Preston | 5.4 |
| 3 | Blackpool | 9.5 | 56 | Warrington | 5.4 |
| 4 | Bradford | 9.5 | 57 | Edinburgh | 5.1 |
| 5 | Liverpool | 8.9 | 58 | Reading | 5.1 |
| 6 | Luton | 8.7 | 59 | Aldershot | 4.7 |
| 7 | Slough | 8.5 | 60 | Oxford | 4.6 |
| 8 | Sunderland | 8.3 | 61 | Cambridge | 4.3 |
| 9 | Middlesbrough | 8.3 | 62 | Exeter | 4.2 |
| 10 | Blackburn | 8.2 | 63 | York | 3.6 |
Source: ONS, Claimant Count September 2020. ONS, Population Estimates 2019
Source: ONS, Claimant Count September 2020. ONS, Population Estimates 2019
While also slowing down, the claimant count for people aged 16-24 years old is still rising faster than the overall claimant count. As a result, more than half a million young people are now claiming unemployment related benefits, and the claimant count rate for young people is now at 7.6 per cent.
Between cities, it is places with weaker economies that continue to have the highest levels of youth claimant counts. Bradford, Blackpool and Sunderland have the highest rates, but all the 10 places with a youth claimant count rate above 10 per cent are weaker economies. In contrast, the claimant count rate for Oxford and Cambridge is below 3 per cent.
| City | Young people claimant count rate, Sept 2020 | City | Young people claimant count rate, Sept 2020 | ||
| 1 | Bradford | 11.7 | 54 | Coventry | 5.7 |
| 2 | Blackpool | 11.3 | 55 | Cardiff | 5.6 |
| 3 | Sunderland | 11.2 | 56 | Reading | 5.5 |
| 4 | Middlesbrough | 10.7 | 57 | Bristol | 5.5 |
| 5 | Peterborough | 10.6 | 58 | Southampton | 5.5 |
| 6 | Newport | 10.5 | 59 | Edinburgh | 4.9 |
| 7 | Hull | 10.5 | 60 | York | 3.2 |
| 8 | Doncaster | 10.5 | 61 | Exeter | 3.1 |
| 9 | Birmingham | 10.4 | 62 | Cambridge | 2.7 |
| 10 | Burnley | 10.2 | 63 | Oxford | 2.6 |
Source: ONS, Claimant Count September 2020. ONS, Population Estimates 2019
That overall there has been little change in the claimant count despite the decreasing generosity in the Job Retention Scheme from August is good news for the economy. But the increase in Covid restrictions in recent weeks are likely to put further pressure on hospitality and leisure businesses in particular. The question now is whether the extension in support announced by the Chancellor last week will be enough to stop further jumps in people claiming unemployment related benefits in the coming months.
Explore the data in our tool comparing labour market statistics across cities and large towns in the UK.
Centre for Cities tracks the latest unemployment claim statistics across the UK's cities and largest towns.

See our research and analysis on the changing world of work in the UK and how this plays out differently in cities and large towns across the country.
Leave a comment
John Charlesworth
Thanks for these maps and tables. Levelling-up (whatever that means) will surely mean a change in direction of what these Towns and Cities are about. And how they do it. The Claimant Count (if one-month is relevant) looks similar to the recession of the 1980’s. The South (including high tech Thames Valley) look to be doing better than the rest (I lived there and enjoyed the benefits). What type of society has to emerge from this?