The Office for National Statistics has today released the latest data on unemployment claims. With the data covering the period up until the middle of May, we can now have a much clearer picture of the short-term effects Coronavirus has had on different local labour markets, with some interesting findings emerging.
How do unemployment claims compare to pre-lockdown?
Firstly, the number of people claiming Universal Credit or Job Seeker’s Allowance is continuing to rise.
There are now 2.8 million people claiming unemployment benefits across the country, up by 1.6 million from March. Albeit at a slower pace compared to the previous month, the claimant count rate increased by 1.3 percentage points between April and May, meaning that unemployment claims as a proportion of the UK working age population are now at 6.7 per cent, up from 3 per cent in March.
While it is important to note that the measures introduced by the Government in response to Coronavirus have meant that increasing numbers of people are now eligible for unemployment-related benefits even if still employed, this rise is unprecedented.
Where in the country is seeing the biggest rises in unemployment claims?
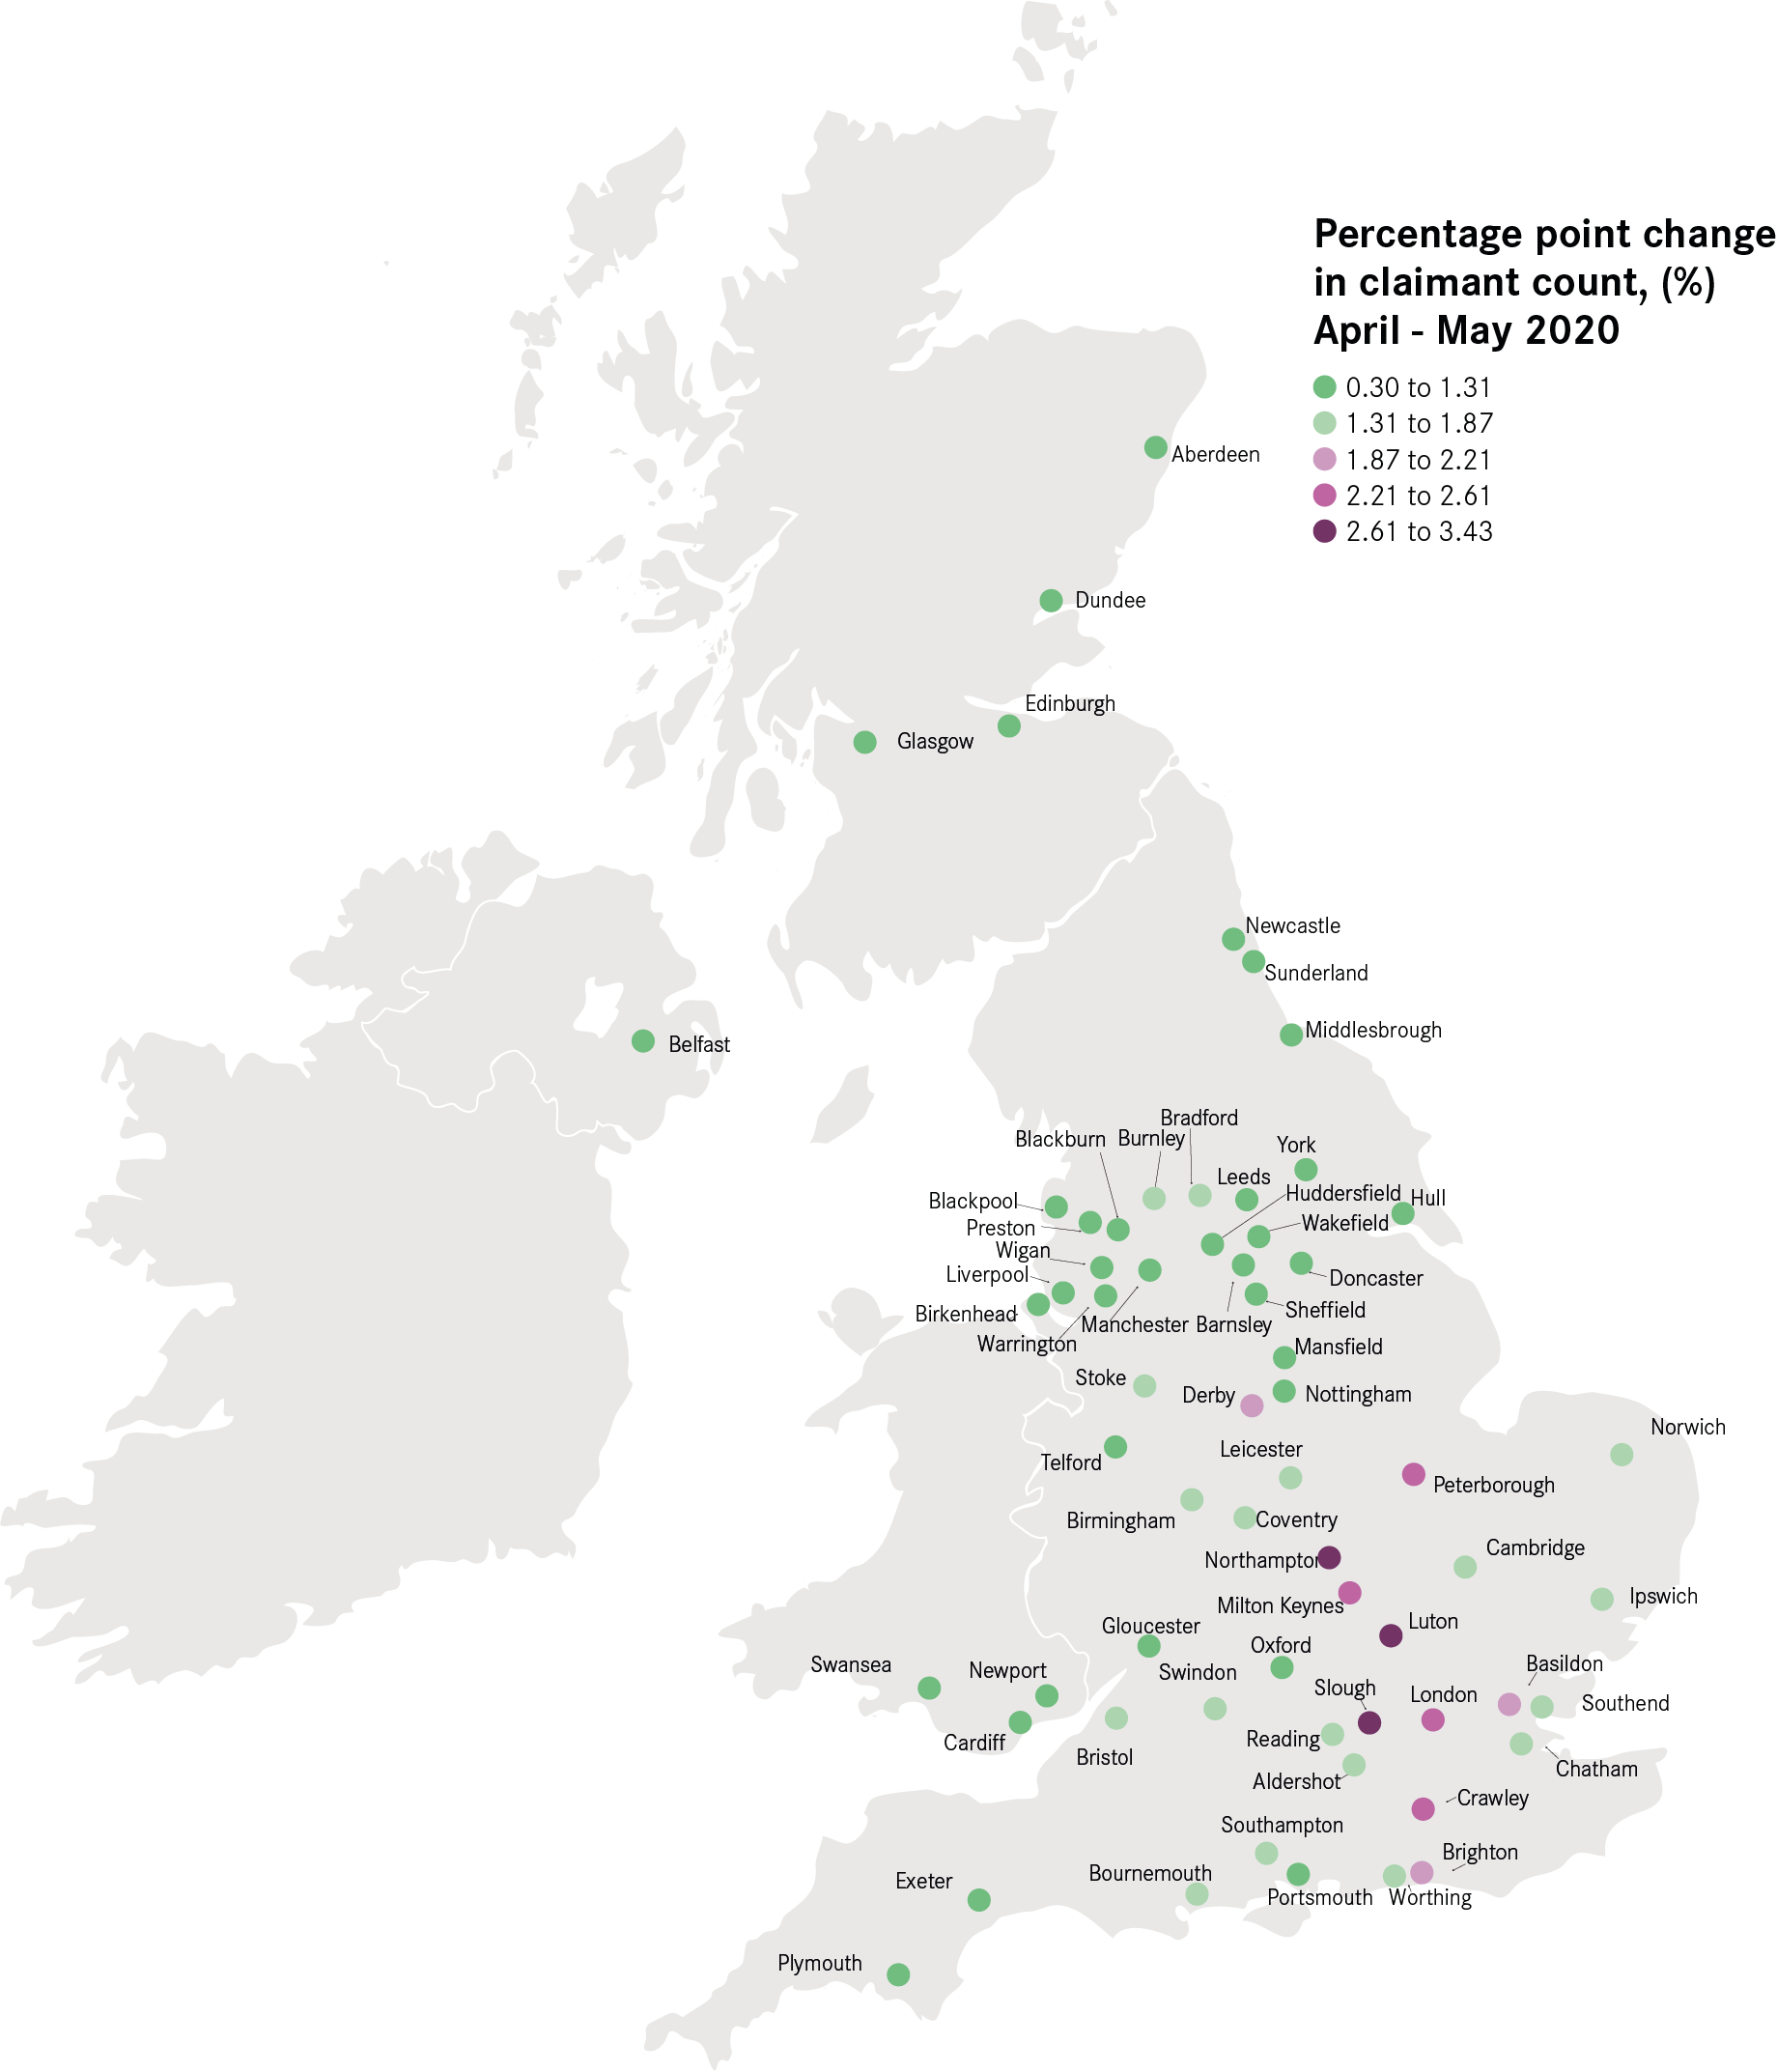
In the last month, cities and large towns with strong economies in the South of England have seen the biggest jumps in people claiming unemployment-related benefits. Luton, Northampton and Slough have seen a rise of approximately 3 percentage points, followed by London, Crawley and Milton Keynes.
With the exception of Derby (8th/63) and Bradford (19th/63), the 20 cities with the largest increases in claimant count in the last month are all in the Greater South East of England.
| Rank |
City |
Claimant Count percentage point change Apr-May 2020 |
Rank |
City |
Claimant Count percentage point change Apr-May 2020 |
| 1 |
Luton |
3.1 |
54 |
Birkenhead |
0.8 |
| 2 |
Northampton |
2.8 |
55 |
Middlesbrough |
0.8 |
| 3 |
Slough |
2.8 |
56 |
Sunderland |
0.8 |
| 4 |
London |
2.5 |
57 |
Aberdeen |
0.7 |
| 5 |
Crawley |
2.4 |
58 |
Exeter |
0.7 |
| 6 |
Milton Keynes |
2.3 |
59 |
Dundee |
0.6 |
| 7 |
Peterborough |
2.3 |
60 |
Newcastle |
0.6 |
| 8 |
Derby |
2 |
61 |
Swansea |
0.6 |
| 9 |
Basildon |
1.9 |
62 |
York |
0.5 |
| 10 |
Brighton |
1.9 |
63 |
Belfast |
0.3 |
Source: ONS, Claimant Count May and April 2020. ONS, Population Estimates 2019.
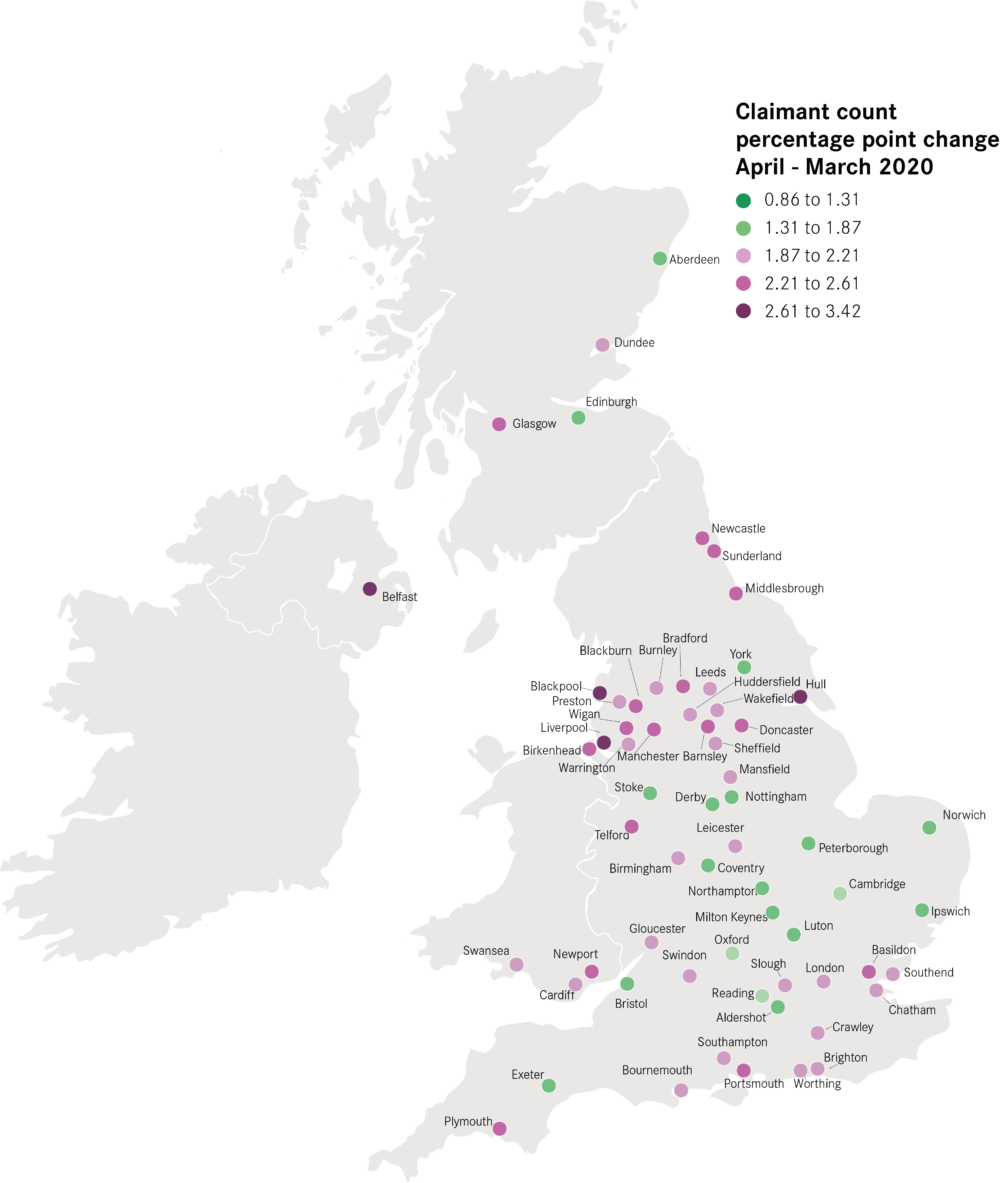
This is a completely different picture compared to last month, when the biggest increases in unemployment claims occurred in cities and large towns with weaker economies in the North and Midlands (see map on the left below). Blackpool, Liverpool and Hull experienced the largest increases between March and April, but are only middle of the rank in terms of percentage point change in the last month.
This suggests that the economic impact of Coronavirus has affected different places at different pace: cities and large towns in the North and Midlands were hardest hit at first, whereas places in the South of England were able to shield themselves to begin with but are now catching up.
Source: ONS, Claimant Count May, April and March 2020. ONS, Population Estimates 2019.
Where are most people claiming unemployment benefits?
Cities and large towns in the North and Midlands continue to have the highest claimant count rates, but some places in the South of England have made big jumps in the ranking.
As of May 2020, over ten per cent of the working age population in Blackpool are claiming unemployment benefits, followed by Hull (9.8 per cent) and Birmingham (9.4). With the exception of Luton, the top 10 cities for claimant count rate continue to be in the North and Midlands.
At the same time, southern cities and large towns with typically low proportions of people claiming unemployment benefits are moving up the ranking. Slough used to be the 38th city for claimant count rate in March – it is the 12th highest in the country now. Similarly, Crawley moved from 44th to 20th and London from 39th to 17th.
All workers:
| Rank |
City |
May Claimant Count (%) |
Rank |
City |
May Claimant Count (%) |
| 1 |
Blackpool |
10.1 |
54 |
Bristol |
5.6 |
| 2 |
Hull |
9.8 |
55 |
Warrington |
5.4 |
| 3 |
Birmingham |
9.4 |
56 |
Aberdeen |
5 |
| 4 |
Bradford |
9.1 |
57 |
Edinburgh |
4.9 |
| 5 |
Liverpool |
8.8 |
58 |
Reading |
4.9 |
| 6 |
Sunderland |
8.3 |
59 |
Aldershot |
4.5 |
| 7 |
Blackburn |
8.3 |
60 |
Oxford |
4.3 |
| 8 |
Luton |
8.3 |
61 |
Exeter |
4.2 |
| 9 |
Middlesbrough |
8.2 |
62 |
Cambridge |
4 |
| 10 |
Burnley |
8 |
63 |
York |
3.7 |
Source: ONS, Claimant Count May 2020. ONS, Population Estimates 2019.

Source: ONS, Claimant Count May 2020. ONS, Population Estimates 2019.
Where is seeing the highest share of young people claiming unemployment benefits?
A similar picture emerges when looking at young people – with young people in cities and large towns in weaker economies in the North and Midlands more likely to be claiming unemployment benefits. In Blackpool, Doncaster and Sunderland approximately 11 per cent of young people are claiming unemployment benefits and that is almost five time larger than in Exeter, Oxford and Cambridge where fewer than three percent of young people are claiming benefits.
Young people:
| Rank |
City |
May Claimant Count (%) |
Rank |
City |
May Claimant Count (%) |
| 1 |
Blackpool |
11.9 |
54 |
Southampton |
5.2 |
| 2 |
Doncaster |
11 |
55 |
Coventry |
5.1 |
| 3 |
Sunderland |
10.9 |
56 |
Bristol |
5 |
| 4 |
Bradford |
10.8 |
57 |
Cardiff |
5 |
| 5 |
Hull |
10.4 |
58 |
Reading |
4.7 |
| 6 |
Burnley |
10.3 |
59 |
Edinburgh |
4.3 |
| 7 |
Peterborough |
10.3 |
60 |
York |
3 |
| 8 |
Middlesbrough |
10.2 |
61 |
Exeter |
2.9 |
| 9 |
Blackburn |
9.9 |
62 |
Oxford |
2.2 |
| 10 |
Barnsley |
9.9 |
63 |
Cambridge |
2.2 |
Source: ONS, Claimant Count May 2020. ONS, Population Estimates 2019.
How does variation in claimant count relate to other forms of Government support?
There is a clear positive relationship between the take up of the Coronavirus Job Retention Scheme and the percentage point increase in claimant counts since March 2020. Places like Crawley, Luton and Blackpool have both seen large take-up of the Job Retention Scheme and large increases in unemployment claims. In contrast, Exeter, Cambridge and York appear to have a lower take up of both types of support.
This suggests that the Government’s Job Retention Scheme is being successful in doing what it was designed from: protecting jobs during the crisis. The Job Retention Scheme has limited even more extreme increases in places hit hardest and this appears to hold across different labour markets, unlike initially suspected.

Source: ONS, Claimant Count May and March 2020 data. ONS, Population Estimates 2019. HMRC data on Job Retention Scheme by local authority up to May 2020.
What does this mean for policy?
There are two main take aways for the Government from this latest release.
Firstly, unemployment is continuing to rise fast, and the clear relationship with the take-up of the Job Retention Scheme suggests unemployment could rise even more without a careful phase out of support. Clear policies designed to helping people back to work are now crucial.
Secondly, it is now more than ever clear that different labour markets are reacting in different ways. Not only the economic shock created by Coronavirus has hit some places more than others because of their industrial make-up, but within these places most affected, some have been hit more quickly than others, suggesting the recovery will also occur at a different pace across the country, requiring locally tailored solutions.

Leave a comment
Be the first to add a comment.