
Have UK cities been hotbeds of the Covid-19 pandemic?
Valentine Quinio on how density plays a smaller role in the spread of Coronavirus than socioeconomic factors.
Valentine Quinio on how density plays a smaller role in the spread of Coronavirus than socioeconomic factors.
Dense metropolitan regions have been hit hard by the Covid-19 pandemic: Wuhan, Milan, Paris, New York and London rapidly turned into hotspots for contamination, and density has often been cited as the reason for this.
In theory, a greater concentration of people living together should increase the spread of a virus. But does the data show this to be true?
Looking at cities versus rural areas[1] in England, the spread of the virus (measured by confirmed cases) has definitely been quicker in cities (Figure 1). The nature of cities means that social interaction is higher, and they have always been more vulnerable to contagious viruses such as Covid-19.
That said, this isn’t universal, and rural areas are not immune: on a per head basis, areas such as Cumbria and Northumberland count more cases than the London Borough of Islington or the City of Manchester.
[1] The ONS urban/rural classification (2011) at the local authority level was used here.
Figure 1: Growth in the number COVID-19 cases, urban and rural areas
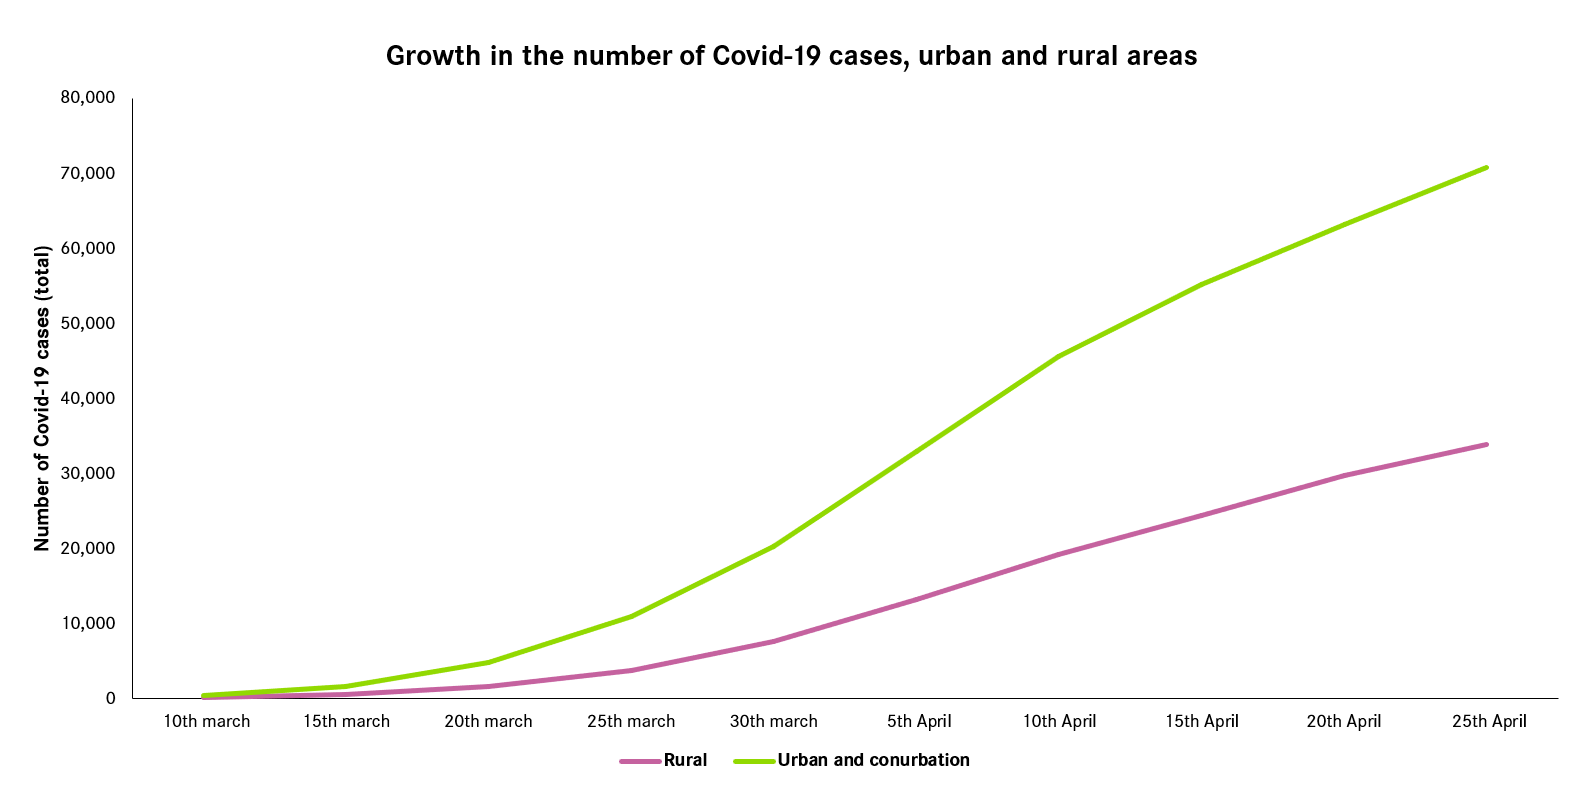
Source: Public Health England, 2020.
Looking at cases up until lockdown – which should reduce the importance of density – shows no clear relationship between density and the spread of the virus. The graphs below show that, when looking at cases at the urban local authority (LA) level,[2] the link – quite strong at first sight (figure 2) – is rather weak when London boroughs are removed (Figure 3).
[2] Urban LAs are located within the boundaries of a city or large town.
Figure 2: Cases and density: all urban local authorities

Source: Public Health England, 2020; ONS, 2020. Note: these are confirmed cases from the 23rd of March 2020.
Figure 3: Cases and density: all urban local authorities (London excluded)

Source: Public Health England, 2020; ONS, 2020. Note: these are confirmed cases from the 23rd of March 2020.
This suggests that density is not as important a factor as is often assumed. This was confirmed by further analysis that showed that even when density was in play, it was not significant once the model accounts for London’s unique character.
In London, density could have played a role but it can also be explained by other factors, for example its position as an international hub, with large flows of visitors, or a high proportion of its population using public transport.
This is supported by data on the spread of the virus in other cities. On 23 March dense places like Hull, Plymouth, Derby or Coventry, which all have similar levels of population density to London’s had a much lower proportion of their population tested positive. Meanwhile Sheffield ranked second behind London on the number of cases per head, despite having much smaller density than the capital.
Evidence from other countries also cast doubt on the role of density. Extremely dense urban areas such as Hong Kong, Seoul or Singapore rapidly flattened the curve. Meanwhile, in the US, the second densest city, San Francisco, is far less affected than New York City.
If density did not play a key role, looking at what has happened a month after the lockdown sheds light on the contribution of other factors.
The introduction of the lockdown raised the importance of socioeconomic divides. Across all local authorities in England cases are much higher deprived areas compared to a month ago. This is shown in the chart below.
Figure 4: Average number of cases per 100,000 population and income deprivation

Source: Public Health England, 2020; MHCLG, 2019.
These findings suggest that exposure has not weakened sufficiently for a number of deprived households, regardless of density levels, and despite the lockdown.
This partly illustrates the vulnerability of low-income workers who are less likely to work from home and more likely to be frontline key workers.
This of course remains preliminary analysis, and more work will be needed when we have a fuller picture. But while density brings downsides as well as positives, its role in the spreading of Covid-19 in the UK is not clear cut.

Leave a comment
Olivier Bouba Olga
Thanks for your very interesting post ! I obtained the same results for France (see here (in french) : http://blogs.univ-poitiers.fr/o-bouba-olga/2020/04/29/la-densite-favorise-t-elle-lepidemie-episode-26/)
The correlation (R²) between density and death per inhabitants is 0.22 with Paris region, and R²=0.04 without.
Valentine Quinio
Thanks Olivier, that’s really interesting (glad to be a French speaker to be able to read that!). The fact that the analysis is also valid when looking at fatalities is also very insightful- and I’m not surprised comments on the demise of the city were made on both sides of the Channel! We’ll continue looking at that possibly at a micro-level, to see whether a pattern emerges.