
December Labour Market Update
The latest city-by-city labour market data.
The latest city-by-city labour market data.
Today’s labour market figures show a continued fall in UK unemployment, which now stands at 6.0 per cent; the lowest rate seen for six years.
While this fall in unemployment has been seen across all age groups (with older aged workers seeing the largest fall nationally) large variations in unemployment between age groups remain.
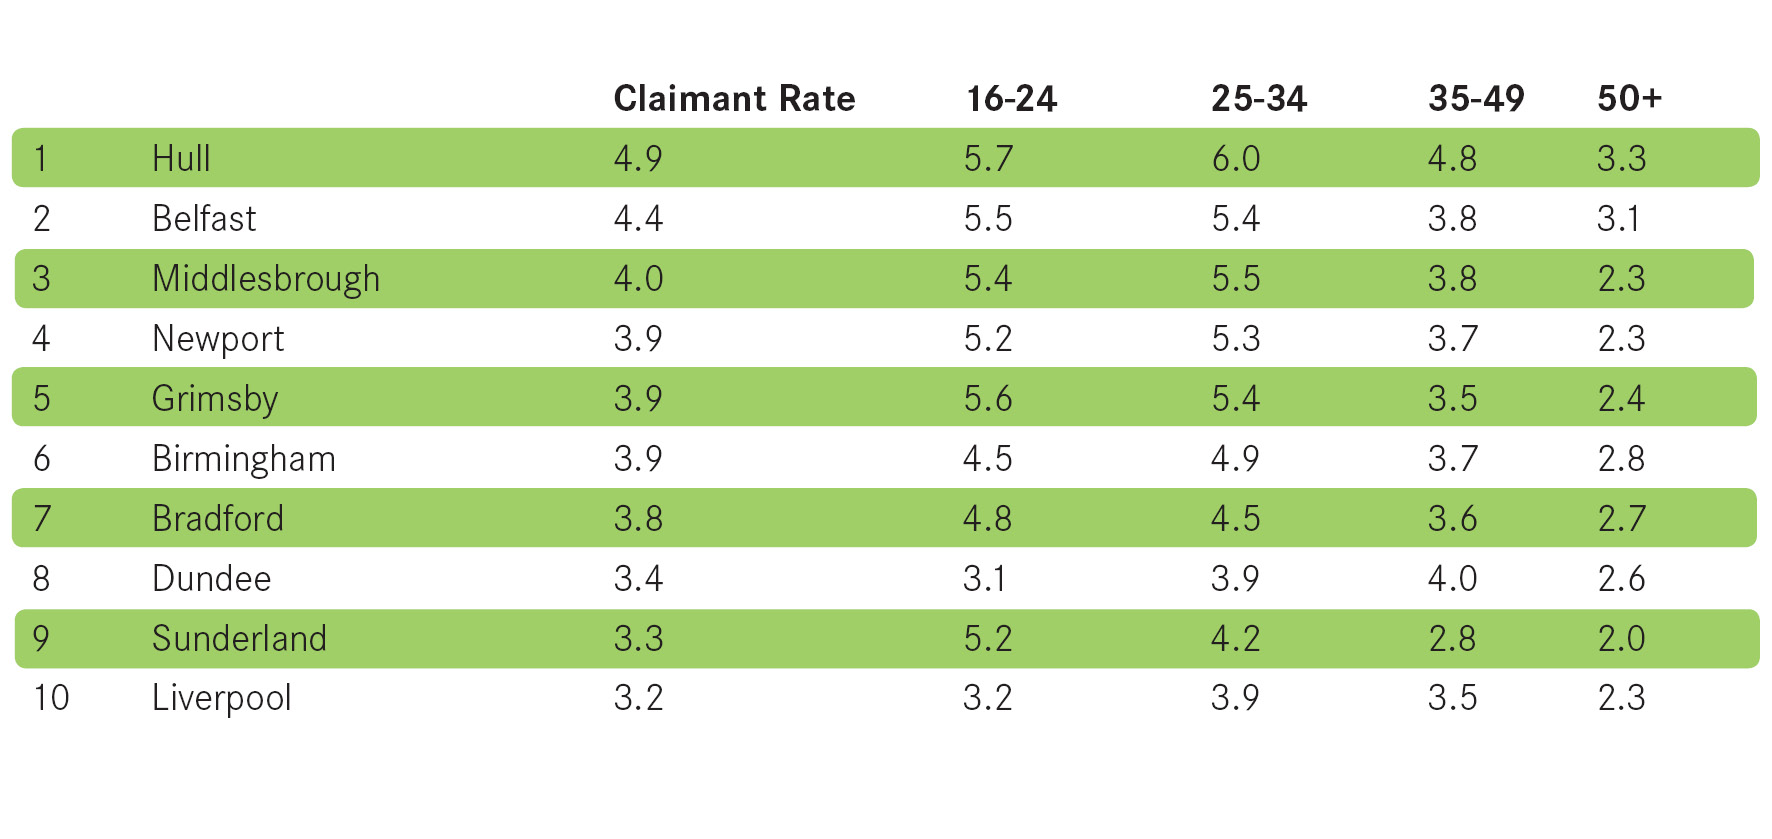
Table 1 shows how claimant unemployment varies by broad age group within the 10 cities home to the highest unemployment rate. It highlights that for a number of these cities, the differences between age groups can be large. For example in Hull, the city with the highest claimant rate of 4.9 per cent, 6.0 per cent of those aged 25-34 are unemployed, which is nearly double the rate of those aged 50 plus (at 3.3 per cent).
The largest variation is seen in Sunderland, which despite having a relatively large youth unemployment issue (at a rate of 5.2 per cent), has much lower unemployment rates for those aged 35 and over. In fact, only 2.0 per cent of those aged 50 or over in Sunderland are unemployed.
But as table 1 shows, it is not always youth unemployment driving up the city average. In Dundee, the claimant rate is greatest for those aged 35-49, and in other cities such as Cambridge and Reading, the claimant rate is actually lowest for the 16-24 age group. And across all of the UKs 64 largest cities it is generally those aged 25-34 that have the highest claimant unemployment rates. Those aged 50 plus typically have the lowest.
This suggests that while those aged 16-24 can face difficulties in finding and remaining in work, in many cities, the major unemployment challenges are not faced by young people, but by people over the age of 25. This highlights the need to ensure national policies to tackle persistent unemployment are tailored to the specific needs of individual cities.
The latest city-by-city labour market data is below:

Leave a comment
Be the first to add a comment.