03How cities differ
The first Urban Demographics report showed that there were common patterns in the demographics of city centres, suburbs and hinterlands, but also a great deal of variation between cities. Yet this variation was primarily between city centres, rather than in suburbs or hinterlands. The same trend emerges from the polling responses in the four case study cities, where there was very little difference between the responses given by residents of suburbs and hinterlands and a great deal of variation between city centre residents’ responses (see Figure 7).
City centres have been the fastest growing parts of cities
There has been a considerable shift in attitudes towards city centre living in recent years, which has had a major impact on the demographic profile, and the role, of city centres.
Box 3: Urban regeneration policies
Post-industrial decline during the twentieth century resulted in the blight of inner cities across the UK, and shifting cultural preferences towards suburban, low-density living and open space led to a flight from the inner city.9 The need to manage this de-urbanisation saw a series of different approaches emerge from the 1980s, including the encouragement of business growth through Enterprise Zones, cultural-led regeneration strategies such as the European Capital of Culture Programme (which commenced in 1985), and retail-led strategies such as town centre management, which existed from the early 1990s. The regeneration agenda became a policy focus during the 1990s through the Labour Administration, and the Urban Task Force’s 1999 Towards an Urban Renaissance set out a programme to regenerate city centres through sustainable, high-density residential development on brownfield land. While there has been an increase in city centre apartment building, particularly in large cities, the extent to which this is seen as a result of policy is mixed, and is likely to have had as much to do with changing economic geography and demographic and social change.10
As Figure 5 shows, from 1971 there was a hollowing out of inner cities as residents moved out – into suburbs, in particular.11 But this has strongly reversed since 1991; city centres grew by 74 per cent between 1991 and 2011. And not only has there been a return to city centre living, but this growth has far outstripped population growth in other parts of cities. Between 2001 and 2011, the populations of city centres grew on average by 37 per cent, compared to just 8 per cent in suburbs, and 6 per cent in hinterlands.12
Figure 5: City centre populations of cities in England and Wales, 1971-2011

This trend has been most pronounced in large cities – which saw both a fast decline in their city centre populations after 1971, and a faster increase – particularly since 2001. Between 2001 and 2011, the populations of these cities have more than doubled (108 per cent), while the city centres of medium and small cities have grown much more slowly – by 35 per cent in medium cities, and 22 per cent in small cities. This has been matched by a boom in apartment building in large cities, where 26,000 new flats were sold between 2001 and 2011, compared to just 22,000 existing flats – while more new flats were sold in the city centre of Manchester over that time than in the whole of central London.13
Large cities have not only grown faster – they have attracted different types of people, too. In the centres of large cities, more than half of the overall growth was a result of an increase in student numbers, and over a third was driven by graduates under the age of 35.14 In medium and small cities, on the other hand, the growth has tended to be driven by a more even spread of age groups and qualification levels (see Figure 6).
Figure 6: Net change in population by age group and highest level of qualification, 2001-2011
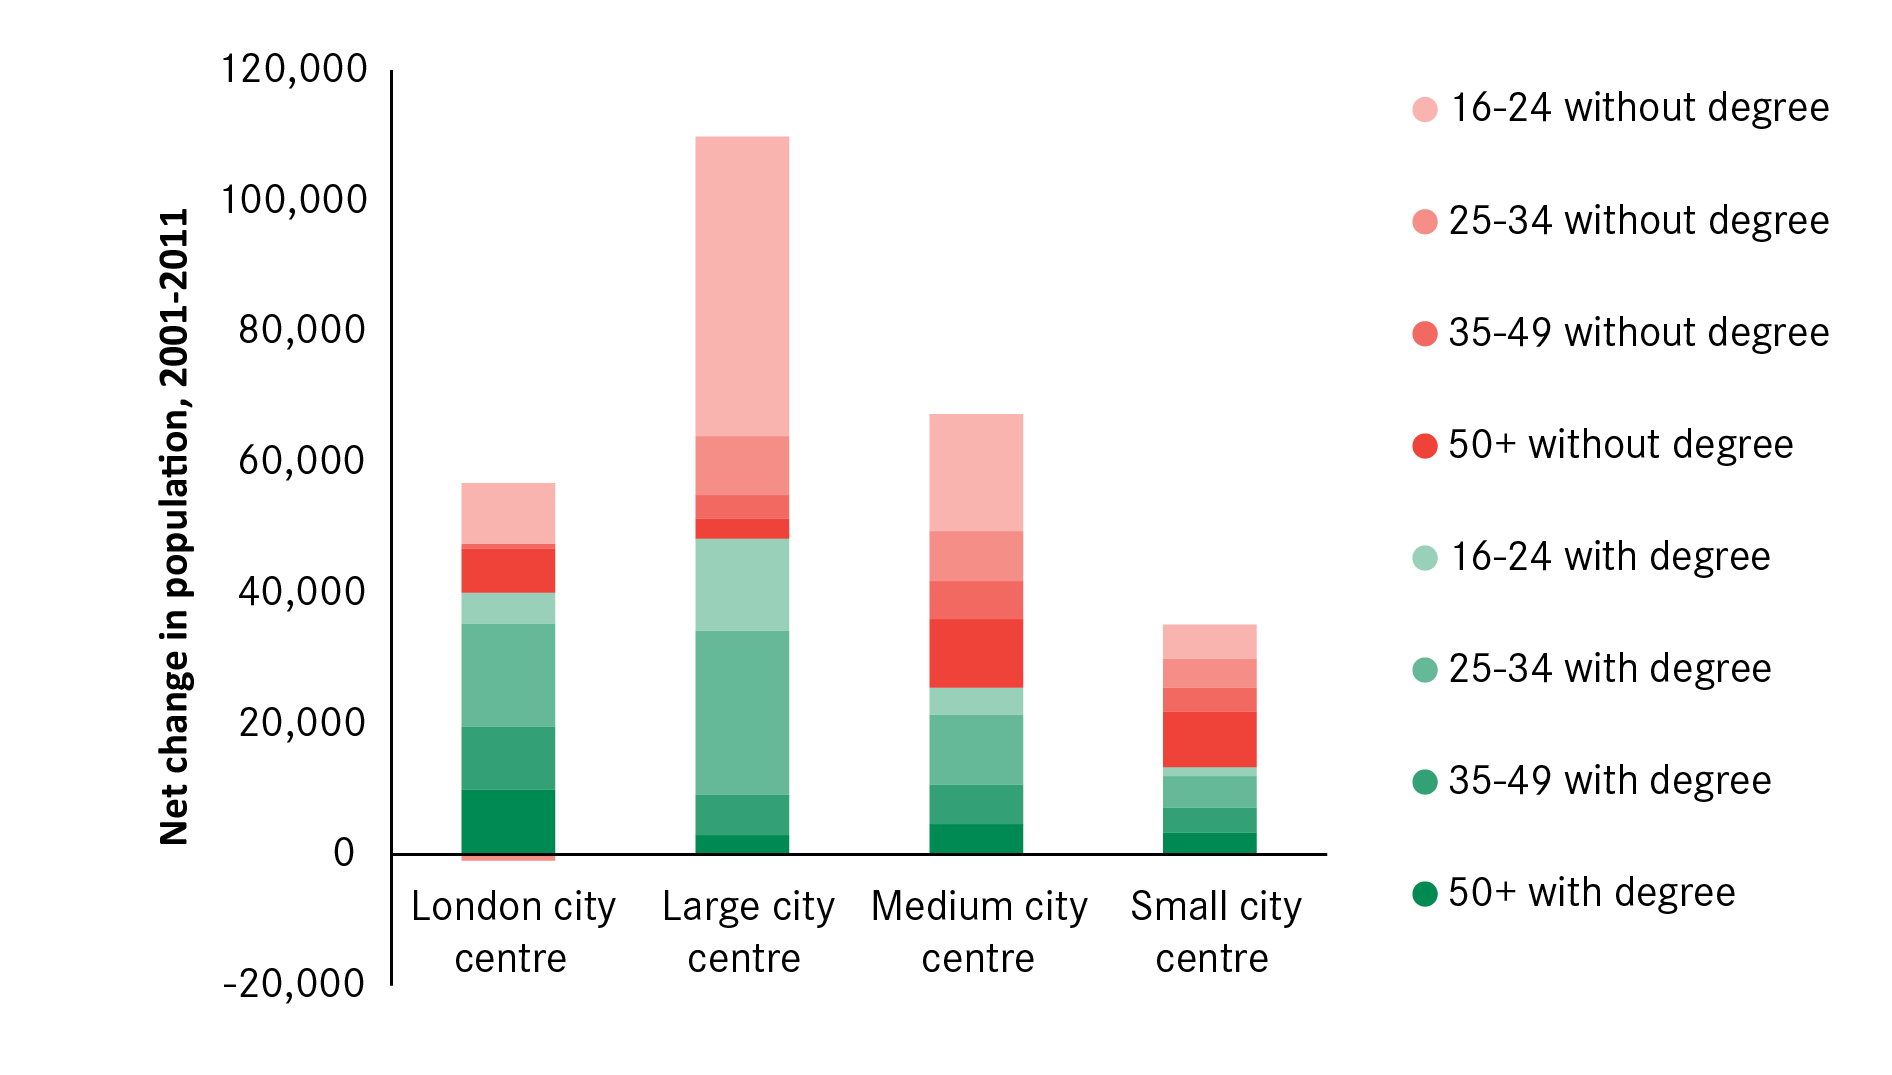
This meant that in 2011, more than a third of city centre residents in large cities had a degree, and the majority were aged between 25 and 34. They also tended to work in higher-skilled occupations and were more likely to work within the city centre. In small and medium-sized cities, residents were more likely to have families, to work in lower-skilled occupations, and to commute out of the city centre into jobs in the suburbs. London, meanwhile, had the largest proportion of highly skilled residents (48 per cent had a degree), but its demographic overall was slightly older, likely driven by prohibitively high central London housing costs.
These trends are no accident – the demographics of these city centres, and the variation in responses that residents surveyed gave, differ because the city centres of large cities have been able to offer something quite different to city centres elsewhere, as shown in Figure 7.
Figure 7: Reasons for choosing to live in different cities: city polling
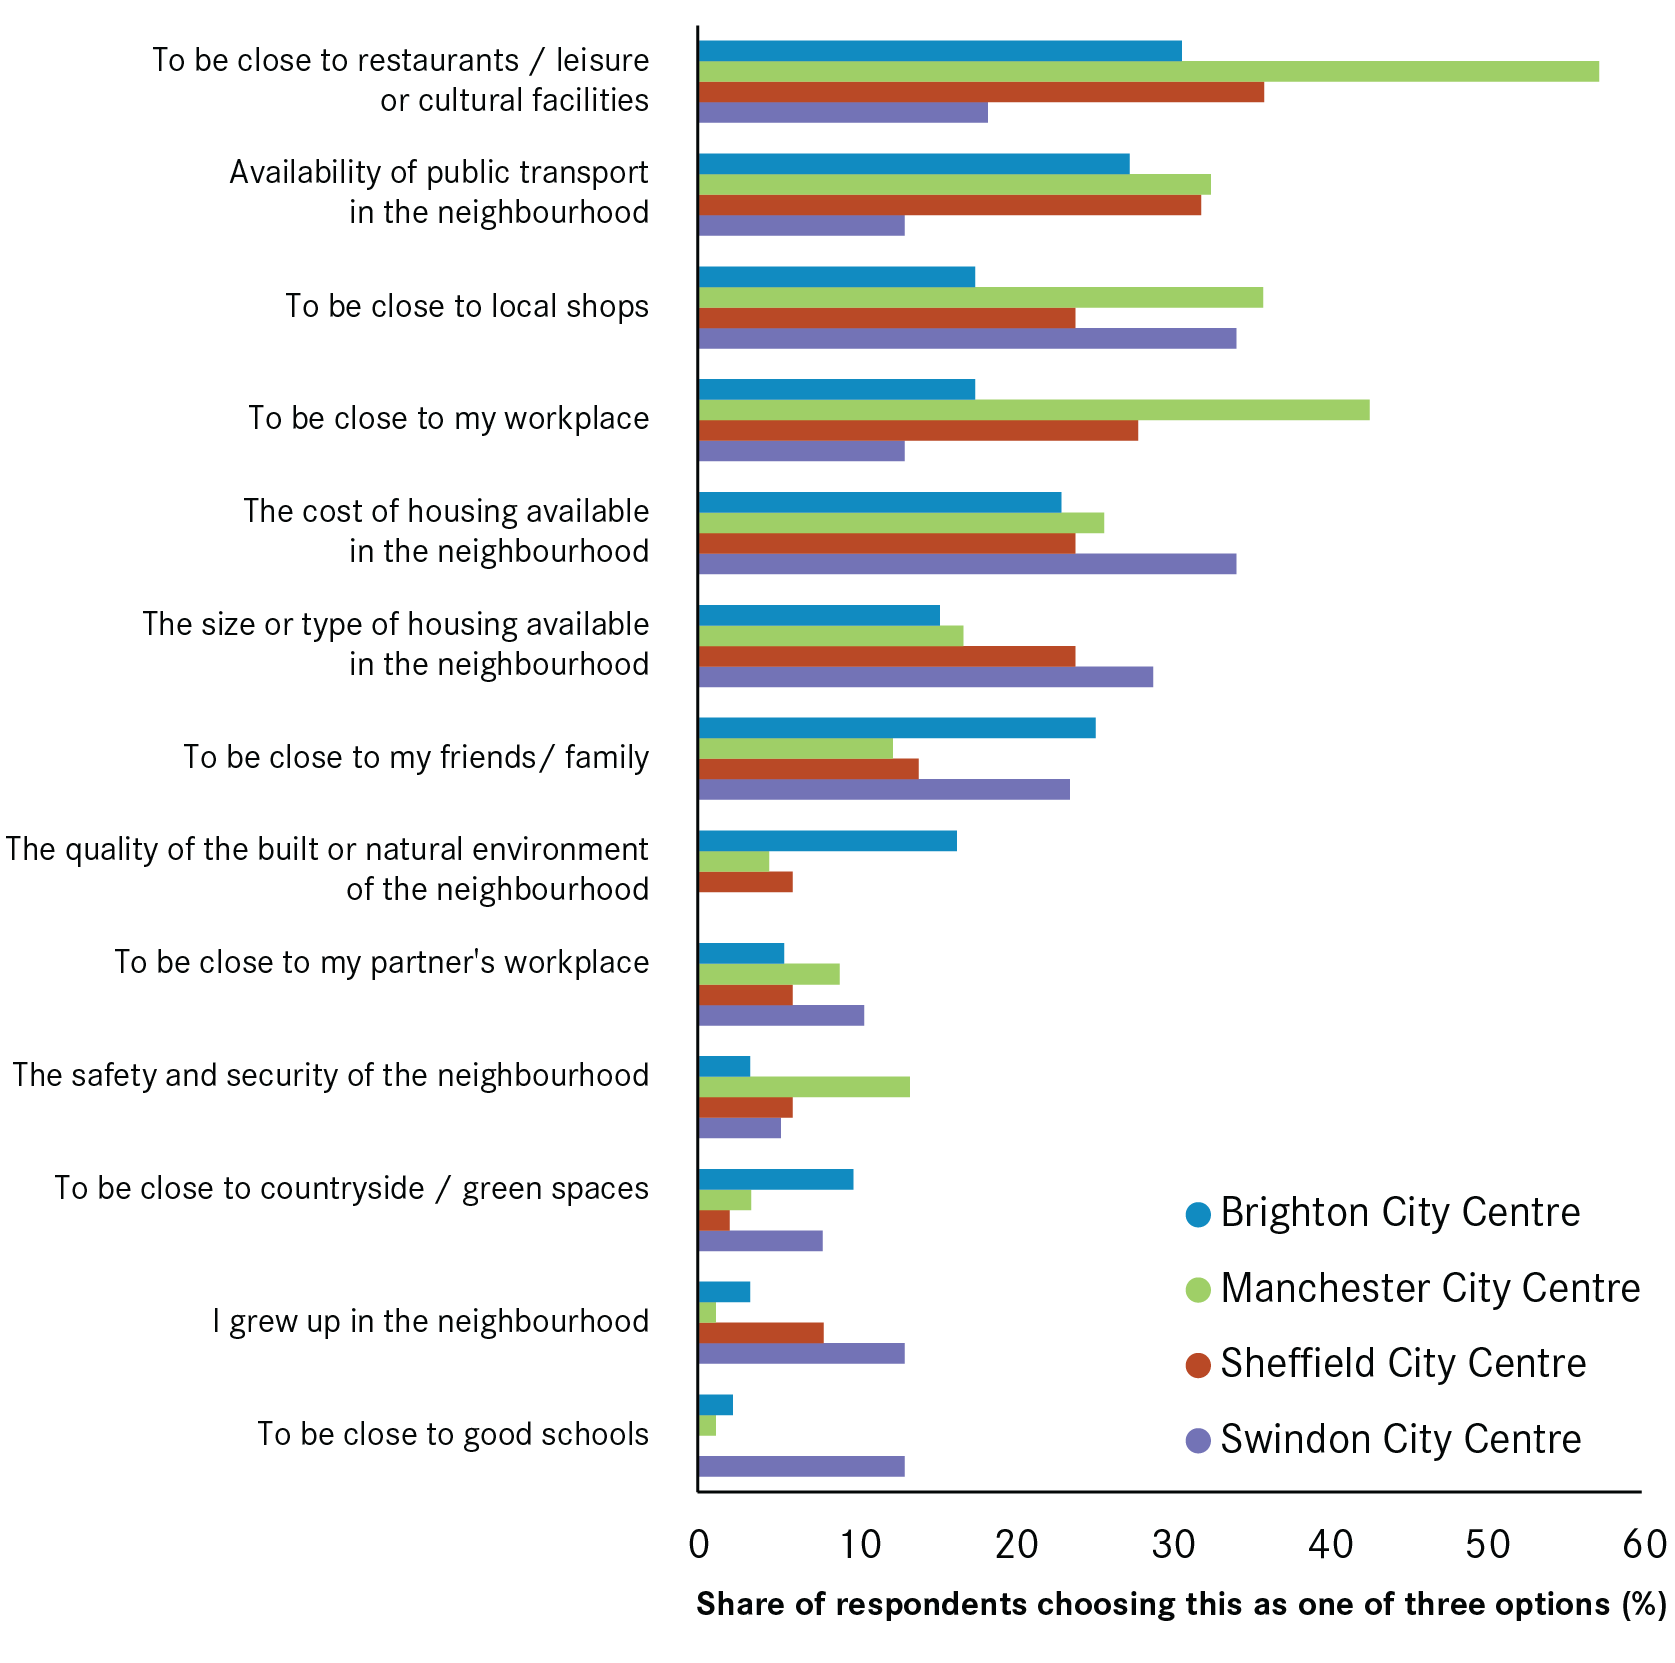


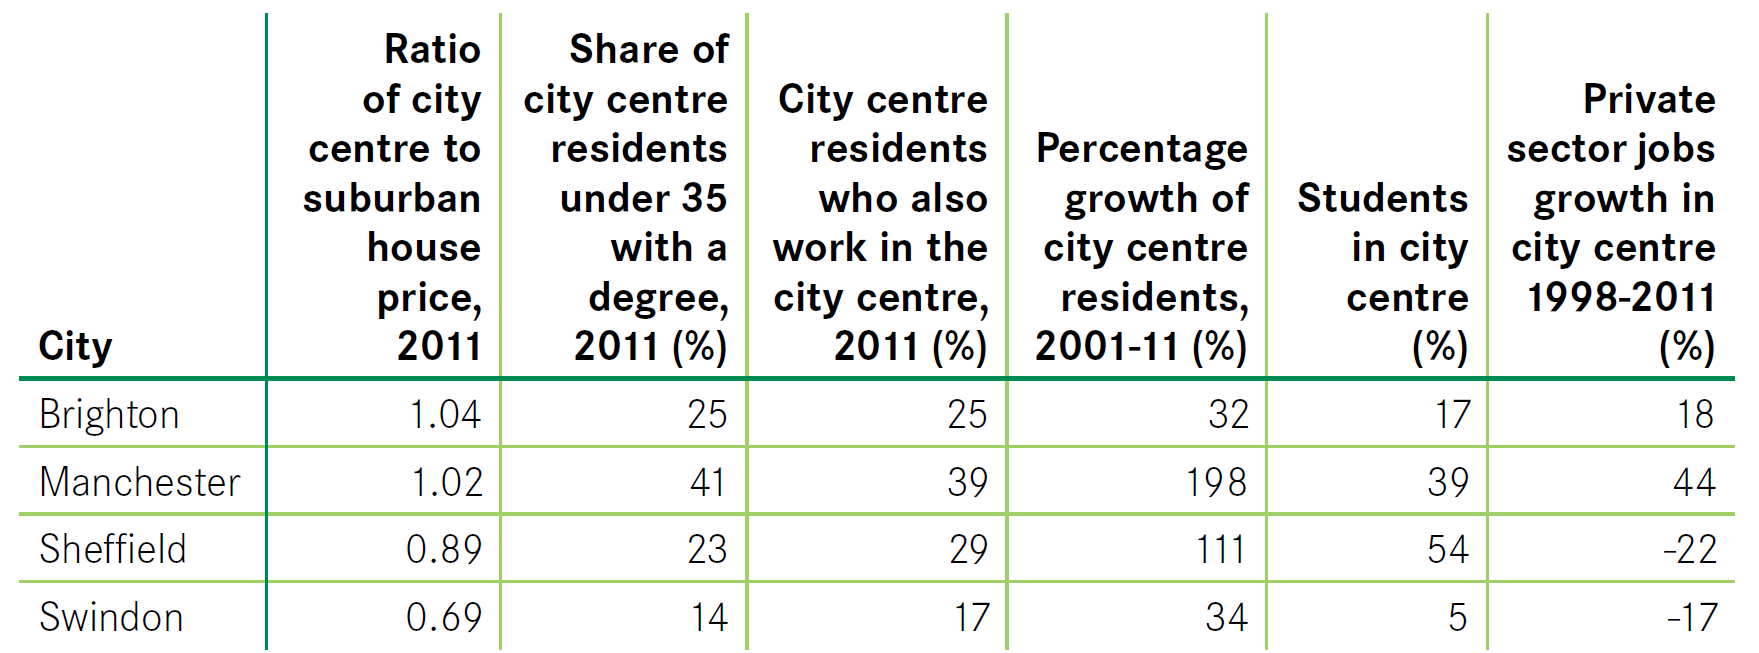
The following four case studies look at Manchester and Sheffield (both fast growing large cities) and Swindon and Brighton (both slower growing small and medium sized cities with very different demographics) and offer wider lessons as to why there has been such variation in the return to city centre living. Figure 8 shows the key data for each case study.
Figure 8: Key data on the four case study cities
Manchester
Figure 9: The geography of jobs across Manchester

Manchester’s city centre population almost tripled between 2001 and 2011. The change in the number of students was equivalent to a third of this growth, attracted by Manchester’s two universities and its vibrant city centre offer, but the change in the number of employed residents was equivalent to more than half of its growth. The 2011 Census showed that 39 per cent of city centre residents were students, but 49 per cent were employed, while the overall demographic was very young and highly qualified: 41 per cent of all residents were under 35 with a degree – the highest among all city centres.
The city’s pull seems to relate to its offer of restaurants, leisure and cultural facilities, which was the most selected reason why surveyed residents chose to live there, and proximity to workplace, which was the second most popular reason. With 39 per cent of city centre residents also working in the city centre, the latter seems to be an important pull for young professionals,15 who, on the basis of those residents surveyed, were also prepared to withstand the higher cost of housing (which is more expensive than in the surrounding suburbs), higher pollution, and a lack of green space, in order to access the benefits that the city centre offers.
Part of Manchester’s growth has been driven by its two universities. But the strong growth in the number of young professionals over 10 years is more a result of the very strong jobs growth that the city centre has seen, particularly in knowledge-intensive business services – a sector which is not only more likely to locate in the city centre than elsewhere,16 but which also tends to employ large numbers of young professionals in well-paid jobs.17 These factors are likely to explain why other cities such as Birmingham and Reading have also seen strong growth driven by young professionals in recent years.
Sheffield
Figure 10: The geography of jobs across Sheffield
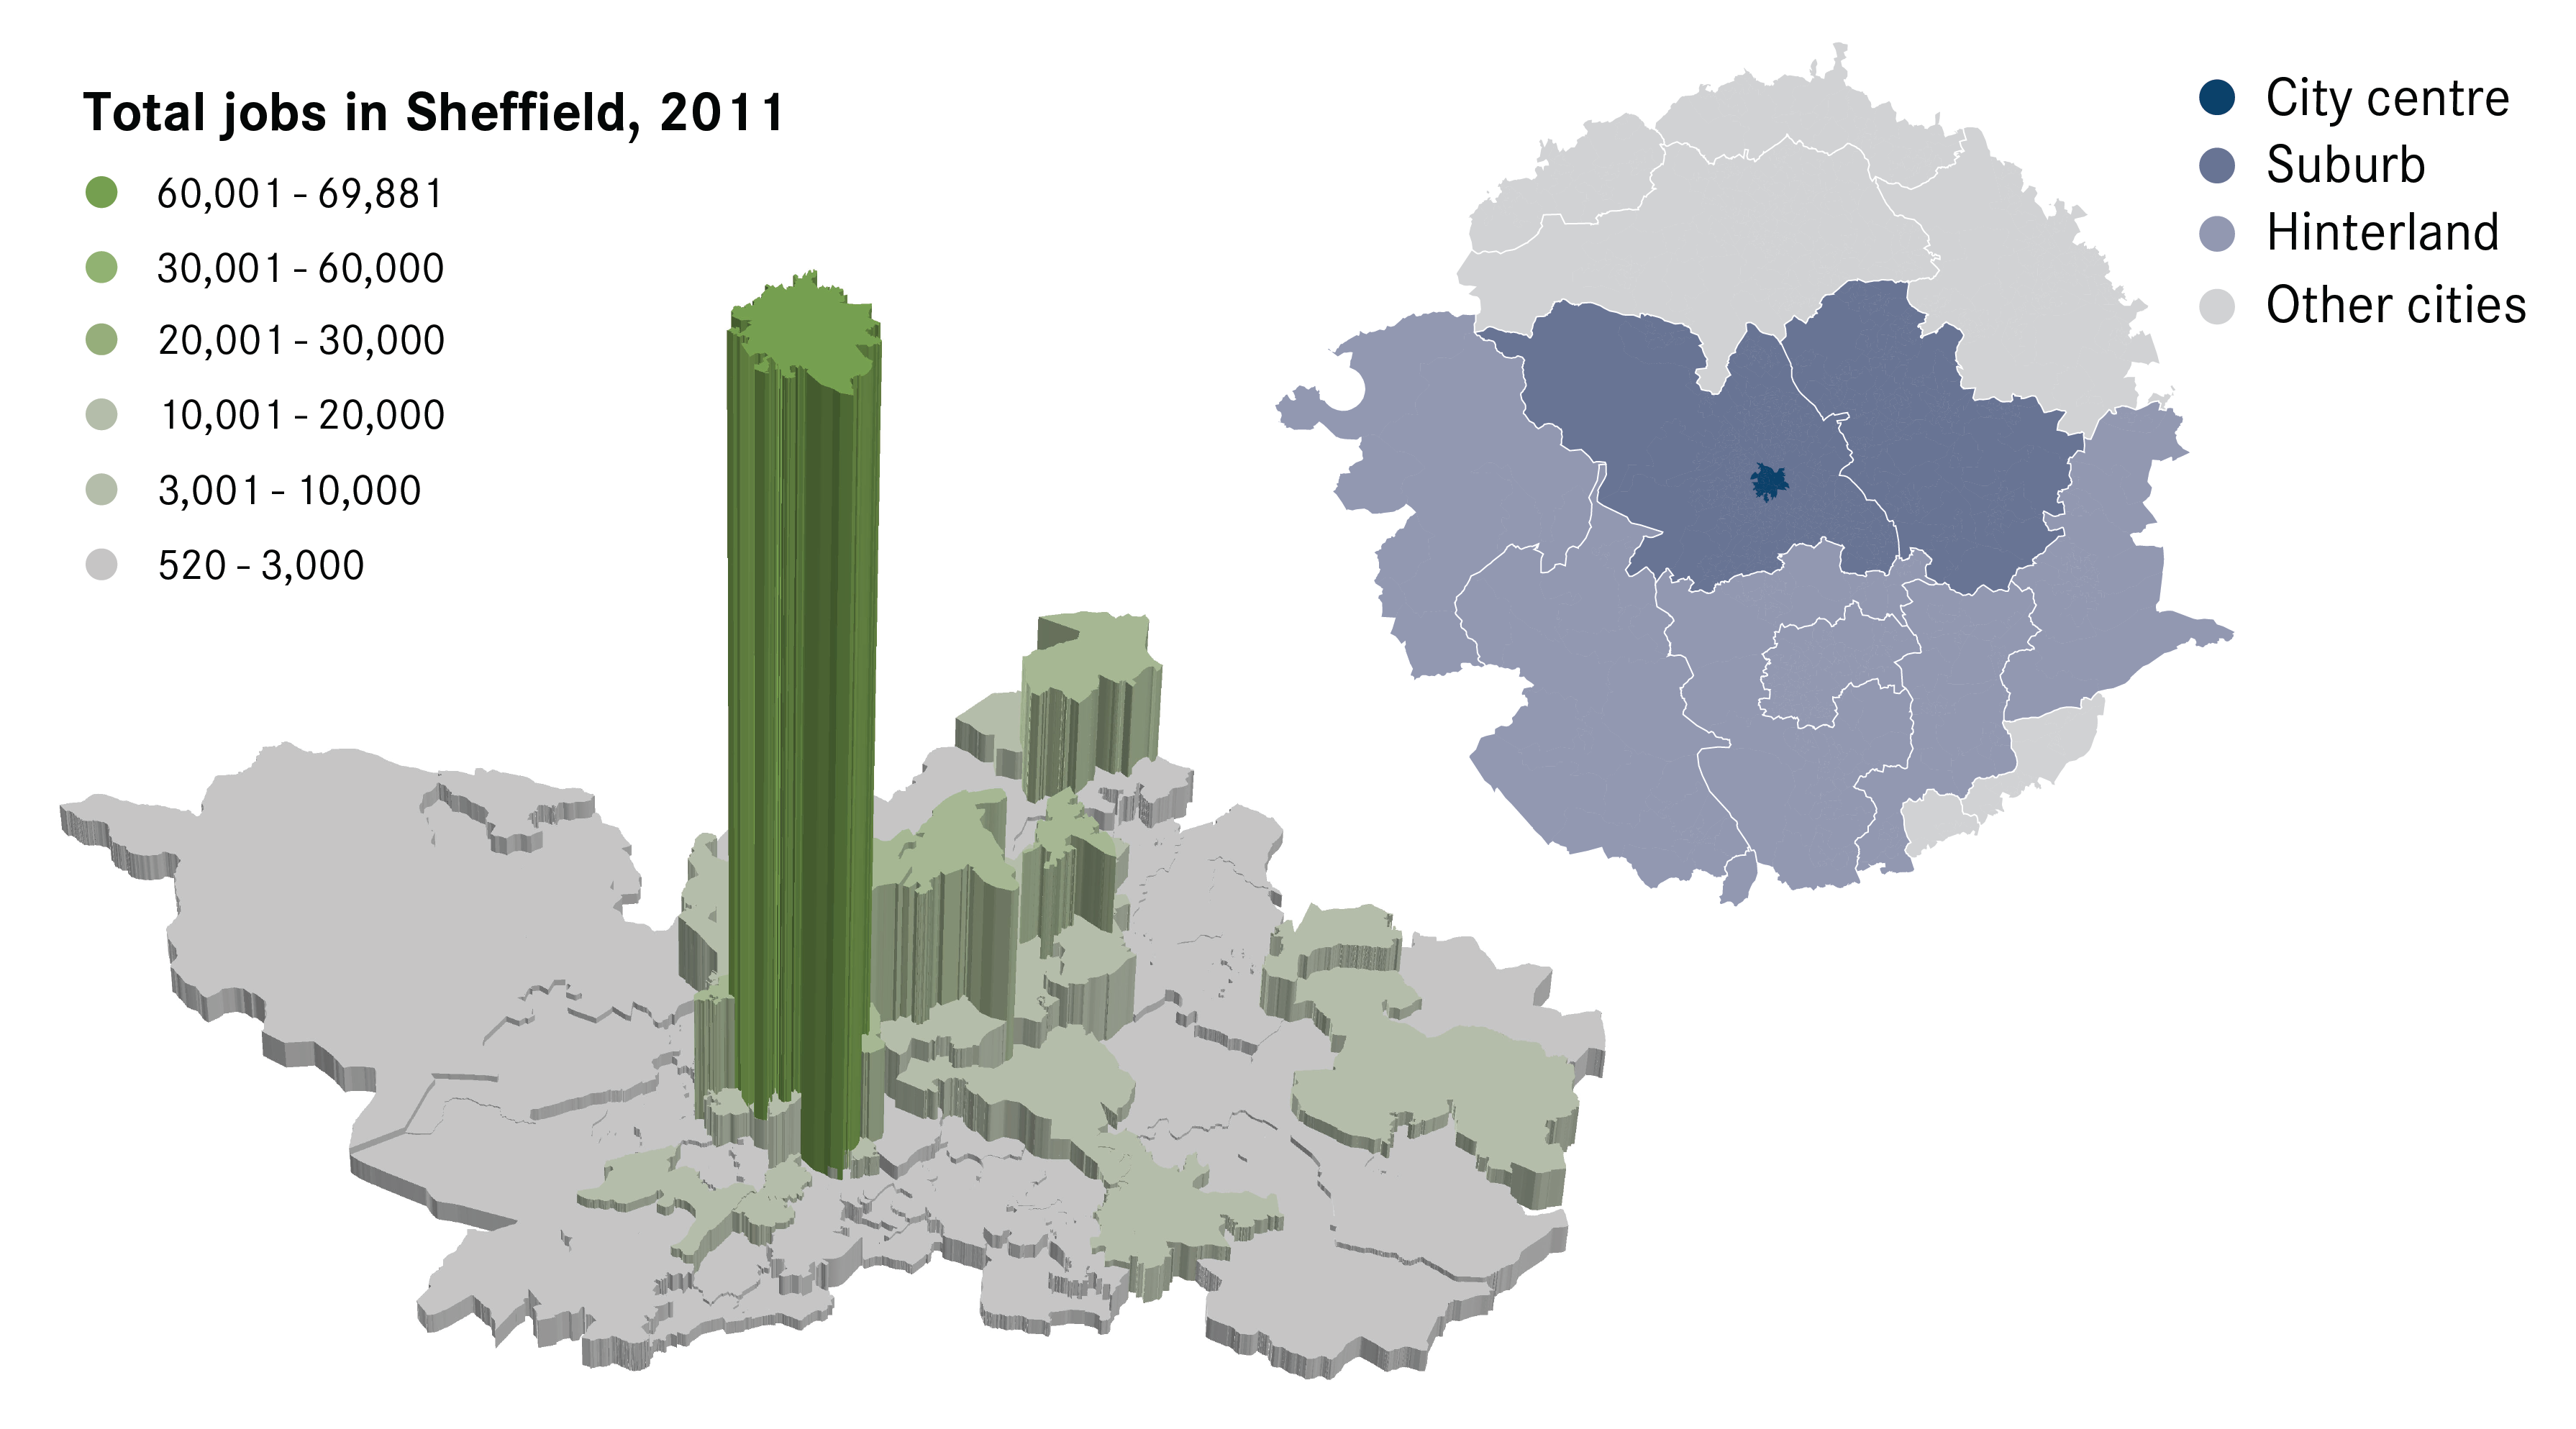
Sheffield’s city centre has also grown very fast over the last 10 years, more than doubling its population. But unlike Manchester, the change in the number of students was equivalent to around three quarters of this growth. The number of employed residents grew much more slowly over this time, and in 2011, just 24 per cent of all city centre residents were in employment, compared to the 54 per cent who were students. And only 23 per cent of the population were aged under 35 with a degree, just over half the share in Manchester’s city centre.
The growth in students in Sheffield’s city centre – which has been similar to the trends seen in areas such as Middlesbrough, Nottingham, and Newcastle – is partly explained by expanding universities,18 but also by the changing geography of student accommodation, where decommissioned student accommodation in suburban areas has been replaced by purpose-built city centre blocks.
The most popular reason given by people surveyed in central Sheffield for why they live there was being close to restaurants, leisure and cultural facilities (36 per cent) – amenities which in turn are likely to have been supported by student footfall in the city centre. A much lower share of Sheffield’s city centre residents also work in the city centre compared to places like Manchester, with many more commuting out to work in the suburbs. This is reflected in the fewer respondents who identified proximity to their workplace as a reason for living in Sheffield’s city centre.19
This trend of out-commuting is driven by the geography of jobs in Sheffield, which are dispersed across the city region (Figure 10) – something which has been exacerbated by the decline in the number of private sector jobs located in the city centre between 1998 and 2011.
Despite the draw of Sheffield city centre as a centre for leisure and culture, which has been supported by its growing student population, this has not played out into a growth in young professionals. The city overall and the city centre in particular have not been able to support the jobs needed to retain graduates or to attract in young professionals, demonstrating how amenities alone are not sufficient to attract working residents.
Brighton
Figure 11: The geography of jobs across Brighton

The city centre of Brighton grew by just 32 per cent between 2001 and 2011 – slower than the average for all city centres across England and Wales. Yet high house prices suggest that it is a popular place to live. Not only does the city have the fourth least affordable housing nationally, but city centre residents also pay a premium to live there instead of the surrounding suburbs.
The survey results emphasise that its restaurants and leisure facilities as well as its high quality built and natural environment – likely to relate to its seaside location – have played into why people choose to live there. But proximity to the workplace does not seem to be a key reason why people live there. Instead, a large number of people commute out of the city centre to work elsewhere.
This is despite Brighton’s city centre economy performing strongly in recent years, with a considerable increase in private sector jobs between 1998 and 2011, particularly in knowledge intensive business services.20 This is likely to have played a role in increasing demand, but so too has an increase in residents commuting to London, likely to reflect respondents’ prioritisation of proximity to public transport over proximity to work. This increasing demand, which is likely to have been exacerbated by the low growth in the number of homes in Brighton over the last 10 years,21 has pushed up house prices.
Brighton has an older demographic in its city centre, 21 per cent of residents were aged over 35 with a degree in 2011. This is likely due to younger residents being priced out by high housing costs. Despite there being two universities in Brighton, few students live in the city centre. Instead, city centre residents are less mobile than in most city centres, with nearly a third of those surveyed saying that they are “very unlikely” to move house in the next two years. Their survey responses have more in common with over 55s rather than young professionals – where being close to countryside and living in a quality built or natural environment were more commonly chosen by respondents in Brighton than in other city centres.
These trends are comparable to other constrained cities such as York and Cambridge, which also have strong city centre amenity offers and high city centre house prices compared to the suburbs. In these places, there is a need to increase the housing supply to prevent young people from being priced out – but without limiting the amount of office space in the city centre, which is crucial for supporting business growth.
Swindon
Figure 12: The geography of jobs across Swindon
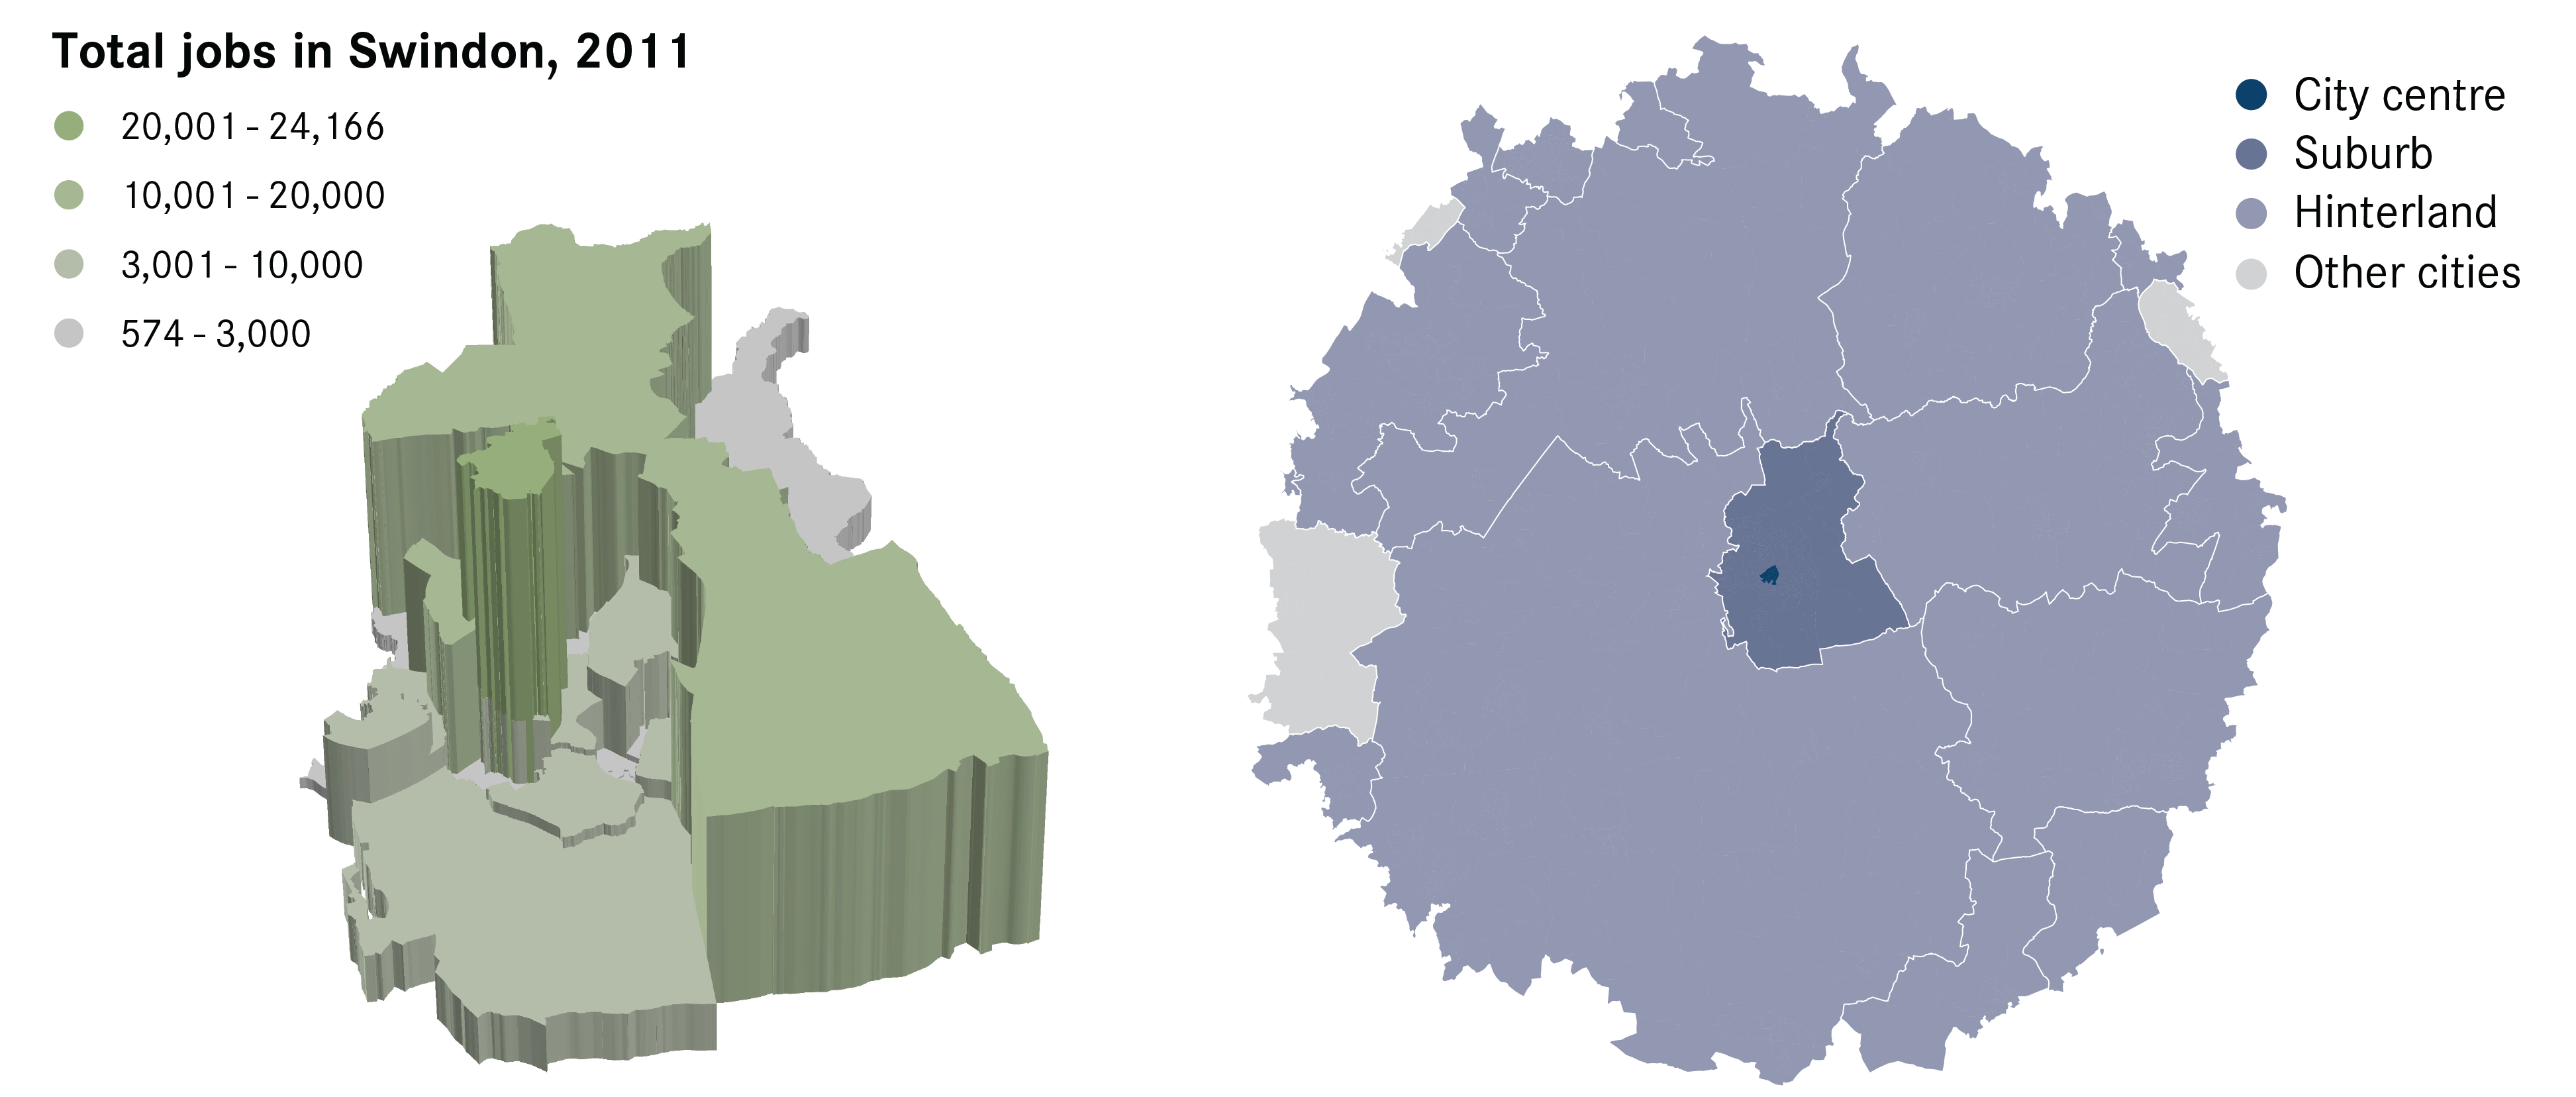
Like Brighton, Swindon also saw slower population growth in its city centre than the average for England and Wales. But the nature of its growth was very different: residents working in low-skilled occupations accounted for the equivalent of more than half of its growth, and residents without a degree accounted for the equivalent of two thirds of its growth. In 2011, 39 per cent of its residents were unemployed, economically inactive or under 16, and just 14 per cent of its residents were aged under 35 with a degree.
This demographic profile, which is more characteristic of a suburb, suggests that the city centre has less of a distinctive draw seen in other city centres. This is reflected in the polling results, which show that city centre residents surveyed chose to live there because of the cost, size and type of housing available, and more than in other city centres, because of the proximity to good schools. This suggests that it is the availability of cheaper housing, rather than access to leisure, culture and the workplace, that is the principal reason why people choose to live in Swindon city centre.
Unlike Manchester and Sheffield, Swindon does not have a major university, something which is likely to play into its older demographic. But its demographic is also strongly related to its relatively weak city centre economy. Between 1998 and 2011 the number of private sector jobs located in the city centre fell. There are fewer professional job opportunities in Swindon than in the average city centre, and most people living in the city centre commute out to jobs elsewhere. In 2011, only 17 per cent of city centre residents also worked there.
In the other cities surveyed, proximity to work was a more frequently chosen reason for living in the city centre, and became less so in suburbs and hinterlands. In Swindon the opposite is true – a much higher share of suburban residents surveyed chose this as an answer than those in city centres. Without the benefit of proximity, there is little incentive for young professionals to live in the city centre, and so it has not developed as an amenity-rich location as seen in other city centres such as Manchester.
The lessons from Swindon are likely to apply to a large number of small and medium-sized cities, such as Doncaster, Newport and Worthing, that have seen lower than average population growth in their city centres. In these places, it is likely to be cheaper housing that drives people’s choice to live in the city centre, rather than access to leisure, culture or the workplace.
City centre jobs have been crucial in supporting city centre living
The four case studies demonstrate how there have been two key factors driving city centre growth over recent years: universities and jobs. Universities have played a key role in drawing residents into city centres, most notably in large cities such Sheffield, but also in smaller cities such as Middlesbrough and Oxford. The presence of students has also had an influence on the ability of these places to support leisure and cultural amenities, but as Sheffield demonstrates, this city centre lifestyle alone is not sufficient to retain graduates within a city after university.
In cities where growth has been primarily driven by young professionals, as seen in Manchester (as well as in Birmingham and Reading), it has been matched by jobs growth, particularly in high-knowledge industries. Where these jobs exist in the city, graduates and young professionals have been likely to stay or move into the city from elsewhere. And when those jobs are located in the city centre in particular, residents are more likely to also live in the city centre to be able to live close to their workplace, as well as to be near to restaurants, leisure and cultural facilities that tend to be valued highly by city centre residents in Manchester, Sheffield and Brighton.