
04How tax and spend plays out across city-regions
As well as there being a divergence across combined authorities and LEPs, local authorities also play different roles within these geographies.
Around half of all workers in Britain live in one local authority but work in another, meaning that these workers generate tax in one authority, but consume public services in another.7 For this reason, and particularly in light of discussions around devolution to combined authorities, it’s also important to look at the role that local authorities play within combined authorities. This section looks at the similarities and differences seen in Greater London, Greater Manchester and the proposed West Midlands combined authority area.
Mapping tax across city-regions
Core urban authorities raise the lion’s share of taxes in a city-region. As Figure 12 shows, Manchester and Birmingham local authorities and Inner London raised the largest shares of all economy taxes in their wider area. This holds even when accounting for workers. Manchester local authority raised 30 per cent of Greater Manchester’s economy tax take, despite accounting for 28 per cent of jobs. Birmingham local authority accounted for 41 per cent of jobs but 43 per cent of economy tax take. And Inner London generated 72 per cent of economy taxes but was home to 60 per cent of Greater London’s jobs. In Greater London 45 per cent of taxes were raised in just three boroughs – Westminster, City of London and Tower Hamlets.
Figure 12: Tax raised across Greater Manchester, Greater London and Greater Birmingham city-regions
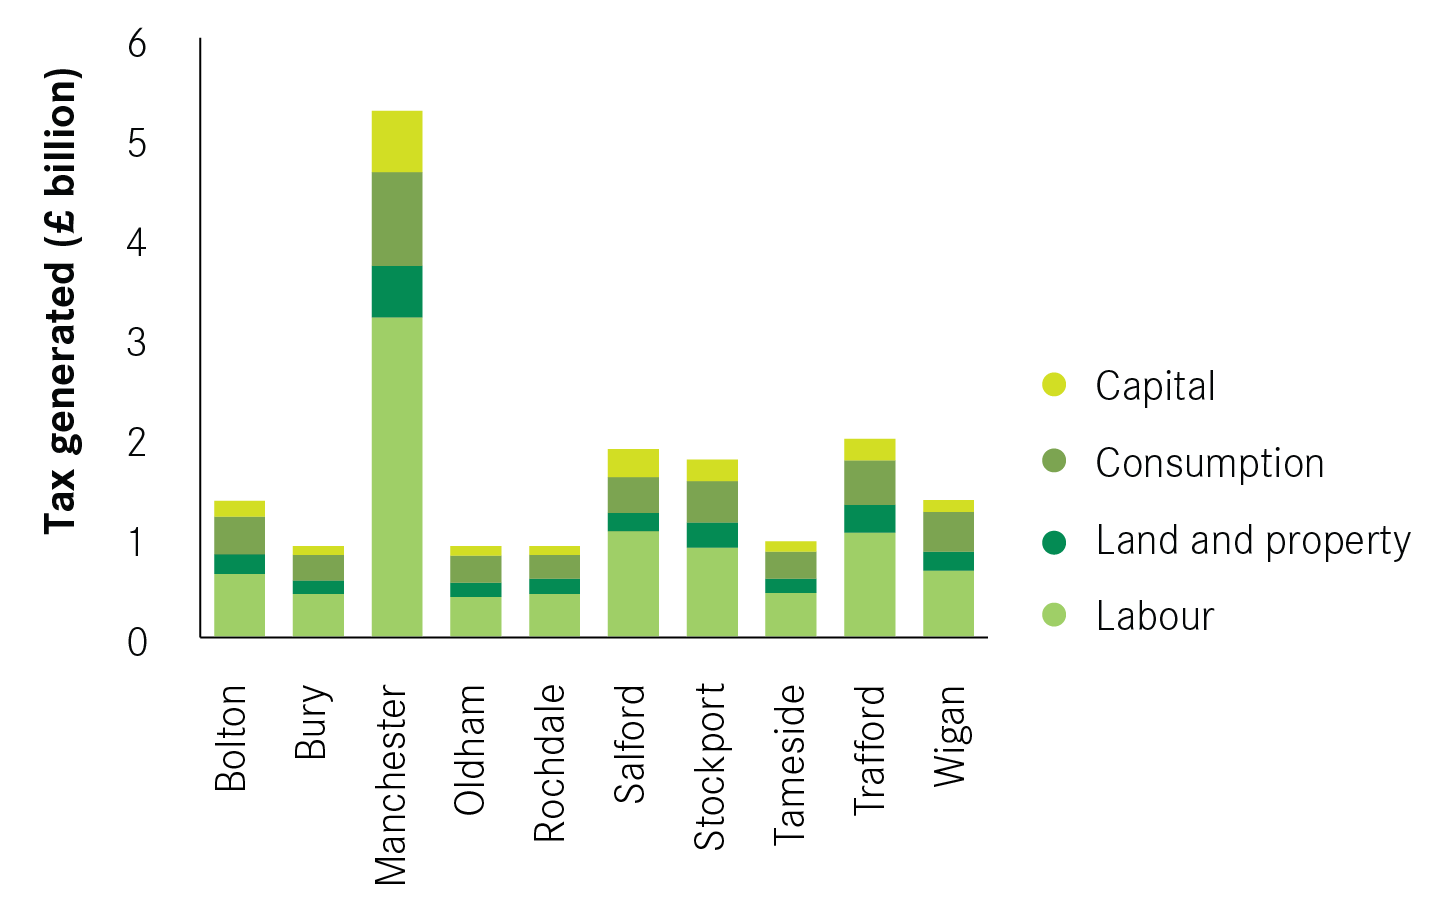

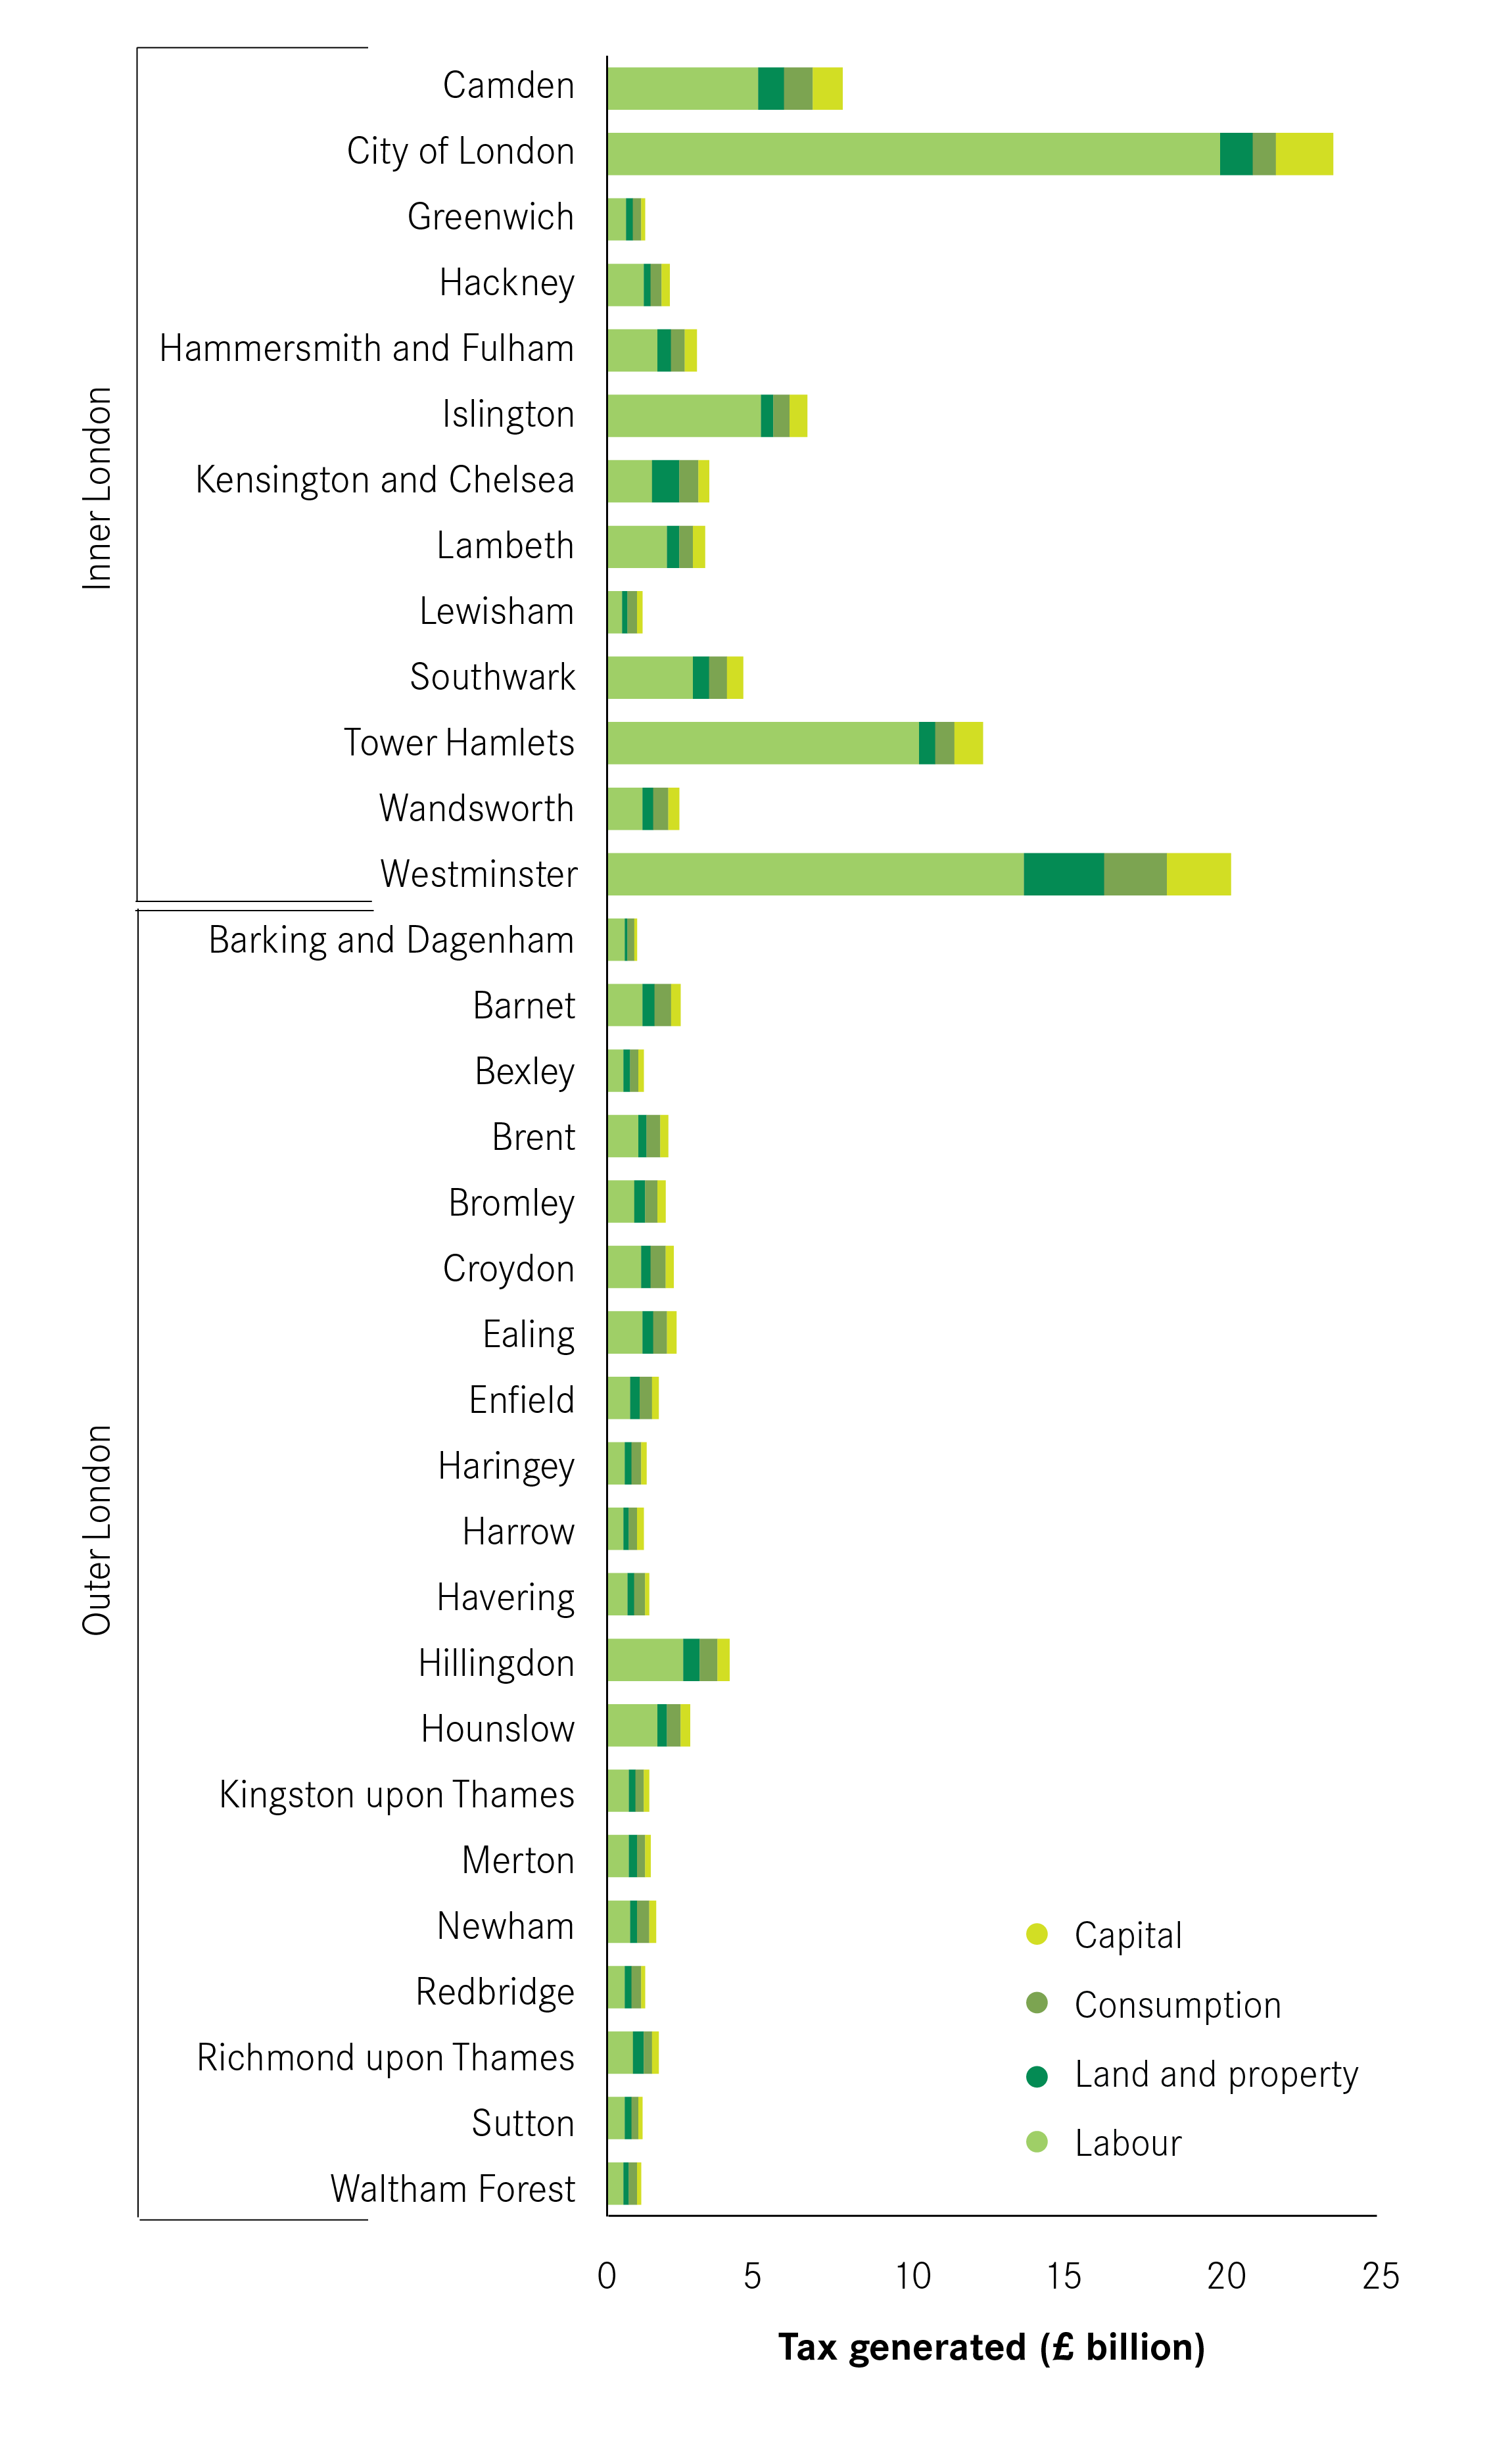
Tax generated per worker also tends to be higher in the core authorities. In Inner London, economy tax take per worker was £32,100, compared to £18,300 in Outer London. In Birmingham and Manchester this wasn’t so clear cut – Salford had a higher economy tax take per worker than Manchester local authority, while Solihull and Coventry had a higher take than Birmingham. To some extent this is likely to be influenced by local authority boundaries. Given what we know about the types of jobs in city centres and the business rates levied on commercial property within them,8 if data was available on the city centres of both authorities they would likely better match the patterns seen in Greater London.
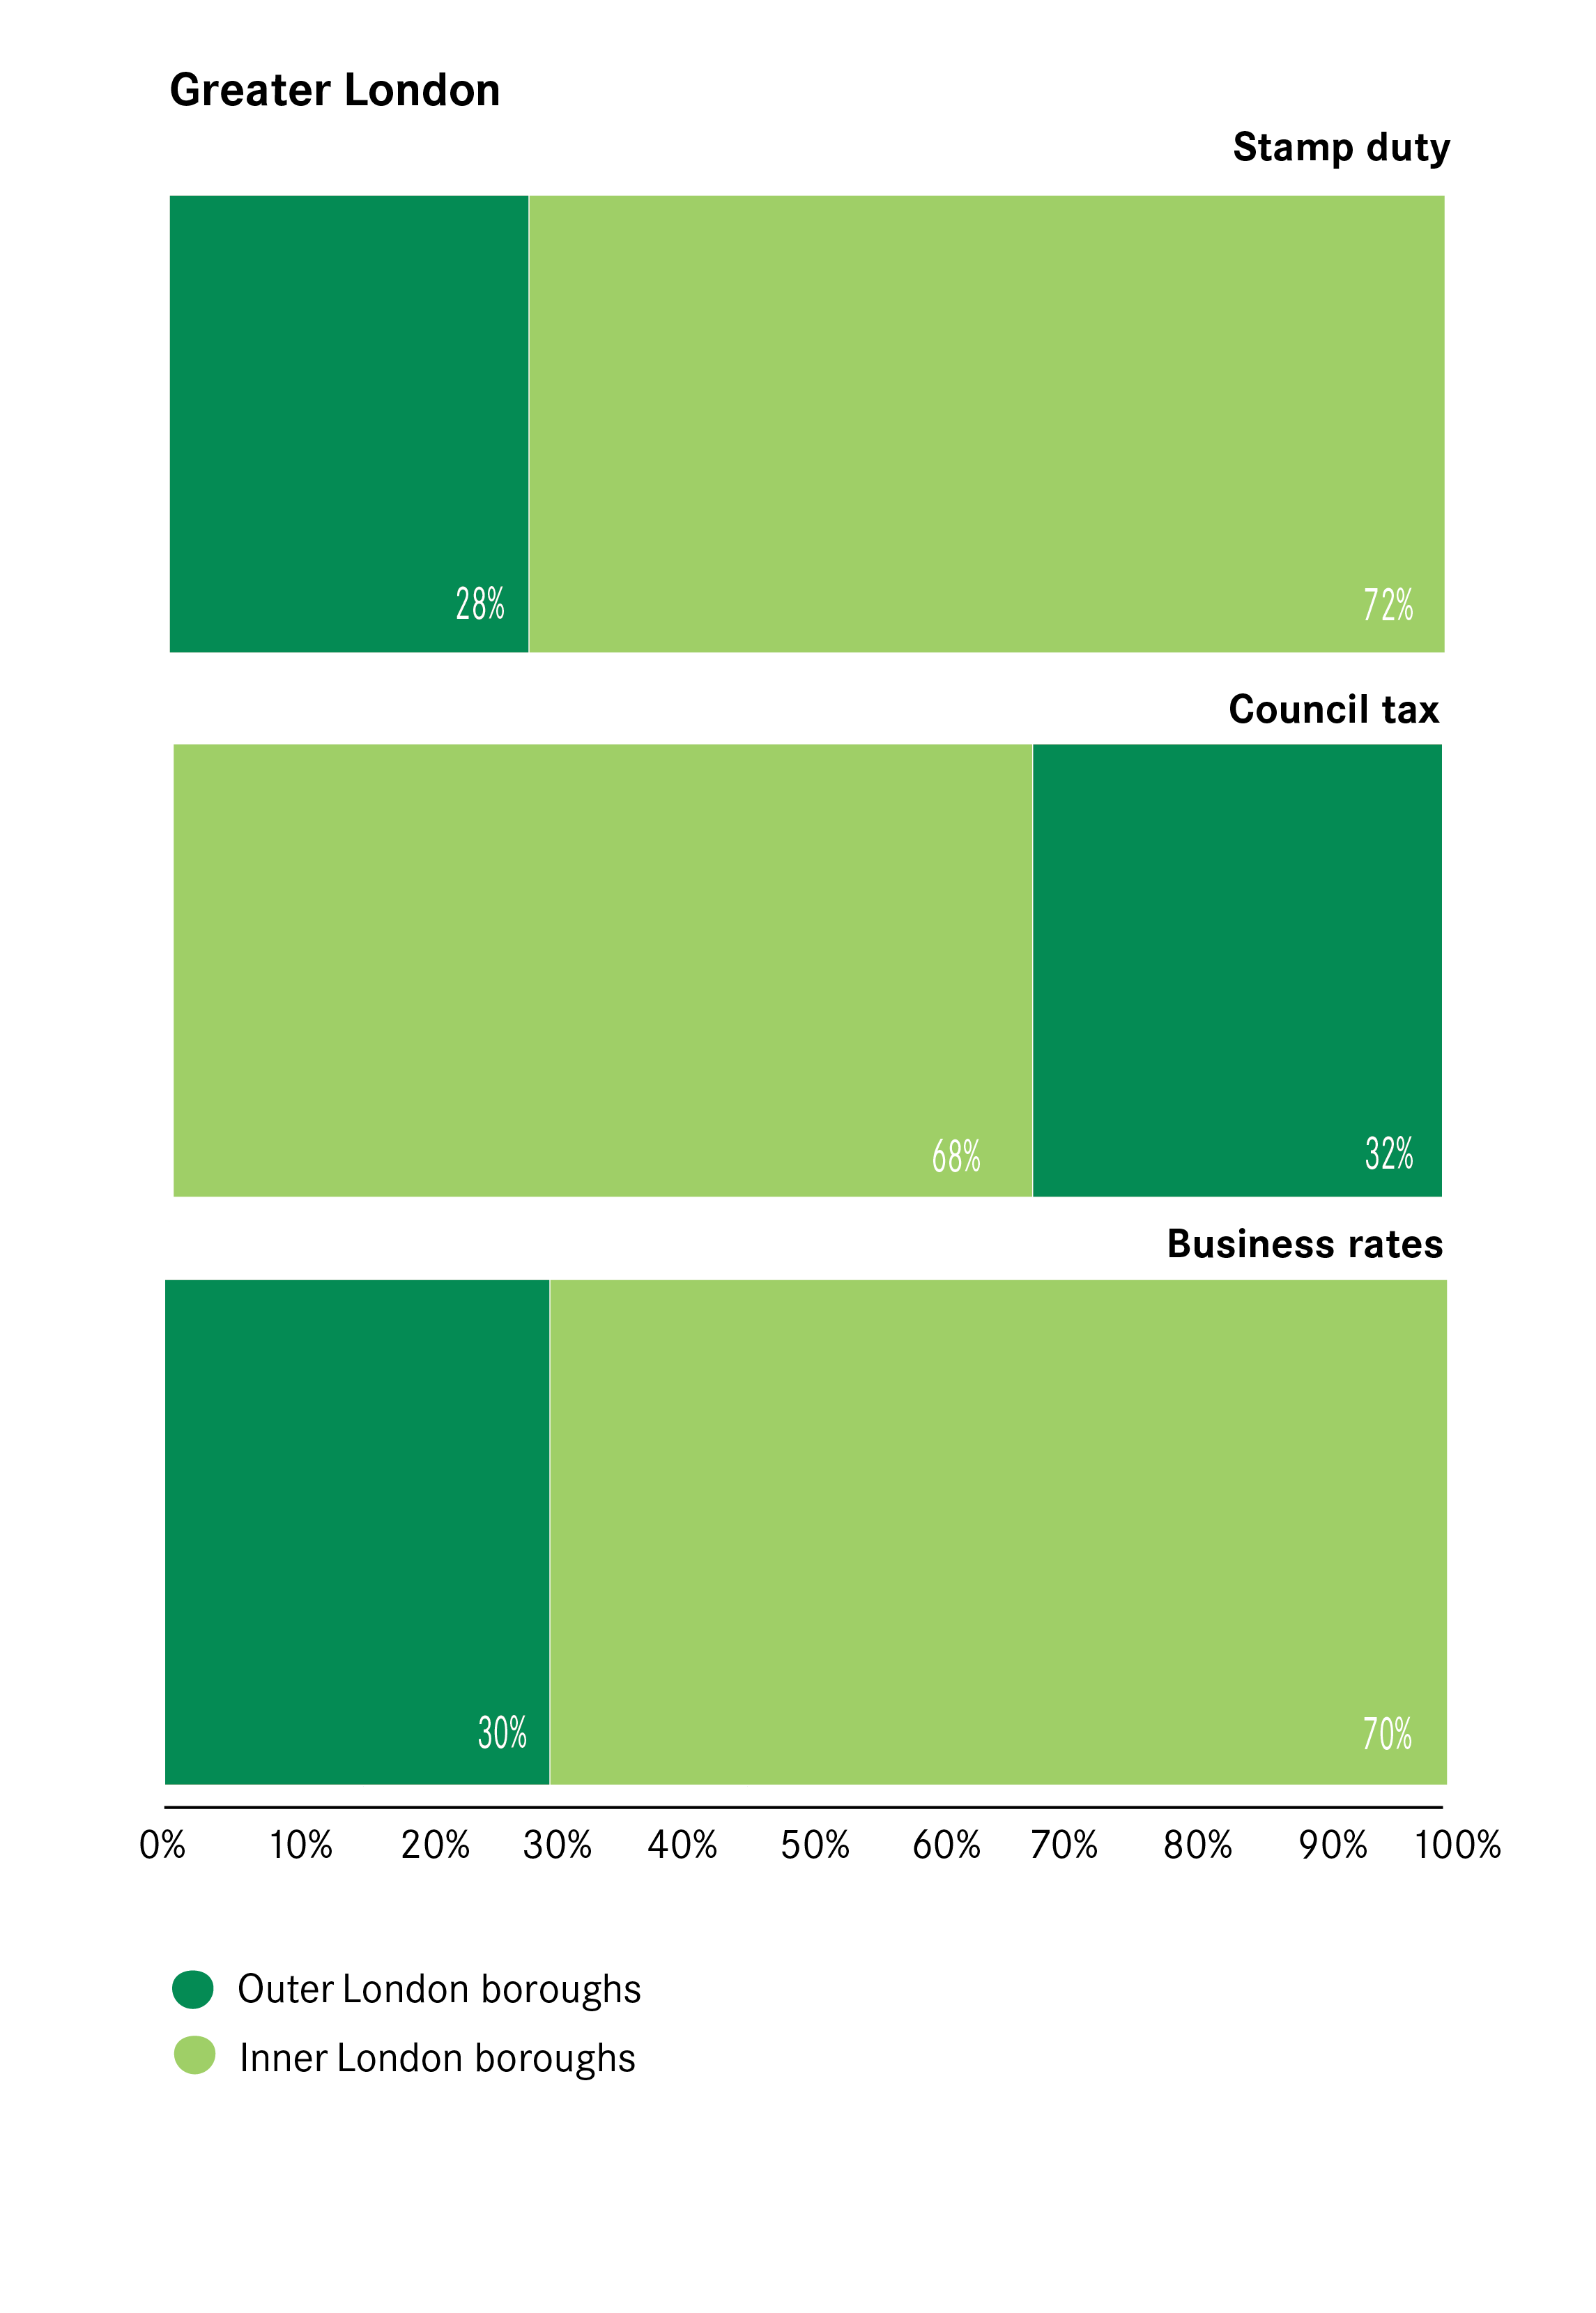
Labour taxes make a much greater contribution to the overall tax take in the core authorities than elsewhere. As Figure 13 shows, this is most extreme in Greater London, where labour taxes account for 68 per cent of all taxes raised in Inner London, compared to 45 per cent in Outer London. The Inner London boroughs, and London’s boroughs more generally, are reliant on their neighbours to generate their income tax. Workers who commute into Greater London accounted for around £21.4 billion of all labour taxes raised – 16 per cent of the total amount of all tax raised in the capital in 2013/14, and more than the total combined amount of tax take in the North East Combined Authority and West of England LEP.
Figure 13: Share of taxes raised across city-regions
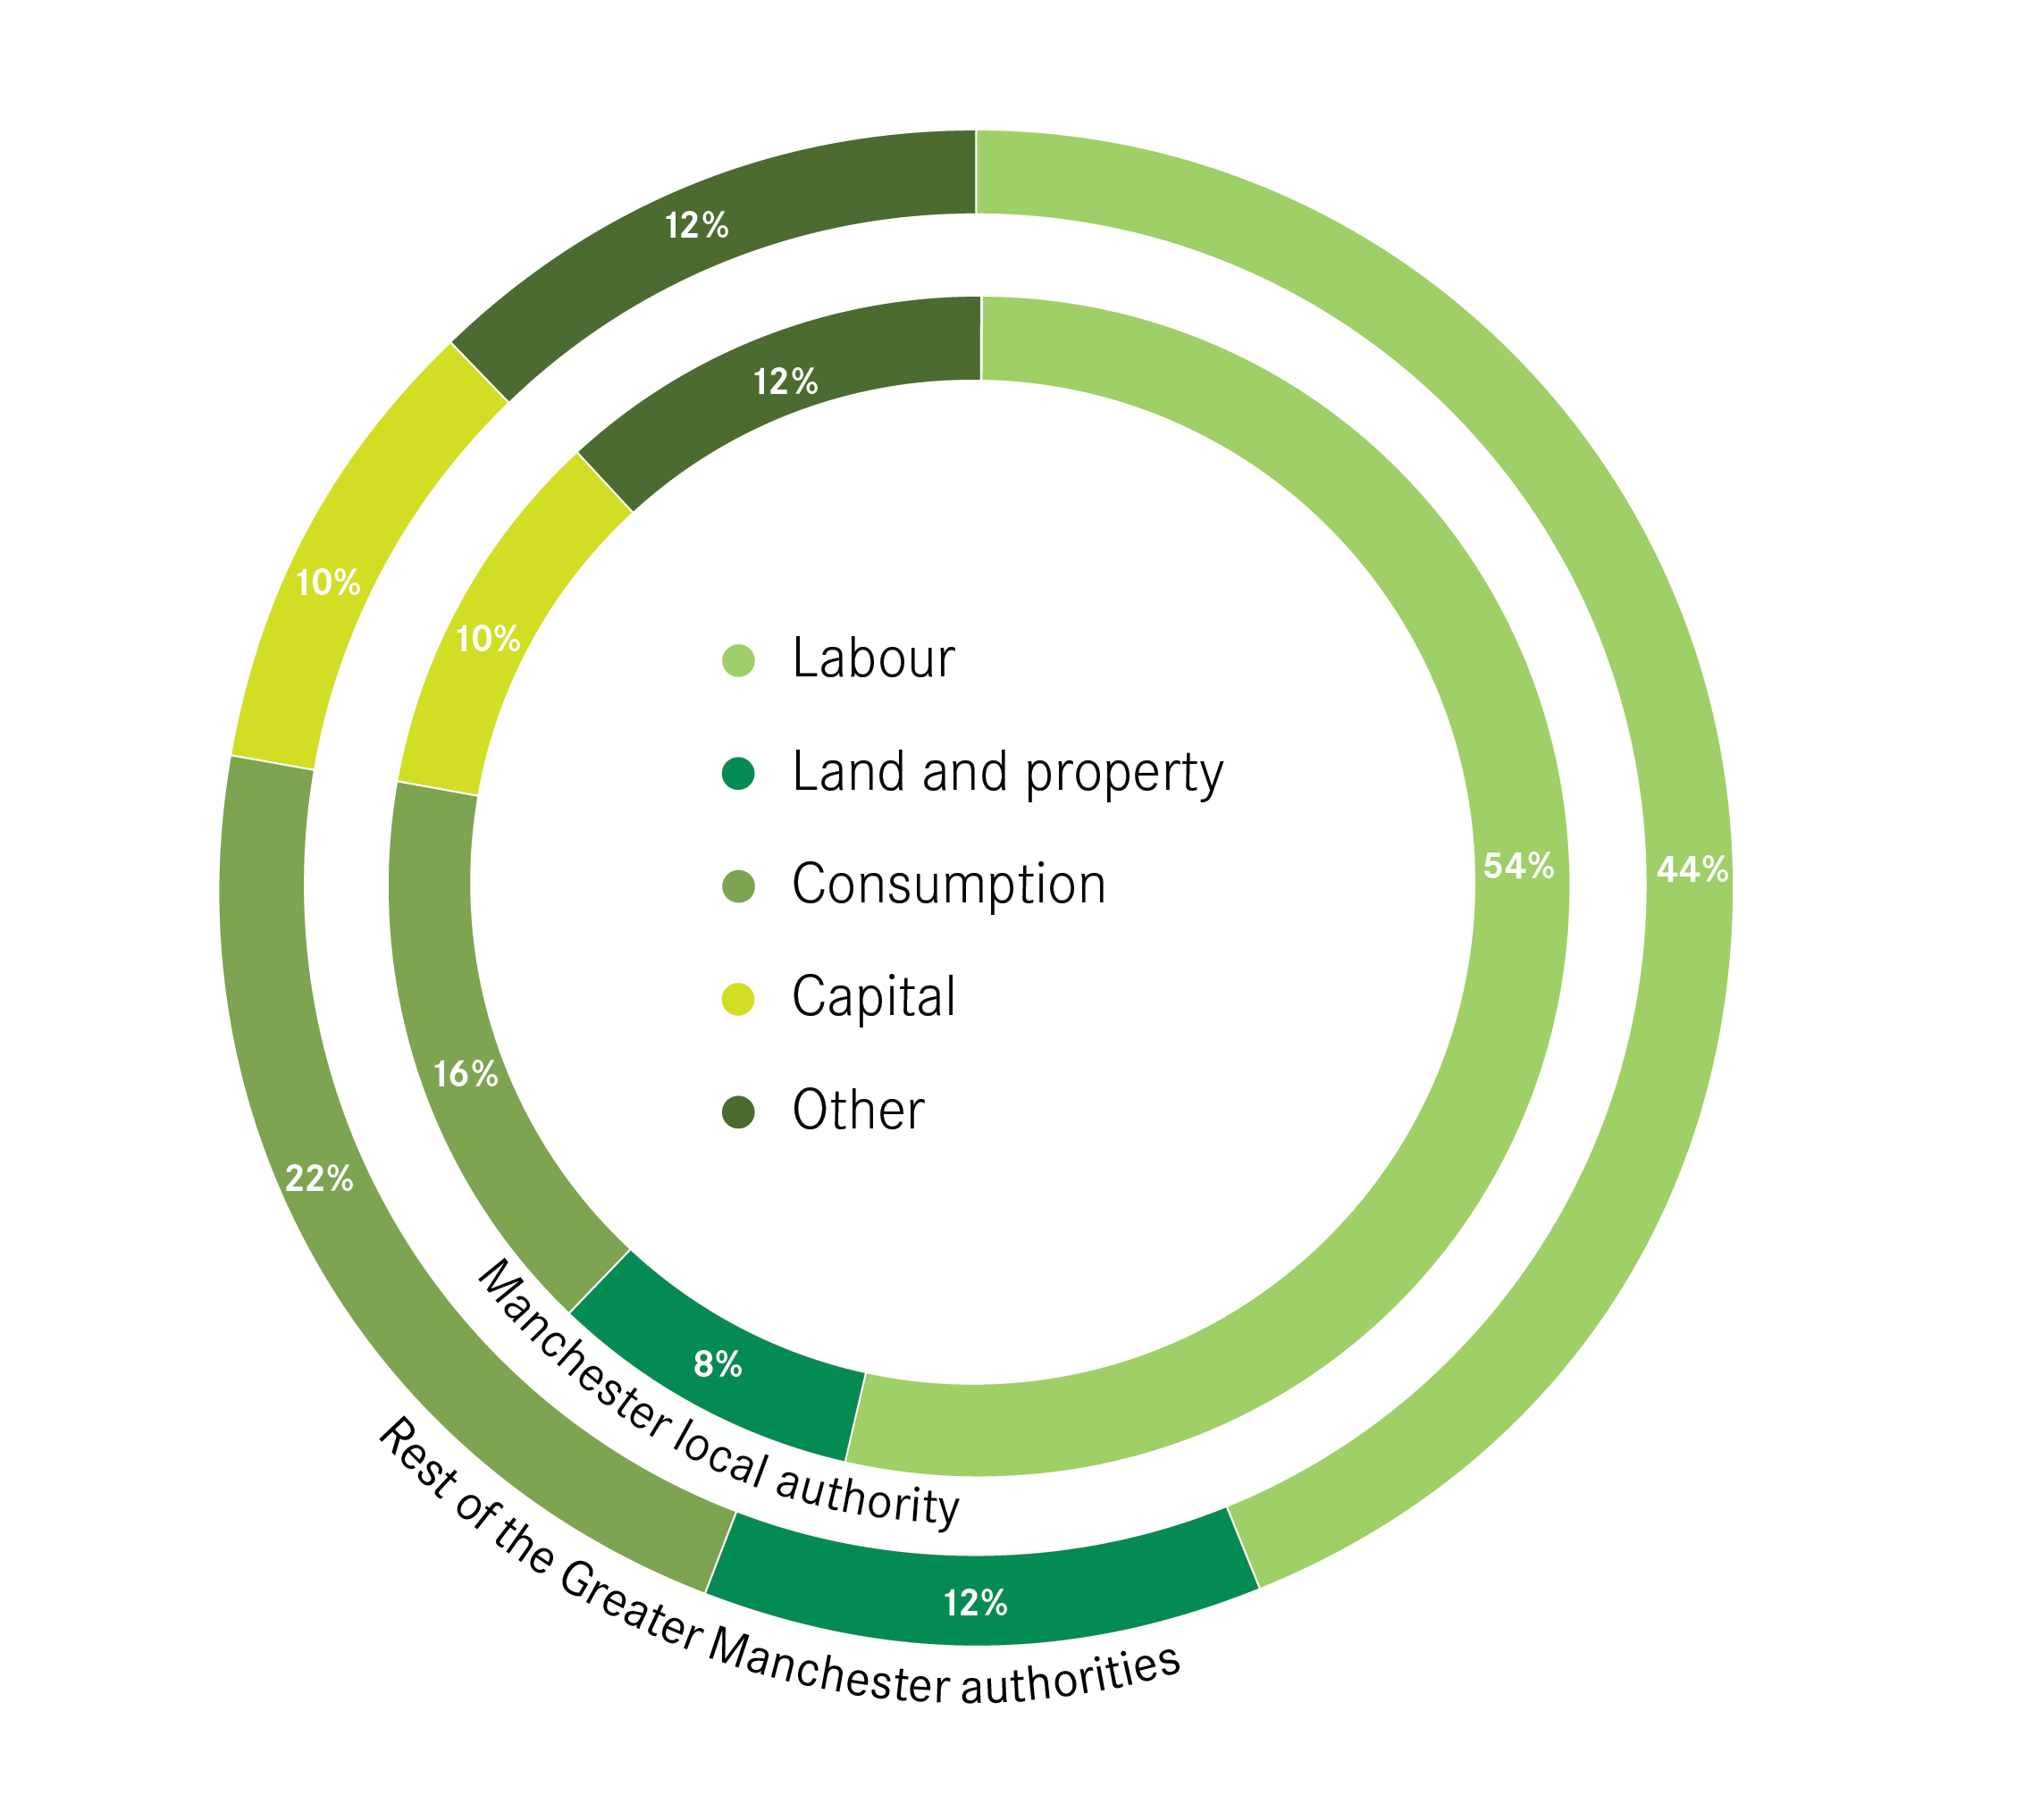


Land and property taxes play a larger role in the outer local authorities, although it is worth noting that the core local authorities still raise the largest absolute amount of tax. But there is a distinction here. Business rates drive the overall land and property tax take in the core authorities, while council tax makes up the largest contribution elsewhere (reflecting the differing distribution of jobs and people across a city-region). For example, Manchester accounted for nearly a third of all business rates generated across all 10 Greater Manchester local authorities in 2013-14, but only 14 per cent of council tax raised. In contrast, Stockport accounted for 14 per cent of all council tax generated but only 8 per cent of business rates. Box 3 discusses the role of property taxes in total tax generation.
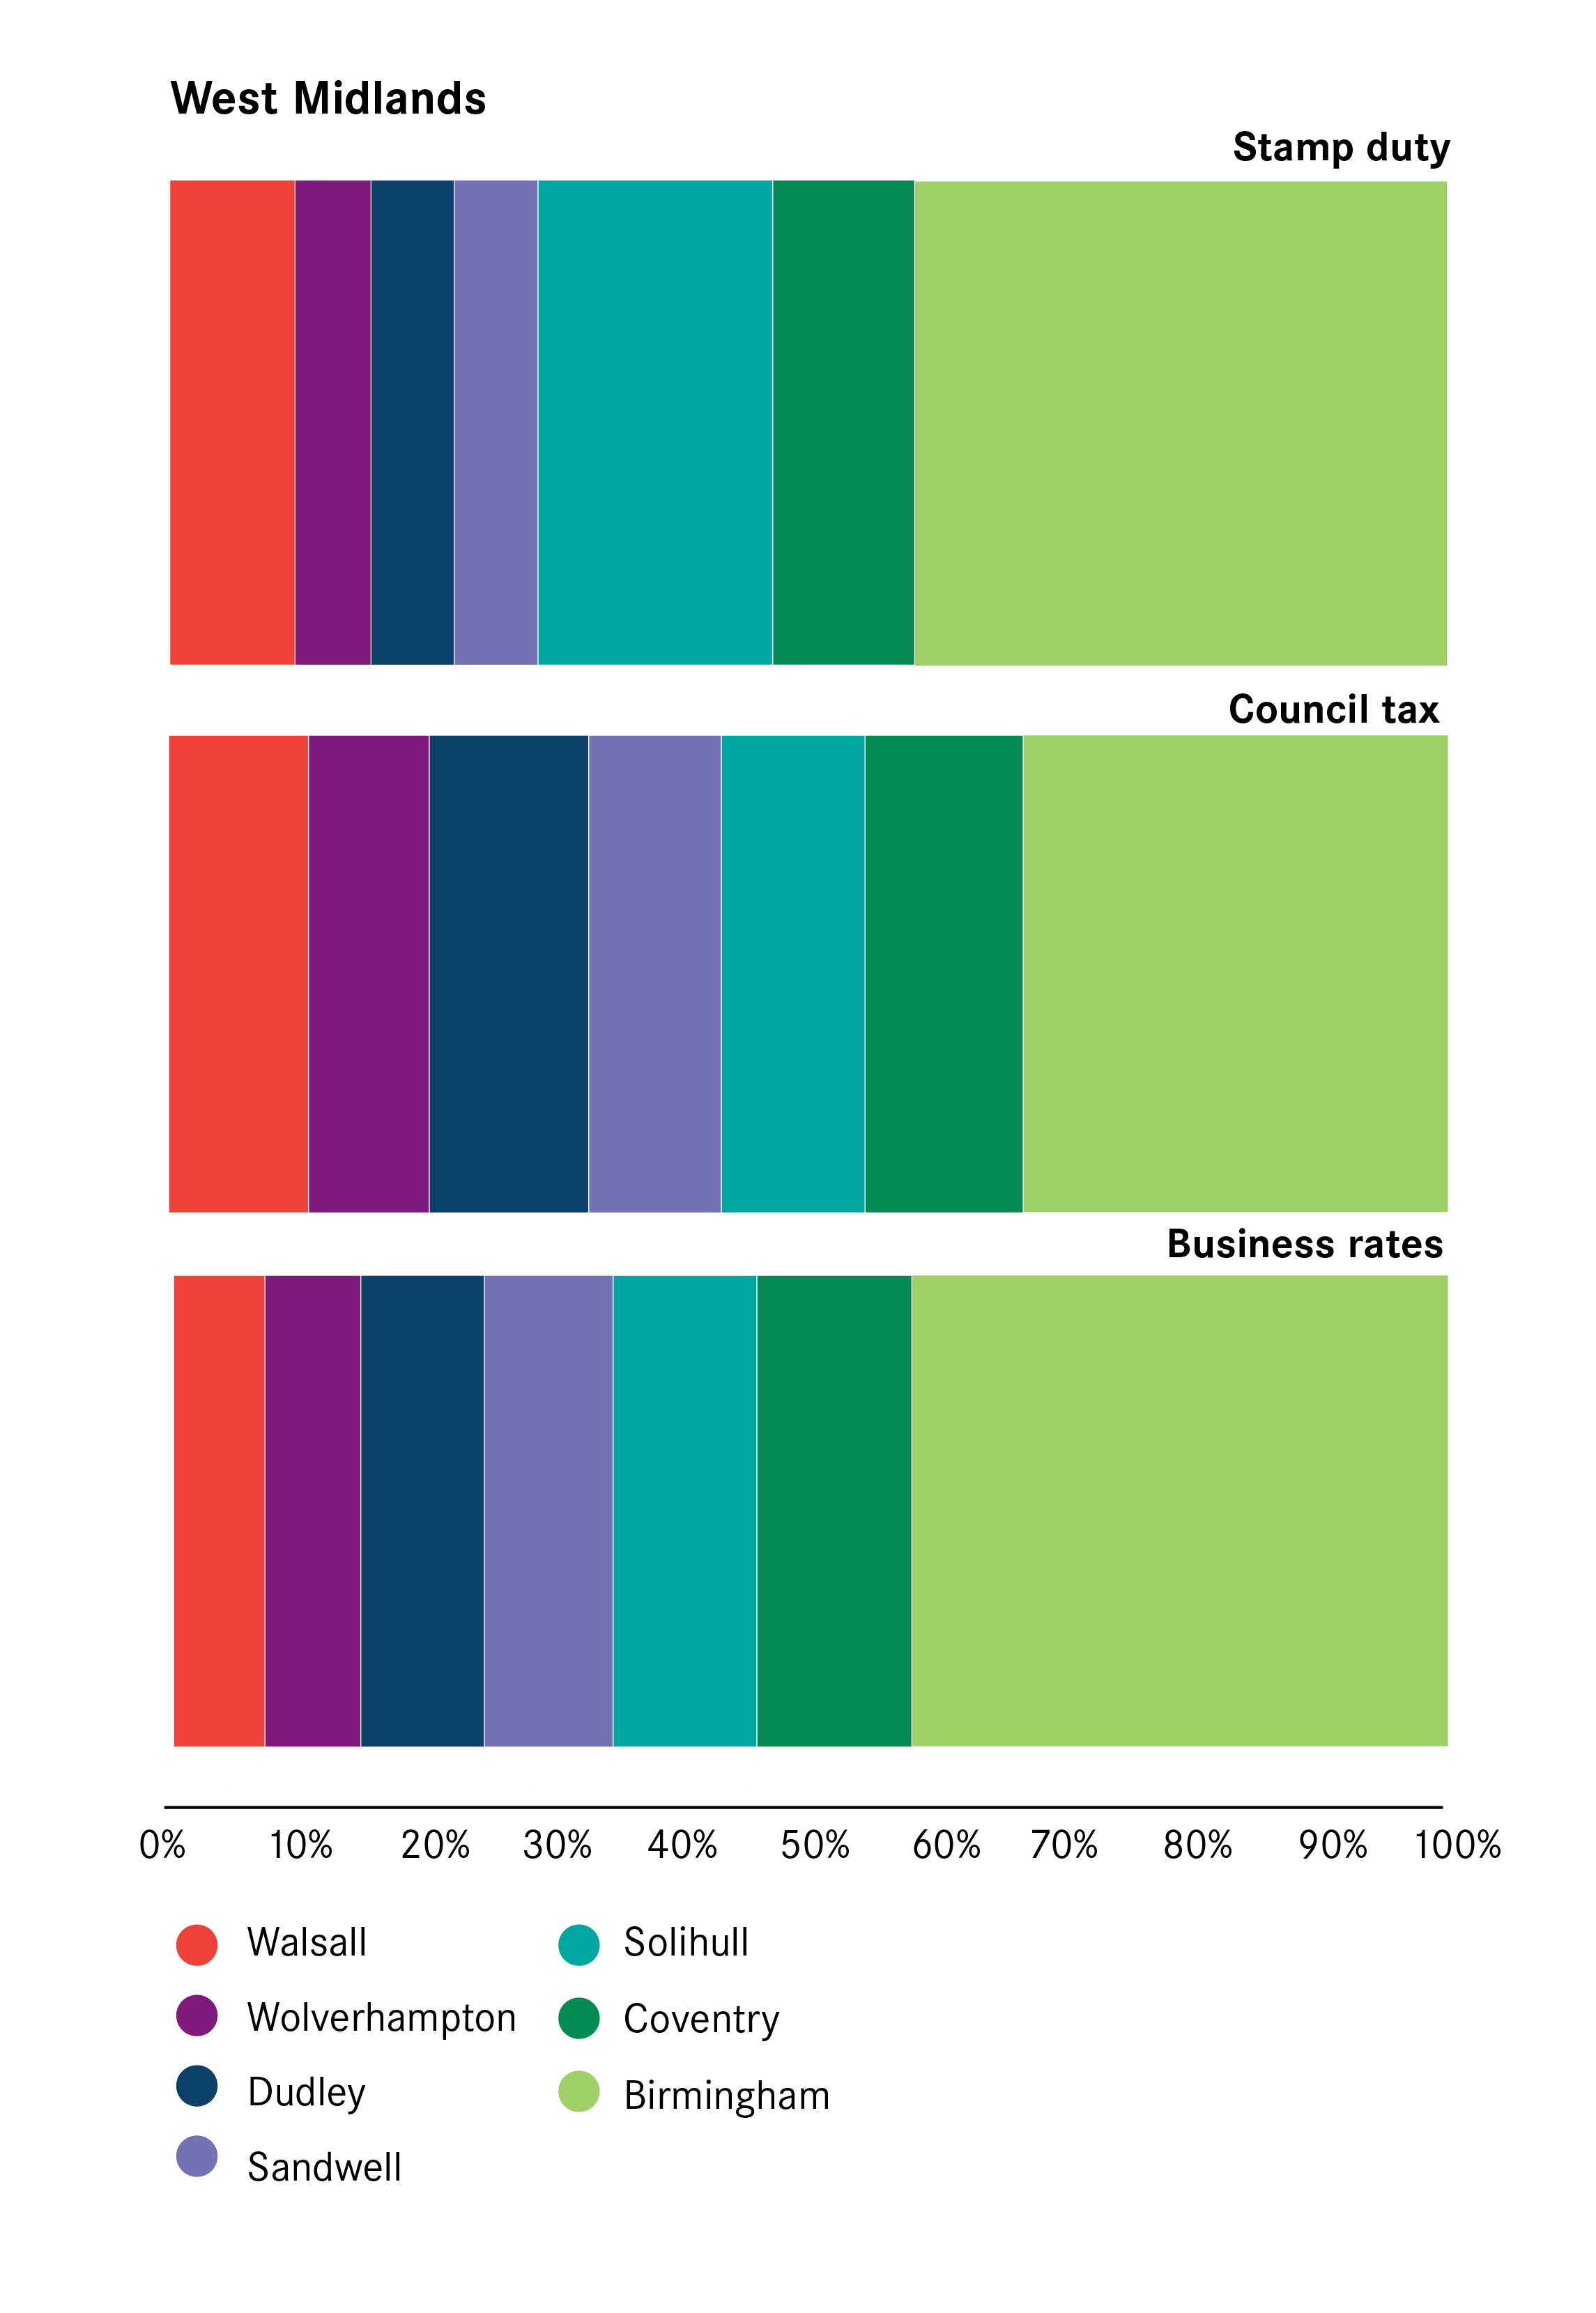
Figure 14: Where property taxes are raised

Box 4: The role of property taxes
The report by the London Finance Commission published in May 2013 set out the case for greater fiscal devolution to Greater London and England’s other large cities. It recommended that property taxes (council tax, business rates, stamp duty and annual tax on enveloped dwellings) should be devolved in full, as well as giving the GLA more freedoms to levy local taxes. The Core Cities backed the report and have also called for greater devolution of property taxes to cities.9
Property taxes make up a relatively small part of taxes in Britain, accounting for 11 per cent of all taxes raised nationally. They made up between 11 and 16 per cent of the total taxes raised across city-regions in Britain, but the composition of this varied across the country which has implications for the impact of devolution of specific taxes. Figure 15 shows the variation seen across our case study city-regions.
Property taxes raised as a share of total tax take in 2013-14
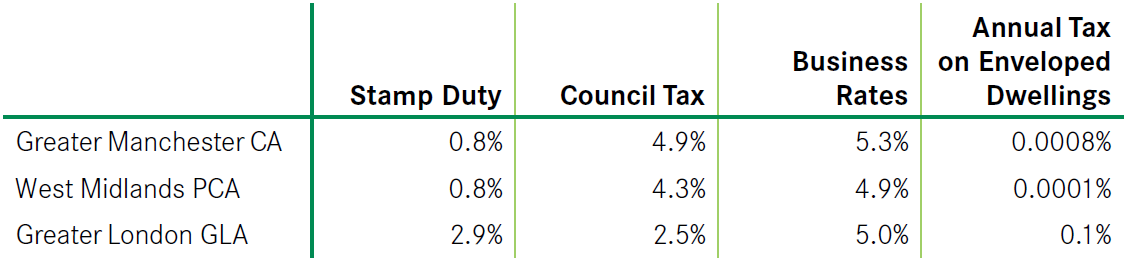
Council tax plays a smaller role in Greater London that in the other city-regions, but stamp duty accounts for a much larger share. The capital accounted for 42 per cent of Stamp Duty raised in Britain in 2013/14 and the £3.9 billion generated accounted for 3 per cent of the total tax take in London. This take was dominated by just two boroughs – Westminster and Kensington and Chelsea account for 32 per cent of all stamp duty within London.
Mapping public expenditure across city-regions
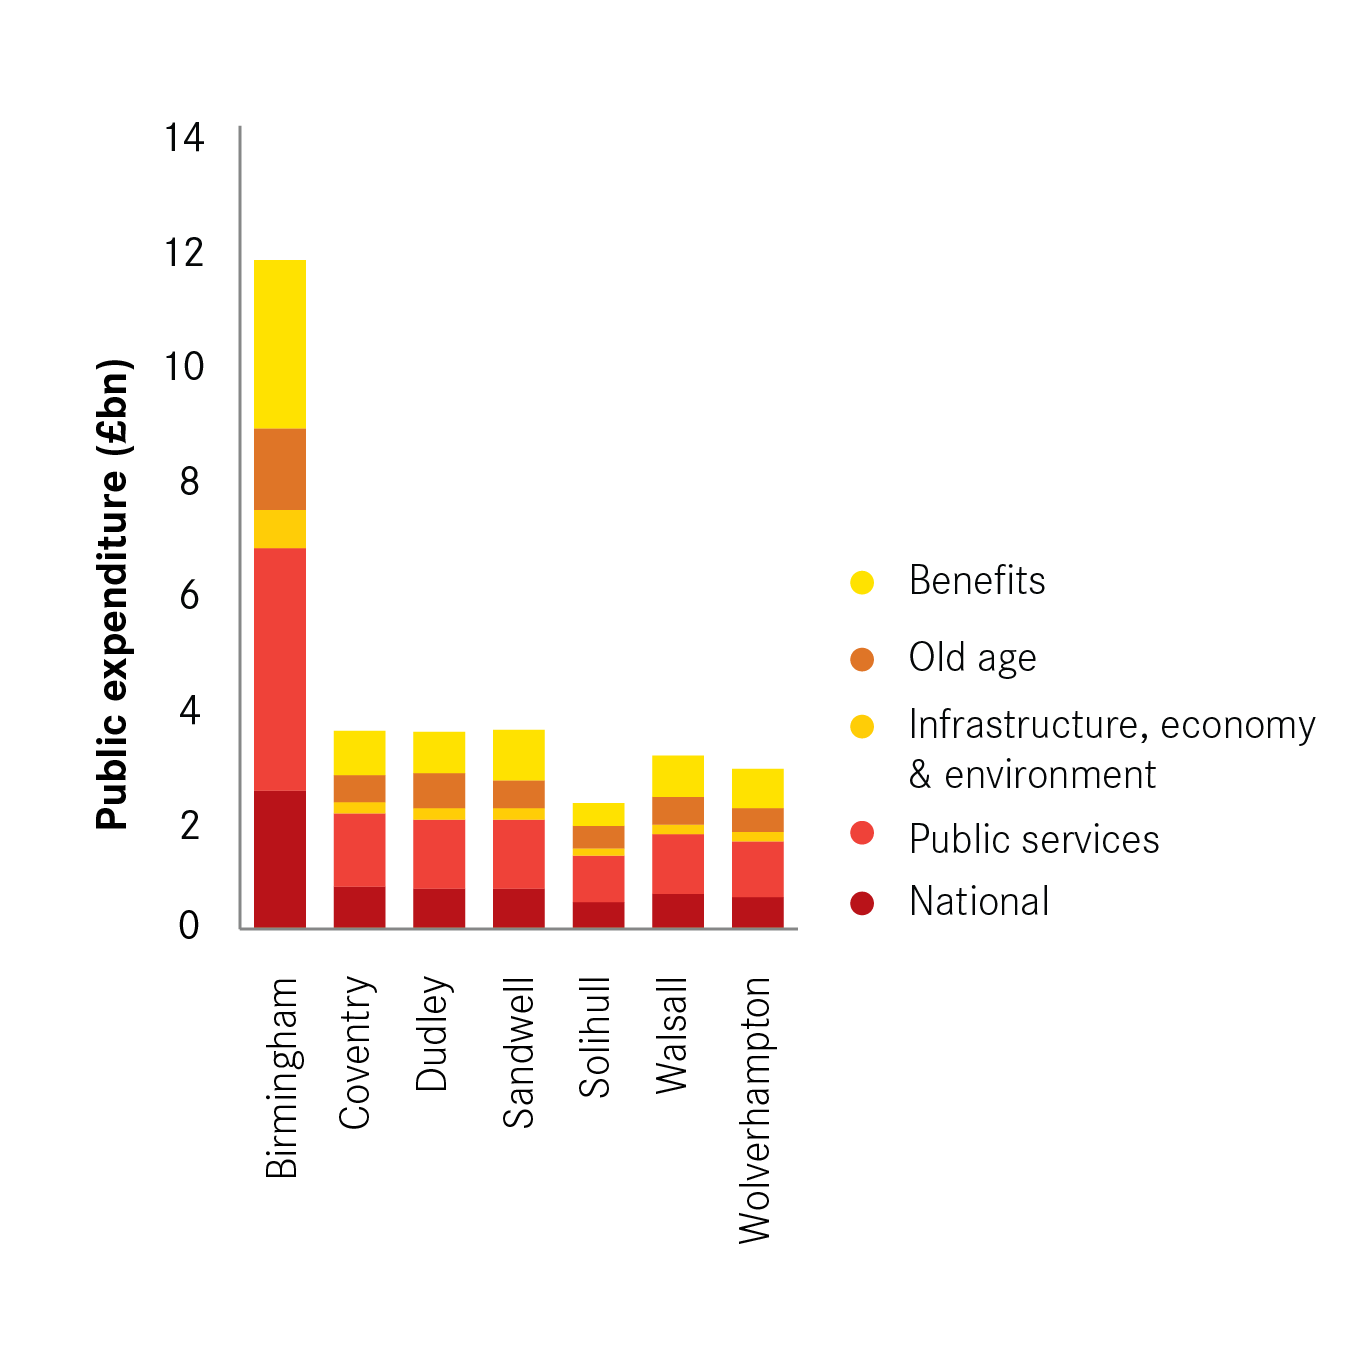
Compared to taxes generated, there is less difference in public expenditure between local authorities at city-region level. As Figure 16 shows, core urban authorities account for more public spending than surrounding authorities in the city-region. Birmingham and Manchester local authorities accounted for 39 per cent and 19 per cent respectively of total spend, while in Inner London it was 36 per cent.
Figure 16: Public expenditure across city-regions

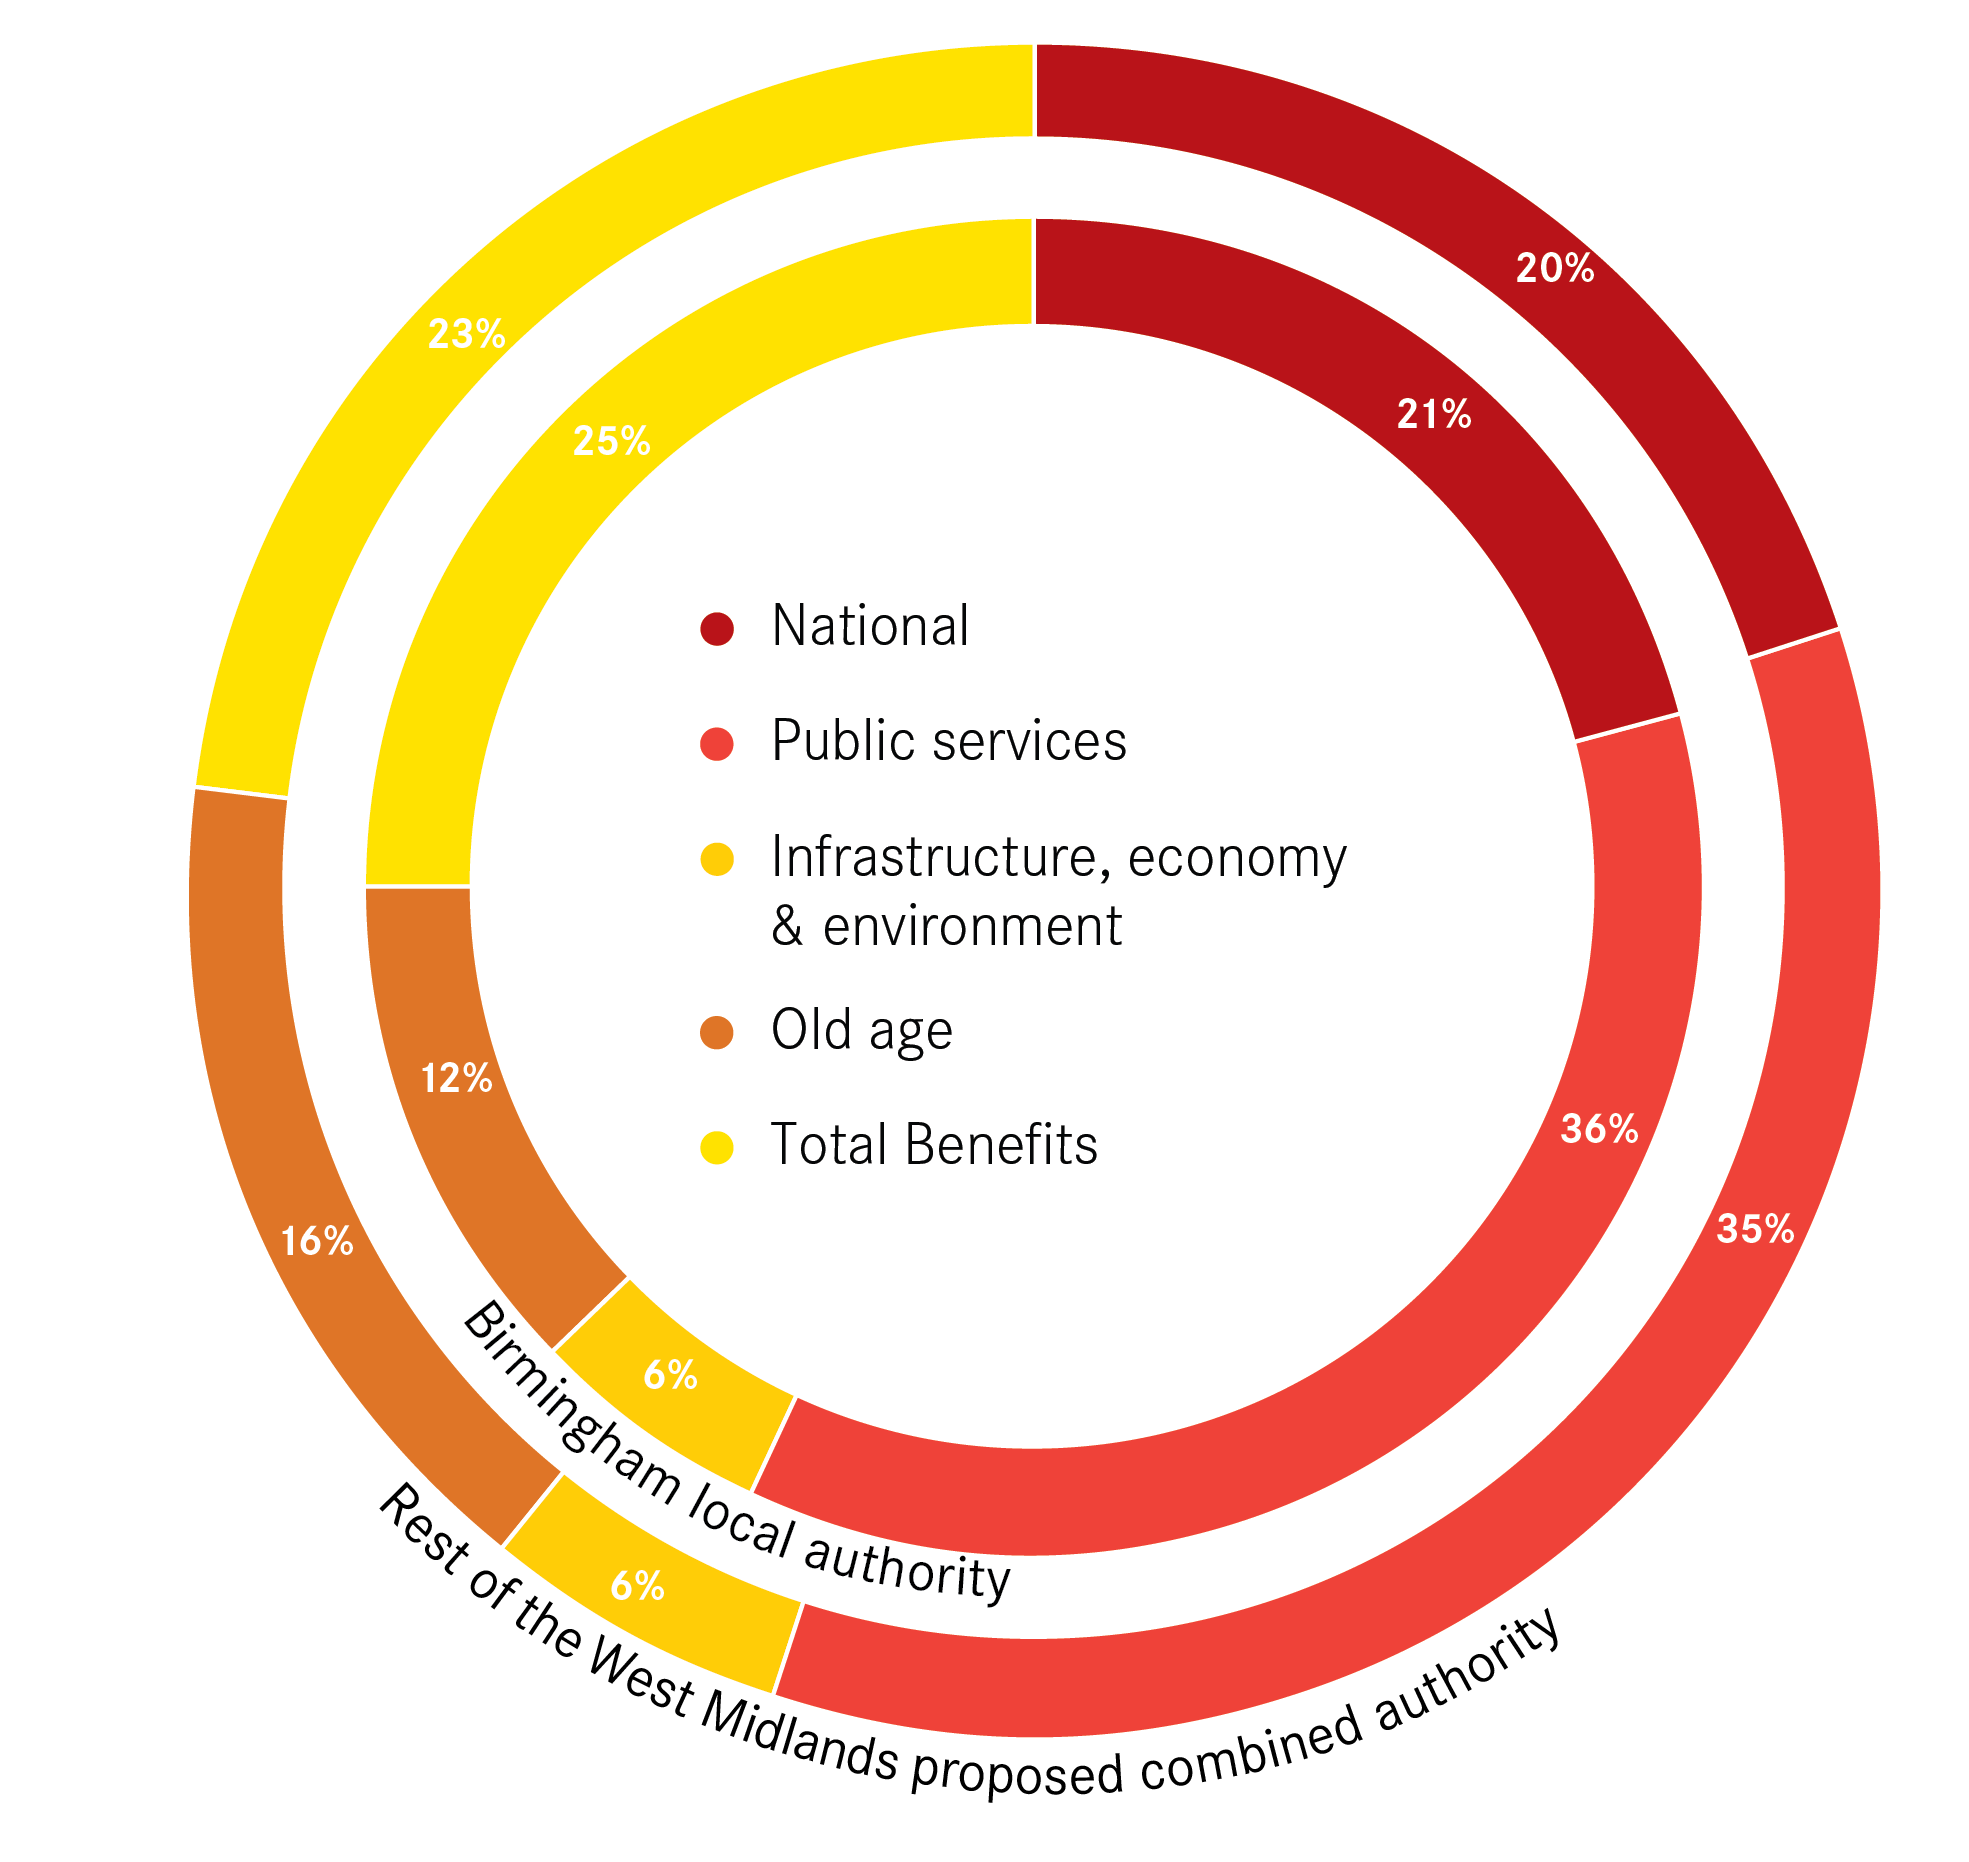
The main variation comes in the make-up of spend. As Figure 17 shows, core urban authorities accounted for a higher share of benefit spend than other local authorities in the city-region, and outer local authorities accounted for a higher share of pensions spend in the city-region (reflecting the difference in the make-up of population across local authorities). For example, Manchester accounted for 25 per cent of unemployment benefits and 26 per cent of housing benefits in Greater Manchester, despite accounting for only 19 per cent of the population in the city-region. In contrast it only accounted for 12 per cent of expenditure on old age (most of which was pensions). As a result of the cost of housing in London and Inner London in particular, housing benefit accounted for around 8 per cent of all spend, compared to 5 per cent in Birmingham and Manchester local authorities.
Figure 17: Share of public expenditure across city-regions


Summary
- The core urban authorities are the main generators of tax within city-regions. Labour taxes, reflecting both the concentration of jobs and the higher paid nature of these jobs, are the main contributors to this. Meanwhile council tax makes a relatively larger contribution in other authorities.
- Core urban authorities also have higher levels of spend, although the divergence between authorities tends to be lower. Part of this reflects the larger populations of these authorities, but it also reflects the higher benefit spend on this population.
- Public services spending makes up the majority of spend in each of the local authorities, irrespective of whether they are the core urban authorities or otherwise.